

Abstract
Reverse-phase chromatography, aqueous gel exclusion, and nonaqueous gel exclusion were assessed as procedures for preparative fractionation of the tumor-localizing product hematoporphyrin derivative. Porphyrin accumulation, fluorescence, and photodynamic cytotoxicity were monitored using the murine Sarcoma 180 tumor. Aqueous gel exclusion chromatography can provide a hematoporphyrin derivative fraction enriched in the tumor-localizing component. A further enrichment occurs when this procedure is carried out at 55°C, but nonlocalizing porphyrins could not be eliminated. While providing a better separation, reverse-phase chromatography cannot provide a tumor-localizing fraction free from contaminating protoporphyrin. However, this and other contaminants can be eliminated from the tumor-localizing fraction via nonaqueous gel exclusion chromatography. This latter separation provides two tumor-localizing products: (a) a fast-eluting fraction enriched in the major photosensitizing component(s); and (b) a more complex slowly eluting fraction enriched in fluorescence localizers.
INTRODUCTION
A mixture of porphyrins derived from HP3 and termed HPD has been used for tumor localization and therapy (1, 2). These phenomena are based on the ability of HPD components to selectively accumulate at tumor loci. Tumor phototherapy derives from the resulting photosensitization (3) of neoplastic tissues. Host organs also accumulate HPD components (4), but the preferential drug uptake at malignant loci is sufficient for photo-dynamic tumor destruction without injury to adjoining normal tissues.
There have been many reports on the reverse-phase HPLC analysis of HPD (5–17). Two-thirds of the product consists of porphyrins which are not tumor localizers: HP, HVD, and PP (1). The tumor-localizing fraction can be partially separated from other HPD components by aqueous gel exclusion chromatography (1, 8, 18). We have reported on use of a nonaqueous gel exclusion system for partial resolution of HPD (19). Moan's group (11, 15, 16) described HPLC studies which suggest that the tumor-localizing fraction is composed of a complex mixture of at least 2 classes of porphyrins. Dougherty (18) suggested that the tumor-localizing component of HPD consisted of 2 HP molecules joined via an ether linkage. From results to be described else- where, we have proposed an alternative structure. In either case, multiple isomeric forms are likely, complicating analytical and preparative separations. In this report, we describe procedures for HPD fractionation using reverse-phase, aqueous, and nonaqueous gel exclusion techniques. The latter provided a 2 HPD tumor-localizing fractions, in agreement with Moan's observation.
MATERIALS AND METHODS
Porphyrins
HP was purchased from Porphyrin Products, Logan, UT. HPD was prepared from HP as described previously (4), except that the concentration of HP acetates in the hydrolysis step was 40 mg/ml. At higher acetate concentrations, the yield of the tumor-localizing fraction is improved (10, 18). After 15 min, the mixture was diluted 1:1 with 0.1 n NaOH, stirred for 15 min to hydrolyze any remaining HP acetates, and then neutralized with 0.1 m HCI. The product was diluted with water to a final porphyrin concentration of 10 mg/ml and stored at −20°C.
Reverse-Phase Chromatography
Analytical HPLC studies were carried out with a Spectra-Physics SP-8700 solvent delivery system, using a Waters Radial-Pak C8 cartridge (10-μm spherical particles) in a Waters Z-module with a CN guard column (10). The column was eluted with a 30-min linear gradient of 70 to 100% methanol in 3 mm aqueous tert-butylammonium phosphate, pH 3.5. The initial flow rate was 1 ml/min; this was linearly increased to a final value of 1.5 ml/min. The column was then eluted with methanol for an additional 15 min (1.5 ml/min). Absorbance at 400 nm was monitored with a Spectraflow Absorbance Meter Model 773. Plotting and integration of fluorescence and absorbance peaks were carried out with a Spectra-Physics SP-4270 integrator.
Preparative reverse-phase separations were carried out on a 2.5- × 15-cm diameter glass column containing octylsilane, with a 40-μm average particle diameter (J. T. Baker Chemical Co.). This column was obtained from the Ace Glass Co., Vineland, NJ, and utilized the Michel-Miller design. Solvent systems were prepared with an all-glass gradient maker and were pumped at 5 to 10 ml/min with an RP-SYX metering pump (Fluid Metering, Inc., Oyster Bay, NY). In a typical preparation, HPD (10 mg) was dissolved in 5 ml of 50% methanol and applied to the column. Elution was carried out using a linear gradient (total volume, 150 ml) of 65 to 100% methanol (remainder, 3 mm aqueous tert-butylammonium phosphate, pH 3.5), followed by 50 ml of methanol. This procedure can provide a tumor-localizing product free of HP, HVD, and PP, if all material which elutes after PP is collected (10). However, a portion of the tumor-localizing fraction will be lost (see Chart 1).
Chart 1.

Reverse-phase HPLC analysis of HPD.
Gel Exclusion Chromatography
A 1 × 15-cm Bio-Gel P-10 column (100 to 200 mesh) was used to prepare HPD fractions enriched in the tumor-localizing component (1, 8, 18). HPD (1 mg) was applied to the column in a 1-ml aqueous solution at pH 7. The column was eluted with distilled water at 22°C or 55°C. The elution pattern produced by formamide:water (1:1) at 20°C was also examined.
Nonaqueous gel exclusion fractionation was carried out using a 5- × 30-cm column of LH-20 (Pharmacia Fine Chemicals, Inc., Piscataway, NJ) eluted with tetrahydrofuran:methanol:3 mm phosphate buffer, pH 7.0 (2:1:1). HPD (100 mg) was dissolved in 40 ml of solvent and eluted through this column at a flow rate of 4 ml/min. The absorbance of the eluate was monitored at 500 nm; selected fractions were pooled and analyzed by HPLC. Analytical HL-20 separations were carried out on a 0.7- × 20-cm column using a series of dyes of known molecular weight. Absorbance was monitored at appropriate wavelengths, and the elution volume for each dye was recorded.
Biological Procedures
Uptake and photosensitization by porphyrins were measured in vitro as described before (20), with a few modifications. Sarcoma 180 cells were incubated with different fractions for 16 h at 37°C and then washed in fresh medium for 30 min at 37°C to remove readily diffusible porphyrins. Accumulated fluorescence was measured as described below after suspension of cell pellets in 50 mm HEPES buffer, pH 7.4. For determination of the total porphyrin content, replicate cell pellets were dispersed in 0.8 ml of HEPES (pH 7.4) containing 10 mm CTAB, and this solution was mixed with 2 ml of CHCI3:CH3OH (1:1). After thorough shaking, the mixtures were separated by centrifugation at room temperature, and the bottom phases were removed and evaporated under nitrogen. The porphyrin residues were taken up in 0.5 ml of 0.5 m HCI and then heated to 100° C for 30 min in sealed tubes. Each hydrolysate was then cooled, neutralized with 1 m NaOH, mixed with 0.1 ml of 100 mm CTAB, and brought to a final volume of 1 ml with water. The hydrolysis step converts the poorly fluorescent tumor-localizing fraction to HP plus HVD (18). Fluorescence of the hydrolysates was determined using an excitation wavelength of 400 nm, with fluorescence integrated over 600 to 710 nm. All such measurements were obtained with a Perkin-Elmer MPF-44B fluorometer.
Photosensitization was monitored using suspensions of porphyrin-loaded cells in 0.9% NaCI solution at 0°C. These suspensions were irradiated with fluorescent light (590 to 640 nm, 10 watts/sq m; total fluence, 6 kJ/sq m) for 10 min, and the cells were collected and suspended in fresh growth medium at 37°C. The effects of photoirradiation on concentrative uptake of labeled cycloleucine and cell viability were measured as described in Ref. 2.
Studies of porphyrin localization in vivo were carried out using Swiss mice bearing the Sarcoma 180 tumor (19). Tumor was isolated 48 h after administration of porphyrin (7.5 mg/kg). The tumors were frozen and crushed to a powder at −40°C. This material was homogenized in 20 volumes of 50 mm HEPES buffer, pH 7.4, containing 10 mm CTAB. Two ml of the resulting preparation were shaken with 5 ml of CHCI3:CH3OH (1:1) the lower phase was collected, the solvent was evaporated under nitrogen, and the residue was analyzed for porphyrins as described above. Suspension of the cell debris (after extraction) in 10 mm CTAB indicated no residual porphyrin fluorescence.
RESULTS AND DISCUSSION
HPLC Analysis
Analysis of a typical HPD preparation is shown in Chart 1. Elution times of porphyrin standards were: HP, 11.5 min; HVD (2 isomers), 17.7 and 18.5 min; PP, 24.9 min. The broad band eluting between 22 and 35 min represents the tumor-localizing component (8, 10, 18). A typical preparation contained 30% HP, 20% HVD, 5% PP, and 45% of the tumor-localizing component.
Aqueous Gel Exclusion Separations
When HPD was eluted through a P-10 column at room temperature (solvent, water), the initial fraction was substantially enriched in the tumor-localizing component (Chart 2A). This procedure was initially described by Dougherty (1); a typical P-10 elution profile is shown in Ref. 19. We found that elution of the column at 55°C resulted in a further elimination of HP and HVD (Chart 2B), providing a product which was almost identical with that eluted with formamide:water (1:1) (Chart 2C). Use of the elevated temperature apparently de-creases the aggregation of PP and HVD, resulting in a somewhat improved separation of these porphyrins from the tumor-localizing fraction. The solvent containing formamide had a similar effect. These results indicate that aqueous gel exclusion chromatography is useful for removal of HP and HVD but that complete elimination of HVD and PP is not feasible.
Chart 2.
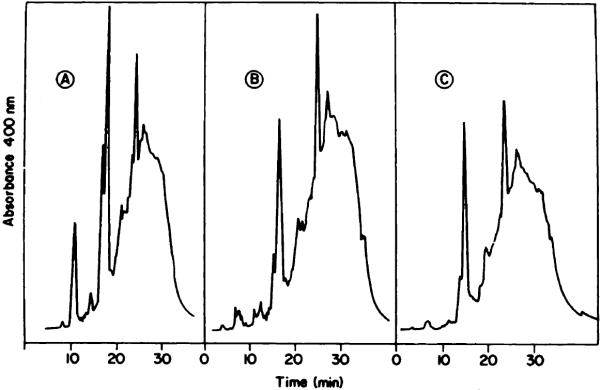
HPLC analysis of the first-eluted HPD fractions from a P-10 column. A, solvent, water at 20°C; B, solvent, water at 55°C; C, solvent, formamide:water (1:1) at 20°C.
Preparative Reverse-Phase Chromatography
Efforts at resolution of HPD via this system were only partly successful. As suggested by the data shown in Chart 1, removal of HP and HVD is feasible. However, since PP elutes with some of the tumor-localizing fractions, removal of this porphyrin cannot be accomplished by a reverse-phase system. Furthermore, the reverse-phase column is sensitive to overloading; application of more than 5 mg of HPD to a 2.5 × 10-cm column substantially degrades the separation. Optimal use of a reverse-phase column for preparative separations therefore requires prior removal of the bulk of the HP and HVD fractions, e.g. by gel exclusion chromatography.
Nonaqueous Gel Exclusion
This procedure can provide a fractionation of HPD not possible by methods described previously. The elution pattern (500 nm absorption) of HPD through an LH-20 column is shown in Chart 3. An analysis of the 3 major fractions by HPLC is shown in Chart 4. A represents fractions 1 to 3 from the LH-20 column; B represents Fractions 4 to 5; C represents fractions 6 to 11. HPLC analysis of A (Chart 4) reveals a broad band with no apparent delineation of multiple products. This material resembles the final fraction eluted from a preparative reverse-phase column (10). HPLC analysis of B indicates the presence of HP, HVD, PP, and a tumor-localizing fraction which revealed distinct peaks during the HPLC analysis. C consisted of 3 monomeric porphyrins, HP, HVD (2 isomers), and PP (Chart 4). The LH-20 column can therefore effect a separation of the tumor-localizing fraction from contaminating PP, unlike the reverse-phase system (Chart 1).
Chart 3.
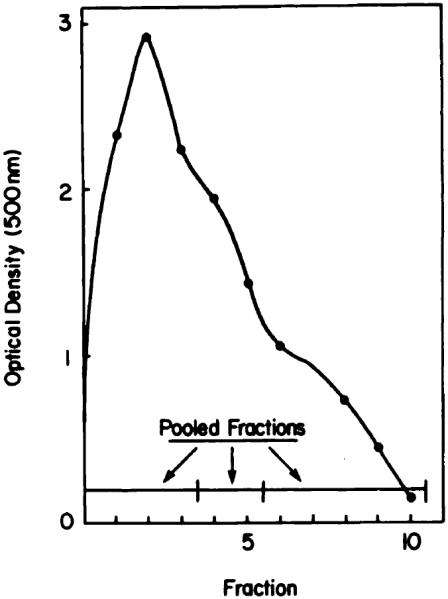
Preparative fractionation of HPD on an LH-20 column. Absorbance at 500 nm was monitored; specified fractions were pooled for HPLC analysis.
Chart 4.

HPLC analysis of pooled HPD fractions eluted from an LH-20 column (Chart 3). A, Fractions 1 to 3; B, Fractions 4 and 5; C, Fractions 6 to 10.
The LH-20 column can separate compounds via exclusion, adsorption, and partition phenomena (21). In order to provide information on the factors affecting the elution profile of HPD, we examined a series of anionic (eosin, hematoporphyrin, merocyanine 540, rose bengal), cationic (methylene blue), and neutral (neutral red) dyes on an analytical LH-20 column. We observed a generally poor correlation between relative elution volume versus molecular weight, with some exceptions (Chart 5). The anomalously high elution volumes of rose bengal and eosin Y on the LH-20 column are probably related to adsorption phenomena. Since the first-eluted HPD fraction appears almost at the void volume, the molecular weight of this material may be greater than the provisionally assigned value of 1200 (18). However, in view of the multiple factors involved in separation, no firm molecular weight assignments of the LH-20 fractions can be made.
Chart 5.
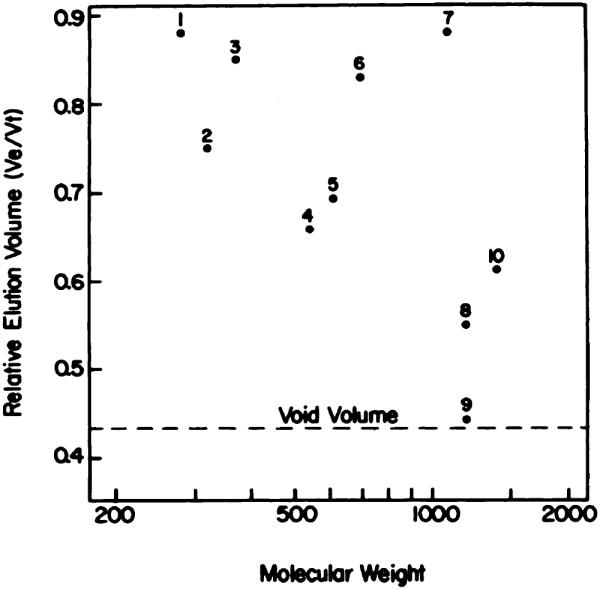
Relative elution volume versus molecular weight of a series of dyes on an analytical LH-20 column. 1, neutral red; 2, methylene blue; 3, phenol red; 4, merocyanine 530; 5, hematoporphyrin; 6, eosin Y; 7, rose bengal; 8, Fraction B (Chart 4); 9, Fraction A (Chart 4); 10, vitamin B12.
Moan's group (12, 15, 16) has described behavior of HPD on reverse-phase HPLC which also suggests the presence of 2 classes of localizing components; both a series of relatively sharp peaks and a broad underlying peak were observed. The use of nonaqueous gel exclusion chromatography provides a means for separation of these 2 HPD fractions. While the basis for separation of porphyrin components by the LH-20 column is not completely clear, the appearance of HP, HVD, and PP in the final fraction (Fraction C) suggests that molecular weight is one criterion.
Stability of the Tumor-localizing HPD Fraction
In aqueous solution, this fraction is stable to alkaline but not acid hydrolysis (18). We examined the stability of Fraction A (Chart 4) from the LH-20 column in aqueous solution at pH 7.5 as a function of time and temperature. After 100 min at 100°C, approximately 10% of the product was hydrolyzed to HP and HVD. A similar degree of hydrolysis occurred over a 100-day storage at 4°C (Chart 6). Degradation was undetectable upon storage of the tumor-localizing HPD fraction at −20°C or −70°C over a 100-day interval. These results suggest that storage of aqueous HPD solutions at 4°C will be accompanied by gradual loss of tumor-localizing capacity.
Chart 6.

Degradation of Fraction A (Chart 4) when held at (left) 100°C for 100 min or (right) 4°C for 100 days.
Fluorescence and Absorbance Studies
The relative fluorescence yield and absorbance ratio (400 nm:375 nm) of different porphyrin fractions are shown in Table 1. The fluorescence yield is defined here as the ratio of integrated fluorescence (600 to 750 nm) to absorption at the excitation wavelength (400 nm). This ratio is a reflection of the dissociation of the porphyrin fractions in a given solvent (Chart 7); appearance of a shoulder at 375 in the Soret region being indicative of incomplete dissociation of aggregates (22, 23).
Table 1. Biophysical properties of HPD and HPD fractions.
Porphyrins used in this study were HPD (Chart 2), HPD fractions eluted from a LH-20 column (Chart 4), and HP purified by HPLC. Data presented here represent the mean of 3 separate determinations with a variation of less than ±5%.
| A400/375a |
ϕ
b
|
|||
|---|---|---|---|---|
| Fraction | Methanol | CTAB | Methanol | CTAB |
| HPD | 1.2 | 1.45 | 7.9 | 14 |
| LH-20 A | 0.86 | 1.2 | 2.1 | 8.8 |
| LH-20 B | 0.9 | 1.24 | 7.6 | 13 |
| LH-20 C | 1.15 | 1.4 | 12.0 | 13.1 |
| HP | 1.8 | 1.8 | 13.3 | 13.5 |
Ratio of absorbance (400/375 nm) of 1-μg/ml solutions in methanol or 10 mm CTAB, pH 7.4.
Fluorescence yield of porphyrin fractions (1 μg/ml) dissolved in methanol or 10 mm CTAB, pH 7.4.
Chart 7.

Absorption patterns of 1-μg/ml porphyrin solutions in water, methanol (MeOH), or 10 mm aqueous CTAB. Left, Fraction A (Chart 4); right, HP. For the latter compound, the tracings in CTAB and methanol were identical.
Data shown in Table 1 indicate that fluorescence of Fraction A is quenched in methanolic solution. The Soret band of Fraction A in this solvent (Chart 7) is indicative of aggregate formation (24). The enhanced fluorescence yield in 10 mm CTAB, together with the sharp Soret band, shows that aggregates of Fraction A can be dissociated by this detergent. The nature of the aggregates is unknown; micelle formation may be involved (25). Both HP and Fraction C from the LH-20 column show high fluorescence yields in methanol or CTAB, suggesting minimal aggregation in the former solvent. Fluorescence studies in methanol versus CTAB suggest aggregation of Fraction B in methanol, but not to the extent observed with Fraction A.
Tumor Localization Studies
While absorbance at 400 nm can be used to quantitate levels of HPD components which have localized in neoplastic tissues in vivo, the presence of endogenous materials which absorb at 400 nm complicates the inter-pretation of results. Use of fluorescence (excitation, 400 nm; emission, 620 to 630 nm) provides a more selective means of porphyrin detection, but the poor fluorescence yield of the tumor-localizing fraction (Table 1; Ref. 10) compromises the data. We found that hydrolysis of the tumor-localizing fraction in 0.5 m HCI for 60 min results in quantitative conversion into HP and HVD, so that fluorescence detection could then be used to monitor drug uptake.
Data shown in Table 2 indicate that total porphyrin uptake into nondiffusible pools by Sarcoma 180 cells in vivo and in vitro is greatest for the most hydrophobic HPD fraction (Chart 4A). However, a less hydrophobic fraction (Chart 4B) provided a 2-fold greater localized fluorescence. Studies on photodynamic effects on Sarcoma 180 cells in vitro indicate that the phototoxic inhibition of cycloleucine transport was correlated with fluorescence localization, rather than total porphyrin uptake. In contrast, photodynamic impairment of cell viability was correlated with total porphyrin uptake.
Table 2. Biological properties of HPD and HPD fractions.
Studies carried out in vitro involved exposure of cells to 10-μg/ml levels of porphyrins as described in the text; accumulation in vivo was measured after administration of porphyrins (7.5 mg/kg) to tumor-bearing mice. All data represent the mean of 3 determinations with a variation of less than ±10%.
| Sarcoma 180 in vitro |
Sarcoma 180 in vivo |
|||||
|---|---|---|---|---|---|---|
| Fraction | Fluora | Uptakeb | Cycloleucinec | Viabilityd | Fluora | Uptakeb |
| HPD | 100 | 140 | 50 | 20 | 100 | 2.5 |
| LH-20 A | 105 | 217 | 50 | 10 | 110 | 4.2 |
| LH-20 B | 204 | 160 | 33 | 17 | 175 | 7.3 |
| LH-20 C | 34 | 23 | 80 | 90 | 10 | 0.5 |
| HP | 5 | 7 | 98 | 100 | 3 | 0.2 |
Relative integrated fluorescence (600 to 700 nm) of Sarcoma 180 cells incubated with porphyrin fractions as described under “Material and Methods” and suspended in HEPES-buffered 0.9% NaCI solution, pH 7.4. These values are normalized, with fluorescence of cells treated with HPD = 100.
Porphyrin uptake estimated from the fluorescence of acid-hydrolyzed S-180 cells in 10 mm aqueous CTAB, pH 7.4. Values are expressed in terms of μg porphyrin/g cells (wet weight), based on a standard curve relating fluorescence to porphyrin concentration for each fraction.
Accumulation of labeled cycloleucine by Sarcoma 180 cells treated with porphyrin fractions in vitro and then irradiated as described under “Materials and Methods.” Data are expressed in terms of percentage of control values (cycloleucine uptake by untreated cells representing a <2.5-fold concentration).
Viability (percentage of control) determined as described in Ref. 19.
These results suggest that fractionation of HPD may offer advantages with regard to subsequent clinical procedures. Optimal tumor localization for phototherapy might optimally be carried out with Fraction A (Chart 4). Porphyrin localization for tumor detection via fluorescence endoscopy should be potentiated by Fraction B. The preferential localization of these different fractions in skin is currently being examined, since transient skin photosensitization remains the major adverse reaction to phototherapy (1).
Footnotes
Supported by Grant CA 23378 from the National Cancer Institute, NIH, Department of Health and Human Services.
The abbreviations used are: HP, hematoporphyrin; CTAB, cetyltrimethylammonium bromide; HPD, hematoporphyrin derivative; HVD, hydroxyethylvinyldeuteroporphyrin; PP, protoporphyrin; HPLC, high-pressure liquid chromatography; HEPES, 4-(2-hydroxyethyl)-1-piperazineethanesulfonic acid.
REFERENCES
- 1.Dougherty TJ, Boyle DG, Weishaupt KR, Henderson BA, Potter WR, Bellnier DA, Wityk KE. Photoradiation therapy—clinical and drug advances. In: Kessel D, Dougherty TJ, editors. Porphyrin Photosensitization. Plenum Publishing Corp; New York: 1983. pp. 3–13. [DOI] [PubMed] [Google Scholar]
- 2.Kessel D. Hematoporphyrin and HPD: photophysics, photochemistry and Phototherapy. Photochem. Photobiol. 1984;39:851–859. doi: 10.1111/j.1751-1097.1984.tb08871.x. [DOI] [PubMed] [Google Scholar]
- 3.Spikes J. Photodynamic reactions in photomedicine. In: Regan JD, Parrish JA, editors. The Science of Photomedicine. Plenum Publishing Corp; New York: 1983. pp. 113–144. [Google Scholar]
- 4.Gomer CJ, Dougherty TJ. Determination of [3H]- and [14C]hematoporphyrin derivative distribution in malignant and normal tissue. Cancer Res. 1979;39:146–151. [PubMed] [Google Scholar]
- 5.Berenbaum MC, Bonnett R, Scourides PA. In vivo biological activity of the components of haematoporphyrin derivative. Br. J. Cancer. 1982;45:571–581. doi: 10.1038/bjc.1982.94. [DOI] [PMC free article] [PubMed] [Google Scholar]
- 6.Bonnett R, Ridge RJ, Scourides PA. On the nature of haematoporphyrin derivative. J. Chem. Soc. Perkin I. 1981:3135–3140. [Google Scholar]
- 7.Clezy PS, Hai TT, Henderson RW, van Thuc L. The chemistry of pyrrolic compounds. XLV. Haematoporphyrin derivative: haematoporphyrin diacetate as the main product of the reaction of haematoporphyrin with a mixture of acetic and sulfuric acids. Aust. J. Chem. 1980;33:585–597. [Google Scholar]
- 8.Evenson JF, Sommer S, Moan J, Christensen T. Tumor-localizing and photosensitizing properties of the main components of hematoporphyrin derivative. Cancer Res. 1984;44:482–486. [PubMed] [Google Scholar]
- 9.Hilf R, Leakey PB, Sollott SJ, Gibson SL. Photodynamic inactivation of R3230AC mammary carcinoma in vitro with hematoporphyrin derivative: effects of dose, time and serum on uptake and phototoxicity. Photochem. Photobiol. 1983;37:633–642. doi: 10.1111/j.1751-1097.1983.tb04532.x. [DOI] [PubMed] [Google Scholar]
- 10.Kessel D, Cheng M-L. On the preparation and properties of dihematoporphyrin ether, the tumor-localizing component of HPD. Photochem. Photobiol. 1985;41:277–282. doi: 10.1111/j.1751-1097.1985.tb03485.x. [DOI] [PubMed] [Google Scholar]
- 11.Moan J, Sommer S. Fluorescence and absorption properties of the components of hematoporphyrin derivative. Photobiochem. Photobiophys. 1981;3:93–103. [Google Scholar]
- 12.Moan J, Sommer S. Uptake of the components of hematoporphyrin derivative by cells and tumors. Cancer Lett. 1983;21:167–174. doi: 10.1016/0304-3835(83)90204-5. [DOI] [PubMed] [Google Scholar]
- 13.Moan J, Christensen T, Sommer S. The main photosensitizing components of hematoporphyrin derivative. Cancer Lett. 1982;15:161–166. doi: 10.1016/0304-3835(82)90046-5. [DOI] [PubMed] [Google Scholar]
- 14.Moan J, McGhie JB, Christensen T. Hematoporphyrin derivative: photosensitizing efficiency and cellular uptake of its components. Photobiochem. Photobiophys. 1982;4:337–345. [Google Scholar]
- 15.Moan J. Fluorescence of porphyrins in cells. In: Andreoni A, Cubeddu R, editors. Porphyrins in Tumor Therapy. Plenum Publishing Corp; New York: 1983. pp. 109–124. [Google Scholar]
- 16.Sommer S, Moan J, Christensen T, Evenson JF. A chromatographic study of hematoporphyrin derivatives. In: Andreoni A, Cubeddu R, editors. Porphyrins in Tumor Therapy. Plenum Publishing Corp; New York: 1983. pp. 81–91. [Google Scholar]
- 17.Swincer AG, Trenerry VC, Ward AD. The analysis and some chemistry of haematoporphyrin derivative. In: Doiron DR, Gomer CJ, editors. Porphyrin Localization and Treatment of Tumors. Alan R. Liss; New York: 1984. pp. 285–300. [PubMed] [Google Scholar]
- 18.Dougherty TJ. The structure of the active component of hematoporphyrin derivative. In: Andreoni A, Cubeddu R, editors. Porphyrins in Tumor Therapy. Plenum Publishing Corp; New York: 1983. pp. 23–35. [Google Scholar]
- 19.Kessel D, Chou TC. Tumor-localizing components of the porphyrin preparation hematoporphyrin derivative. Cancer Res. 1983;43:1994–1999. [PubMed] [Google Scholar]
- 20.Kessel D. Determinants of hematoporphyrin-catalyzed photosensitization. Photochem. Photobiol. 1982;36:99–101. doi: 10.1111/j.1751-1097.1982.tb04347.x. [DOI] [PubMed] [Google Scholar]
- 21.Sephadex LH-20, Chromatography in Organic Solvents. Pharmacia Fine Chemicals, Inc; Piscataway, NJ: [Google Scholar]
- 22.Brown SB, Shillcock M, Jones P. Equilibrium and kinetic studies of the aggregation of porphynns in solution. Biochem. J. 1976;153:279–285. doi: 10.1042/bj1530279. [DOI] [PMC free article] [PubMed] [Google Scholar]
- 23.Kessel D, Rossi E. Determinants of porphyrin-sensitized photooxidation characterized by fluorescence and absorption spectra. Photochem. Photobiol. 1982;35:37–41. [Google Scholar]
- 24.Margalit R, Shaklai N, Cohen S. Fluorometric studies on the dimerization equilibrium of protoporphyrin IX and its haemato derivative. Biochem. J. 1983;209:547–552. doi: 10.1042/bj2090547. [DOI] [PMC free article] [PubMed] [Google Scholar]
- 25.Ricchelli F, Grossweiner LI. Properties of a new state of hematoporphyrin in dilute aqueous solution. Photochem. Photobiol. 1984;40:599–606. doi: 10.1111/j.1751-1097.1984.tb05347.x. [DOI] [PubMed] [Google Scholar]