

Abstract
Lung parenchyma is normally considered to be isotropic, that is, its properties do not depend upon specific preferential directions. The assumption of isotropy is important for both modeling of lung mechanical properties and quantitative histologic measurements. This assumption, however, has not been previously examined at the microscopic level, in part because of the difficulty in large lungs of obtaining sufficient numbers of small samples of tissue while maintaining the spatial orientation. In the mouse, however, this difficulty is minimized. We evaluated the parenchymal isotropy in mouse lungs by quantifying the mean airspace chord lengths (Lm) from high-resolution histology of complete sections surrounded by an intact continuous visceral pleural membrane. We partitioned this lung into 5 isolated regions, defined by the distance from the visceral pleura. To further evaluate the isotropy, we also measured Lm in two orthogonal spatial directions with respect to the section orientation, and varied the sample line spacing from 3 to 280 μm. Results show a striking degree of parenchymal anisotropy in normal mouse lungs. The Lm was significantly greater when grid lines were parallel to the ventral–dorsal axis of the tissue. In addition the Lm was significantly smaller within 300 μm of the visceral pleura. Whether this anisotropy results from intrinsic structural factors or from nonuniform shrinkage during conventional tissue processing is uncertain, but it should be considered when interpreting quantitative morphometric measurements made in the mouse lung.
Keywords: Morphometry, Histology, Alveolar structure, Heterogeneity, Stereology, Isotropy
INTRODUCTION
One of the key assumptions, important for both modeling of lung mechanical properties and quantitative histologic measurements, is that the parenchyma of a healthy lung is isotropic.13 A material is isotropic if its properties do not depend upon specific preferential directions. Practically, this means that it does not matter how you look at a piece of the parenchyma—as long as you pick random sections, you should not be able to tell where the sample came from nor in which direction you are looking. In recent work with mouse lung histology, however, it became apparent that this assumption of isotropy might not be true in the mouse. We therefore designed the present study to examine the spatial dependence of airspace chords in normal mouse lungs.
For investigation of changes in lung parenchymal structure, the mean linear intercept (MLI) or mean airspace chord length (Lm) has long been utilized as a simple estimate of lung air volume/surface (V/S) ratio. In fact with few assumptions about alveolar shape and sampling, the MLI can be shown to be approximated by 4 times the V/S.2,23 Although the Lm is commonly referred to in seminars and papers as alveolar diameter, it does not really measure that. Indeed, given the complex shape of ducts and alveoli, and the complete absence of information on the heterogeneity of individual alveolar size and shape, even the notion of a mean alveolar diameter is as yet unclear.17 Nevertheless, despite the potential bias associated with the measurement,24 either the Lm or MLI (which differ only by the thickness of the alveolar septa) has had a long history of frequent use as a quantitative way to assess changes in airspace size with a variety of normal physiologic and pathologic interventions. An additional advantage of obtaining large numbers of alveolar chords is that not only can a mean Lm be determined, but different metrics from the chord length distribution can also be utilized.8,10
Although the small size of the mouse lung is often problematic for functional studies, for histologic studies this smallness actually has the great advantage of providing a unique opportunity to examine the effect of sample heterogeneity within entire regions bounded by the visceral pleura. To this end, we obtained high resolution histology of sections surrounded by an intact continuous visceral pleural membrane. We then partitioned these lung sections into 5 isolated regions, defined by the linear distance from the visceral pleura. To further evaluate the isotropy, we also measured Lm in two orthogonal spatial directions with respect to the section orientation, and varied the sample line spacing from 3 to 280 μm. Results show that the mouse lung is not isotropic nor homogeneous, showing systematic differences in Lm, depending on where and how the tissue is sampled.
METHODS
Histology
Under a protocol approved by the Johns Hopkins Animal Care and Use Committee, 11 inbred 10–12-week-old male mice C57BL/6 mice (Jackson Laboratories, Bar Harbor, ME) were anesthetized with ketamine (75 mg/kg) and xylazine (15 mg/kg), intubated, and ventilated with 100% oxygen. To determine the air volume at full inflation (defined as the volume at 35 cm H2O transthoracic pressure), we inflated the lungs from a degassed state. This was accomplished by stopping ventilation and occluding the tracheal cannula for 5 min, which led to complete degassing of the lungs by absorption atelectasis and cessation of cardiac activity. Quasi-static PV curves were performed as previously reported,22 and lung volume at 35 cm H2O was recorded. The mean (±SEM) lung volume at this pressure was 1.2 ± 0.04 mL. After completing the PV curves, lungs were returned to a transthoracic pressure of 0 cm H2O, whereupon they were immediately inflated with warmed 1% low melt agarose at 25–30 cm H2O.7 Pressure was maintained for about 1 min, by which time the agarose began to harden substantially. The lungs were then sealed with a stopcock, and the whole animal was placed in a refrigerator at 4 °C for at least 2 h. The mice were then removed, and the stiffened inflated lungs were excised and placed in 10% phosphate buffered formalin for at least a week. The fixed lung volume (airspace plus tissue) was measured by water displacement.19 For these C57BL/6 mice the mean (±SEM) fixed lung volume (airspace plus tissue) was 1.05 ± 0.04, which is 90% of the air-filled lung. The left lung then was dissected free and the cranial and caudal 2–3 mm along the its long axis was removed. The remaining tissue was cut into three 2–3 mm thick sections transverse to the cranial–caudal axis, dehydrated in ethanol, and embedded in glycol methacrylate (Polysciences Inc., Warrington, PA). Three micron thick sections were cut with a microtome and stained with coomassie blue. One section cut from the cranial end of each 2–3 mm block was analyzed in each mouse. Five to six images were acquired using a SPOT Flex digital camera (Model 15.2) at 40× magnification. These images were chosen to include all lung tissue in the entire cross sectional area of each section, and the images thus acquired were then stitched together using PTGui photo stitching software (www.PTGui.com). This stitching resulted in a complete distortion-free section bounded by the visceral pleura with a resolution of 1.5 μm/pixel. A typical reconstructed image with example of zoom resolution is shown in Fig. 1a. Since in this study we are only interested in the parenchymal airspaces, we needed to exclude all large airways and blood vessels from analysis. For each section, this was done manually by painting the nonparenchymal areas. Fig. 1b shows how this digital image appears after this removal and conversion to black and white for analysis.
FIGURE 1.

(a) Low power high resolution image of complete section of left lung bounded by the visceral pleura cut transverse to the cranial–caudal axis. Labels identify the spatial orientation, and the inset shows zoom details from a local region. (b) Binary image of section in A used for analysis with large airways, vessels, interstitium painted black.
Regions of Interest
We divided each reconstructed image slice from each block into concentric rings based on the distance to the visceral pleura. The thickness of each ring was initially about 7% of the minimal thickness of the lobe, but after seeing the initial results, we also then divided the first ring in half. This first ring then was the most peripheral, limited to 150 μm from the pleural border. The second ring was 0–300 μm from the border, and third and fourth rings were 300–600 and 600–900 μm from the border, respectively. The fifth region was the interior region no closer than 900 μm from the pleura. These regions are shown in Fig. 2, except for the first 150 μm ring which is omitted for clarity.
FIGURE 2.
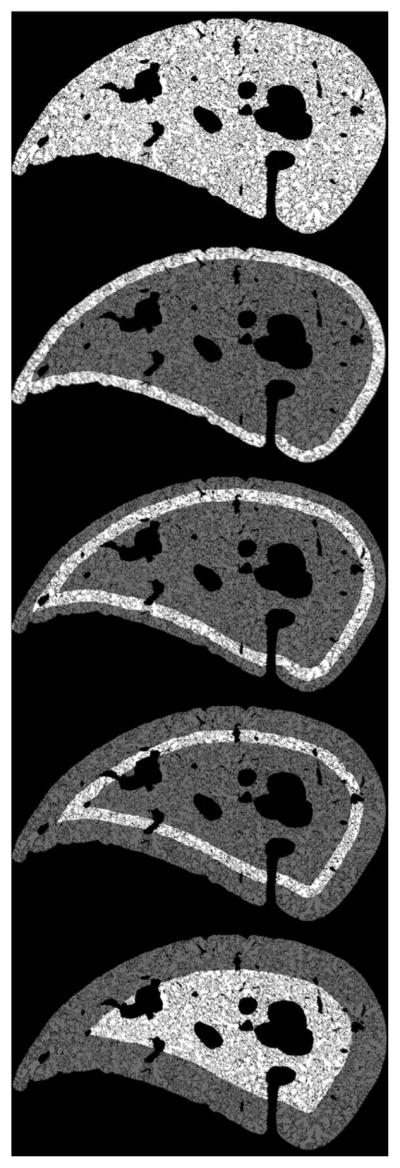
Concentric rings and sections independently analyzed. The bright highlighted regions are the areas analyzed. The thickness of each white ring shown is 300 μm. For the quantitative analysis, the outermost ring shown was divided in half, but this is not shown here for clarity.
Measurement of Lm
We measured the Lm in the whole composite lung slice by overlaying a grid as previously described,8,22 except here the size of the images and grids were much larger. The nominal grid consisted of parallel lines in a 10,000 × 10,000 pixel (≈15 × 15 mm) image. However, to assess the sensitivity of this process to the grid line spacing, we made measurements using 6 sampling grids, with lines spaced at 3, 8, 17, 34, 70, 140, and 280 μm apart. Additionally, to assess the degree of isotropy in the lung tissue, the measurement was done with the grid lines placed in line (horizontal) with or perpendicular (vertical) to the ventral–dorsal axis of the lung slice, as illustrated in Fig. 3. For clarity in this figure we show the 140 μm grids on the original stained slide. The chord lengths were measured using ImageJ software (NIH, Bethesda, MD). The simple macro used to automate this procedure is in the Appendix.
FIGURE 3.

Example of orientation of horizontal (ventral–dorsal) and vertical (lateral–mediastinal) grid lines. Grid line spacing for these images is 140 μm.
Measurement of Tissue Density
Because there has been some criticism of the accuracy of Lm,24 and because our digital automated methods of measuring it are not common, we also used conventional point counting of the different ring regions to measured the air volume density. Changes in Lm should be proportional to changes in air density. We overlaid each of the different regions with a rectilinear grid of points spaced 7.5 μm apart. We used ImageJ to count the points that hit tissue and air in each region and calculated the air volume fraction.
Statistics
We used when appropriate, either a one-way ANOVA with Bonferroni multiple comparison tests, or paired t-tests to determine significance. A p < 0.05 was considered significant.
RESULTS
Effect of Sample Line Spacing
Figure 4a shows the Lm from each of the complete sections in all 11 lungs, obtained with the horizontal (ventral–dorsal) grids as a function of grid line spacing. This figure shows that grid spacing has minimal effect on the Lm, at least for the spacing distances less than 34 μm. As the grid spacing increases there is increasing variability in the measurement. This effect is summarized in Fig. 4b, which shows the standard deviation of the difference between the measurement with a 3 μm grid and that at each more widely spaced grids. The visual variability in the upper figure with increased spacing is reflected by the quantitative increase in SD. This increased variability may reflect the decreasing number of chords sampled as the spacing increases. The total number of chords sampled for each horizontal grid spacing in each lung is shown in Table 1. Note that only 2 sections were analyzed in lungs 6, 8, and 9, but the lower section of the table shows the average number of chords measured per complete section bounded by the visceral pleura. The number of chords measured with the vertical grids is not shown, but this number was always within 5% of that in the horizontal direction.
FIGURE 4.

Influence of line spacing on Lm measurement. (a) Lm measurement from all individual slices from all sections in each animal as a function of grid line spacing. Each line represents data from one mouse. (b) The average standard deviation among mice of the difference between the Lm with 3 μm spacing and each of the other grid line spacings.
TABLE 1.
(a) Total number of chords (sum from all sections) in each lung from each mouse, at the different grid spacings. (b) Average number of chords in each section in all mice.
| Mouse # | 3 μm | 7 μm | 17 μm | 34 μm | 70 μm | 140 μm | 280 μm |
|---|---|---|---|---|---|---|---|
| (a) | |||||||
| 1 | 229,931 | 114,485 | 57,315 | 28,657 | 14,354 | 7238 | 3528 |
| 2 | 185,449 | 92,813 | 46,789 | 23,184 | 11,498 | 5733 | 2879 |
| 3 | 216,887 | 108,343 | 54,255 | 27,144 | 13,593 | 6789 | 3410 |
| 4 | 206,435 | 103,119 | 51,583 | 25,767 | 12,929 | 6408 | 3294 |
| 5 | 234,946 | 117,397 | 58,665 | 29,432 | 14,727 | 7290 | 3731 |
| 6 | 170,349 | 85,063 | 42,666 | 21,359 | 10,685 | 5331 | 2696 |
| 7 | 223,135 | 107,599 | 53,932 | 26,954 | 13,438 | 6743 | 3373 |
| 8 | 128,231 | 64,002 | 32,055 | 16,029 | 7997 | 3963 | 1995 |
| 9 | 126,953 | 63,450 | 31,776 | 15,950 | 7927 | 3980 | 1938 |
| 10 | 254,248 | 127,027 | 63,415 | 31,744 | 15,903 | 7942 | 4033 |
| 11 | 202,533 | 101,041 | 50,741 | 25,322 | 12,630 | 6326 | 3152 |
| (b) | |||||||
| Average chords per section | 72,481 | 36,079 | 18,074 | 9037 | 4515 | 2254 | 1132 |
| SEM | 2467 | 1226 | 607 | 307 | 157 | 78 | 201 |
Note that the average chords in the lower table is not the average of the total chords in each lung, but rather the average number of chords measured per intact lung section.
Effect of Grid Orientation
Figure 5 shows the mean Lm results from each of the mice with the grids placed in the horizontal (ventral–dorsal) or vertical (lateral–mediastinal) direction. As can be seen, in every animal, the Lm is significantly greater with the grids oriented in the ventral–dorsal axis of the lung. This observation was found in all sections of all lungs and is highly significant (p < 0.001). Figure 6 shows the effect of rotating the grids at acute angles in one of the lungs. As can be seen, and as might be expected from Fig. 5, there is a continuous relatively smooth effect of grid angle on the Lm.
FIGURE 5.

Effect of grid orientation on Lm measurement. The Lm is always greater when measured with the horizontal (ventral–dorsal) line orientation compared to that with the lateral–mediastinal orientation (p < 0.0001). These measurements were made with a 17 μm grid spacing, but the same phenomenon occurs with any grid spacing.
FIGURE 6.

Effect of angle of orientation the grids on the mean Lm measurement.
Effect of Distance from Pleura
Figure 7a shows the Lm in the different regions set by the distance from the visceral pleura. These data show that the Lm close to the pleura is significantly smaller than any of the rings more centrally located. This effect was seen to a depth of at least 300 μm from the pleura. Figure 7b shows the air volume density in each of the same regions in Fig. 7a. These data show the same effect as determined with Lm.
FIGURE 7.

(a) Effect of distance from the visceral pleura on Lm. Results show the mean from all the mice, but this quantitative effect was observed in all mice. (b) Effect of distance from the visceral pleura on regional air volume density. Results show the mean from all the mice, but this quantitative effect was observed in all mice. (*—significantly different from all other regions, p < 0.001; #—significantly different from all other regions at p < 0.001, except for 600–900 region p < 0.05).
Effect of Different Macroscopic Lung Regions
Figure 8 shows the Lm found in all the complete sections (cranial, middle, caudal) from each lung. Measurements were made with a grid line spacing of 17 μm. As can be seen there are differences in Lm among these blocks within an animal, but there is no trend for the cranial, middle, or caudal being consistently different from any of the others. The range of animal variability between the different sections in fact appears only slightly less than the variability among the different animals of this strain.
FIGURE 8.

Variability in the Lm from different macroscopic sections [cranial, middle, caudal] in each of the mice. Data shown are only from the ventral–dorsal grid orientation measurements over the whole section with 17 μm grid spacing in each animal, but similar variability is seen with other line spacing and with the vertical lines.
DISCUSSION
The results presented here show that there may be cause for concern in carrying out and interpreting the results from quantitative morphometry in mouse lungs. The ability to select and analyze unbiased samples is not simply done in this species. Our results clearly demonstrate that the structure of the airspaces is heterogeneous and not isotropic in the mouse lung. Before discussing this further we should emphasize that we have deliberately restricted our sample selection to sections of the left lung transverse to the cranial–caudal axis. One of the important issues in lung stereology is how to sample the tissue,24 and to this end, efforts are often made to randomly sample from as widely varied regions as possible. One method that is generally considered to provide unbiased random samples of lung tissue is that of the fractionator.5 Other random sampling methods, such as stratified cascade sampling,3 the orientator,12 or the isector15 have also been employed. In the present work we did not use any of these random sampling methods. In fact, the irony of the situation is that, had we done so, we would have completely missed any chance of observing the inherent anisotropy or inhomogeneity. Our goal was to examine the isotropy of the lung, and we felt it would be better if we focused on lung regions that could be reproducibly observed in lungs from many animals. The left lung of the mouse consists of one lobe, and we were thus able to consistently take three sections from three blocks in the middle two thirds of that lobe separated by at least 2–3 mm. If consistency could not be found within such well-defined biased sample selection, then it would be almost certain to not exist with sampling of other lobes, other regions, and other sample orientation. We do not know if similar variations would obtain in the other lobes, but we have no reason to expect that the others lobes are any more isotropic than what we have observed in the left lung with transverse sectioning.
In deciding how to measure the Lm, we investigated the question of how much to sample the lung. To our knowledge, despite its common usage, there has never been a systematic study of the effect of sampling density on the mean linear intercept or Lm. Our results showing little effect of increasing sampling density at line spacings less than a nominal alveolar size were to some degree to be expected, to the extent that the lung airspaces are relatively random. The most dense sampling we used had lines just 3 μm apart, almost completely covering the entire lung section. This led to about 70,000 chords per lung section (Table 1). With less dense sampling, the Lm showed little variability up to a spacing of 34 μm. With increasing distance, more alveoli are entirely missed, and this resulted in more variability in the measurement of Lm. With the most distant sampling, there were only about 1000 chords measured, which resulted in the greatest variation. These measurements raise the issue of what is the optimal sampling distance. Although there is no definitive answer to this, given the anisotropy and heterogeneity we have observed here, it would seem desirable to attempt to sample every alveolus at least once. In fact, by analogy with the Nyquist-Shannon sampling criterion for digitally sampling analog signals,21 it might be best to take a digital measurement at twice per alveolus. Of course, since we do not have knowledge of what the distribution of alveolar shape and size really is, this could at best only be an approximation. But assuming a nominal diameter of a mouse alveolus to be 50–60 μm, then the optimal spacing should be about 25–30 μm. As our data clearly show, however, sampling at twice this spacing distance (or approximately once per alveolus) will not likely have much effect and is a reasonable objective. Based on our results, however, it seems that measuring only 100–200 alveolar chords per mouse as often recommended6,24 would be highly inadequate, especially if unbiased random sampling of the entire lung is not done properly. And this number is surely orders of magnitude too small if one wants to analyze the chord length distribution.10 Of course the number of alveoli needing to be sampled for just the mean Lm will depend on the interanimal variability, but given the results shown in Fig. 4, if the spacing between grid lines is less than 70 μm, this should be quite sufficient in normal mice. However, the extrapolation of this finding to pathologic lungs or to lungs fixed in a less inflated state is not direct, and it seems likely that a finer grid spacing might be required in proportion to the degree of pathologic heterogeneity in the lung.
What may be of importance to this latter point is the method of fixation. In our study of normal lungs, we attempted to study lungs close to a volume we measured in situ with air inflation. To achieve this, we inflated with warmed agarose, which was then cooled to solidify the lung volume. Even so, the resultant total lung volume is typically only 90% of that at a maximal inflation with air, and fixed airspace volume would be even less. If other methods of fixative instillation are used (such the commonly used formalin instillation), the fixed lung volume may only be about 70% of what a normal air-filled lung capacity might be.11 In such case and with the additional shrinkage caused by the more conventional paraffin embedding, the alveoli would be expected to be correspondingly smaller perhaps with even greater heterogeneity, and the sampling lines may need to be closer together.
In our study we observed three things that characterize the anisotropy and heterogeneity of mouse lung parenchyma: (1) differences in the proximity to the visceral pleura; (2) the effect of orientation of grid lines; and (3) variation among different sections cut with similar spatial orientation.
(1) The fact that Lm closest to the visceral pleura is smaller than in the interior of the lobe (Fig. 7a) may have implications regarding where and how to take high power images for sampling. If one deliberately avoids sampling close to the pleura, then one introduces a bias into the measurement. A completely random unbiased sampling of parenchyma would need to incorporate sufficient tissue close to the pleura to obtain a truly representative average. That this observation does not result from a bias introduced by Lm24 is demonstrated by the observation that it is also present with simple point counting, to measures the air density in these different rings (Fig. 7b).
This observation of regional differences in the parenchyma also has implications for those investigators who study the behavior of alveoli using microscopy through the visceral pleura.1,18,20 Such images will visualize alveoli that may not be representative of the whole lung. Reasons for this observation are not clear, but it seems likely that the structural limit imposed by the pleura boundary must constrain the alveoli and alveolar ducts to be oriented perpendicular to the pleura. Although the mouse may be unique in this regard, since there are a greater fraction of alveoli close to the pleura than in larger lungs with smaller surface to volume ratios, it is possible that in larger mammals this effect of pleural proximity extends proportionally deeper into the lung parenchyma. Unfortunately, the ability to reconstruct a complete slice for a similar analysis would be much more difficult in a larger species, and has not yet been reported.
(2) It was quite surprising to find that there was a consistent effect of grid orientation on the Lm (Figs. 4 and 5). Since there has been no mention of this in the literature, and since we could think of no simple explanation, we looked for possible processing artifacts that might cause this. None of these, however, could be substantiated. One possibility might have been the orientation of the fixed lung from which the thick sections were cut. That is, if the section is lying flat, and the lung does not fully recoil after the cut, there may be some residual compression. However, in three additional experiments we rotated the fixed tissue 90° (essentially standing the lung on edge), and cut the thick sections in this manner. We found the same effect of grid orientation regardless of how the fixed tissue was cut. In further experiments, we also rotated by 90° the methacrylate embedded tissues to cut the sections. Slicing orientation could similarly lead to residual compression in one direction. However, the same effect of grid orientation was still observed regardless of the cutting direction. In addition, in several additional lungs we examined whether the initial agarose instillation might have somehow been responsible, by using the more conventional fixation with formalin instillation. However, even with this more conventional fixation we still found similar differences both between the orthogonal grid orientations and in the effect of distance from the pleura (data not shown). In these lungs we also did not do the degassing and pressure–volume curves, so this preliminary mechanical procedure is not responsible for the observed anisotropy. All of these fixation procedures involve instillation with liquid, which essentially eliminates surface forces in the alveoli. This is known to lead to distortions at adjacent alveolar walls.16 While this uniform loss of surface tension can lead to anisotropy, it is not obvious why or how it would result in the kind of anisotropies we have observed in this study. One possibility to explain our findings, however, is that there is nonuniform distortion during the shrinkage that occurs with all histologic processing, even with the methacrylate embedding, known to cause much smaller shrinkage than with paraffin.4 Shrinkage of biological tissues frequently results in such nonuniform behavior, for example as evidenced by the well known substantial difference between the shrinkage in directions radial and tangential to the growth rings that occurs in a board of wood as it dries, a process that commonly leads to significant warping. Given the tree structures in the lung and the fact that they likely behave quite differently from parenchyma during the dehydration, it is possible that an analogous nonuniform distortion occurs internally in the lung with processing. At the present time, we do not know if this is true, and the only way to evaluate this would be to look for similar anisotropy with micro CT slices of intact lungs. However, regardless of whether the observation reflects an intrinsic anisotropy or a result of nonuniform shrinkage, the fact that there is an increased dimension in the ventral–dorsal axis of the lung slice may have some impact on measurements of the smaller sections normally used. We note that this observation is not limited to the C57BL/6J strain, since in several mice from other strains (C3H/HeJ and Black Swiss Webster), the same effect with similar magnitude was also found (data not shown).
(3) Another somewhat surprising finding was the variability associated with the cranial, middle, and caudal regions of the left lung (Fig. 8). Within each regional slice bounded by the pleura there were from 18,000 chords measured with the grid spacing of 17 μm. The Lm among these 3 complete sections varied by up to 5 μm, but among animals there was no systematic variation with position of the slice. That is, the Lm in the top slice was not always larger or smaller than the bottom. The reason for this variation between slices from the same lung is not known. It may reflect the normal variation in peripheral lung structure that depends on the arrangement of alveoli between the larger branches of the airway and two vascular trees. Whatever the reason, it also supports the concept that there is considerable heterogeneity in the peripheral airspaces of the mouse lung. The fact that there was no trend among the regions among different lungs suggests that it may be very difficult to obtain a truly accurate and unbiased measurement of Lm or MLI. For more detailed stereologic measurements that rely on measurements of individual alveoli, this anisotropy may similarly require that increased numbers be sampled beyond what is normally recommended.6 The dependency of Lm on location also imposes a limit on what differences can be detected during interventions. If there is a potential variation of 5 μm among different regions within a lung, then any difference during some intervention or challenge would likely be undetectable if it is less than this. As already noted, we did not systematically examine the right lung, so we do not know whether there would be differences within or among the different lobes on the right side. However, given that simply sampling different sections cut with the same orientation from the left lung showed such variability, we suspect that this would likely be at least as great among the right lobes.
Finally, we do not know if the mouse lung is unique among mammals. In larger animals, many higher power fields are commonly taken from different regions, but given the larger size of the lungs, it is not feasible to obtain the systematic localization done here. Of course there is always considerable variability among the many high power sections, but only the mean from all sections, and not this variability, is ever presented. Recently, it was shown in an elegant imaging study that alveolar expansion near the pleural surface in rats was quite nonuniform.18 If this phenomenon also exists deeper into the lung, then the anisotropy seen here in mice may exist in rats as well. In rabbits, however, laser light scattering was used to suggest that the lung parenchyma behaved in an isotropic manner.14 This may suggest that rabbits are indeed different, or that the light scattering approach was not sensitive enough to detect the small changes we have found histologically. In this regard, we should also note that the differences we have found in this study may be considered acceptable noise by some. That is, if one is studying emphysema caused by elastase instillation in the trachea and finds that Lm increases by 50 μm, then whether one uses the cranial, middle, caudal slices, or any line orientation, or even only 200 alveolar chord measurements, may have little consequence. It is only for more subtle physiologic or pathologic changes that this lack of isotropy may be of practical importance. In this regard, when dealing with heterogeneous emphysematous changes in lung parenchyma, there are clear limitations of using a simple measure of Lm. This was highlighted in a study by Parmeswaran et al.,17 who provided a more sensitive way to detect and quantify changes in sections from such heterogeneous pathologic lungs. Lastly, it should also be noted that for some morphometric measurements, such as alveolar number, the intrinsic anisotropy will have little impact. As was recently demonstrated in the rhesus monkey,9 with random stereologic sampling, alveolar number can be accurately tracked even as the lung grows during postnatal development.
In summary, we have investigated the isotropy and heterogeneity of airspaces in the mouse lung. Our results show that the implicit assumptions of parenchymal isotropy in lungs from larger animals do not hold in the mouse lung. There are significant effects of both the orientation of the section with regard to the sampling grid, and the distance from the visceral pleura. These need to be considered when sampling tissue and interpreting quantitative morphometric measurements in the mouse lung.
APPENDIX: MEASUREMENT OF LM WITH IMAGEJ
This is the plugin macro for ImageJ that will logically combine an image called “Section 2U.tif” on the desktop, with an image called “Lm analysis grid.tif” consisting of a grid of parallel lines located in the Documents folder. The data window will list the length of all the chords that run through open space. Chords that hit the edge of the camera rectangle are not counted.
saveAs(“Tiff”, “/Users/physiologydivision/Desktop/
Section 2u.tif “);
run(“Set Scale...”, “distance=0.680 known=1 pixel=
1 unit=lm global”);
open(“/Documents/Lm analysis grid.tif “);
run(“Threshold”);
run(“Invert”);
imageCalculator(“AND create”, “Section 2u.tif”,”
Lm analysis grid.tif “);
//run(“Image Calculator...”, “image1= Section 2U.tif
operation=AND image2=[ Lm analysis grid.tif.tif]
create”);
run(“Threshold”, “stack”);
run(“Set Measurements...”, “area standard perimeter
feret’s redirect=None decimal=2”);
run(“Analyze Particles...”, “minimum=1 maximum=
999 bins=20 show=Outlines display exclude size clear
record stack”);
References
- 1.Allen GB, Pavone LA, DiRocco JD, Bates JH, Nieman GF. Pulmonary impedance and alveolar instability during injurious ventilation in rats. J Appl Physiol. 2005;99:723–730. doi: 10.1152/japplphysiol.01339.2004. [DOI] [PubMed] [Google Scholar]
- 2.Campbell H, Tomkeieff SI. Calculation of the internal surface of a lung. Nature. 1952;170:117. doi: 10.1038/170117a0. [DOI] [PubMed] [Google Scholar]
- 3.Cruz-Orive LM, Weibel ER. Sampling designs for stereology. J Microsc. 1981;122:235–257. doi: 10.1111/j.1365-2818.1981.tb01265.x. [DOI] [PubMed] [Google Scholar]
- 4.Dobrin PB. Effect of histologic preparation on the cross-sectional area of arterial rings. J Surg Res. 1996;61:413–415. doi: 10.1006/jsre.1996.0138. [DOI] [PubMed] [Google Scholar]
- 5.Gundersen HJ. The smooth fractionator. J Microsc. 2002;207:191–210. doi: 10.1046/j.1365-2818.2002.01054.x. [DOI] [PubMed] [Google Scholar]
- 6.Gundersen HJ, Jensen EB, Kieu K, Nielsen J. The efficiency of systematic sampling in stereology-reconsidered. J Microsc. 1999;193:199–211. doi: 10.1046/j.1365-2818.1999.00457.x. [DOI] [PubMed] [Google Scholar]
- 7.Halbower AC, Mason RJ, Abman SH, Tuder RM. Agarose infiltration improves morphology of cryostat sections of lung. Lab Invest. 1994;71:149–153. [PubMed] [Google Scholar]
- 8.Huang YI, Mitzner W. Distribution analysis of alveolar size by digital imaging. J Comput Assist Microsc. 1989;1:397–409. [Google Scholar]
- 9.Hyde DM, Blozis SA, Avdalovic MV, Putney LF, Dettorre R, Quesenberry NJ, Singh P, Tyler NK. Alveoli increase in number but not size from birth to adulthood in rhesus monkeys. Am J Physiol Lung Cell Mol Physiol. 2007;293:L570–L579. doi: 10.1152/ajplung. 00467.2006. [DOI] [PubMed] [Google Scholar]
- 10.Lum H, Huang I, Mitzner W. Morphologic evidence for alveolar recruitment during inflation at high transpulmonary pressure. J Appl Physiol. 1990;68:2280–2286. doi: 10.1152/jappl.1990.68.6.2280. [DOI] [PubMed] [Google Scholar]
- 11.Lum H, Mitzner W. Effects of 10% formalin fixation on fixed lung volume and lung tissue shrinkage. Am Rev Respir Dis. 1985;132:1078–1083. doi: 10.1164/arrd.1985.132.5.1078. [DOI] [PubMed] [Google Scholar]
- 12.Mattfeldt T, Mall G, Gharehbaghi H, Moller P. Estimation of surface area and length with the orientator. J Microsc. 1990;159:301–317. doi: 10.1111/j.1365-2818.1990.tb03036.x. [DOI] [PubMed] [Google Scholar]
- 13.Mead J, Takishima T, Leith D. Stress distribution in lungs: a model of pulmonary elasticity. J Appl Physiol. 1970;28:596–608. doi: 10.1152/jappl.1970.28.5.596. [DOI] [PubMed] [Google Scholar]
- 14.Miki H, Butler JP, Rogers RA, Lehr JL. Geometric hysteresis in pulmonary surface-to-volume ratio during tidal breathing. J Appl Physiol. 1993;75:1630–1636. doi: 10.1152/jappl.1993.75.4.1630. [DOI] [PubMed] [Google Scholar]
- 15.Nyengaard JR, Gundersen HJ. The isector: a simple and direct method for generating isotropic, uniform random sections from small specimens. J Microsc. 1992;165:427–431. [Google Scholar]
- 16.Oldmixon EH, Butler JP, Hoppin FG., Jr Dihedral angles between alveolar septa. J Appl Physiol. 1988;64:299–307. doi: 10.1152/jappl.1988.64.1.299. [DOI] [PubMed] [Google Scholar]
- 17.Parameswaran H, Majumdar A, Ito S, Alencar AM, Suki B. Quantitative characterization of airspace enlargement in emphysema. J Appl Physiol. 2006;100:186–193. doi: 10.1152/japplphysiol.00424.2005. [DOI] [PubMed] [Google Scholar]
- 18.Perlman CE, Bhattacharya J. Alveolar expansion imaged by optical sectioning microscopy. J Appl Physiol. 2007;103:1037–1044. doi: 10.1152/japplphysiol.00160.2007. [DOI] [PubMed] [Google Scholar]
- 19.Scherle W. A simple method for volumetry of organs in quantitative stereology. Mikroskopie. 1970;26:57–60. [PubMed] [Google Scholar]
- 20.Schiller HJ, McCann UG, 2nd, Carney DE, Gatto LA, Steinberg JM, Nieman GF. Altered alveolar mechanics in the acutely injured lung. Crit Care Med. 2001;29:1049–1055. doi: 10.1097/00003246-200105000-00036. [DOI] [PubMed] [Google Scholar]
- 21.Shannon CE. Communication in the presence of noise. Vol. 37. Institute of Radio Engineers; 1949. pp. 10–21. Reprinted in Proceedings of the IEEE 86, 447–4571998) [Google Scholar]
- 22.Soutiere SE, Tankersley CG, Mitzner W. Differences in alveolar size in inbred mouse strains. Respir Physiol Neurobiol. 2004;140:283–291. doi: 10.1016/j.resp.2004.02.003. [DOI] [PubMed] [Google Scholar]
- 23.Weibel ER. Morphometry of the Human Lung. New York: Academic Press; 1963. [Google Scholar]
- 24.Weibel ER, Hsia CC, Ochs M. How much is there really? Why stereology is essential in lung morphometry. J Appl Physiol. 2007;102:459–467. doi: 10.1152/japplphysiol.00808.2006. [DOI] [PubMed] [Google Scholar]