

Abstract
Purpose
To present a method for identifying intrinsic imaging phenotypes in breast cancer tumors and to investigate their association with prognostic gene expression profiles.
Materials and Methods
The authors retrospectively analyzed dynamic contrast material–enhanced (DCE) magnetic resonance (MR) images of the breast in 56 women (mean age, 55.6 years; age range, 37–74 years) diagnosed with estrogen receptor–positive breast cancer between 2005 and 2010. The study was approved by the institutional review board and compliant with HIPAA. The requirement to obtain informed consent was waived. Primary tumors were assayed with a validated gene expression assay that provides a score for the likelihood of recurrence. A multiparametric imaging phenotype vector was extracted for each tumor by using quantitative morphologic, kinetic, and spatial heterogeneity features. Multivariate linear regression was performed to test associations between DCE MR imaging features and recurrence likelihood. To identify intrinsic imaging phenotypes, hierarchical clustering was performed on the extracted feature vectors. Multivariate logistic regression was used to classify tumors at high versus low or medium risk of recurrence. To determine the additional value of intrinsic phenotypes, the phenotype category was tested as an additional variable. Receiver operating characteristic analysis and the area under the receiver operating characteristic curve (Az) were used to assess classification performance.
Results
There was a moderate correlation (r = 0.71, R2 = 0.50, P < .001) between DCE MR imaging features and the recurrence score. DCE MR imaging features were predictive of recurrence risk as determined by the surrogate assay, with an Az of 0.77 (P < .01). Four dominant imaging phenotypes were detected, with two including only low- and medium-risk tumors. When the phenotype category was used as an additional variable, the Az increased to 0.82 (P < .01).
Conclusion
Intrinsic imaging phenotypes exist for breast cancer tumors and correlate with recurrence likelihood as determined with gene expression profiling. These imaging biomarkers could ultimately help guide treatment decisions.
Breast cancer subtypes have been identified on the basis of histopathologic and molecular characteristics that have prognostic and predictive value (1–4). Despite the improvements in early detection and diagnosis, breast cancer recurrence and failure of current therapies continue to result in high mortality (4). In particular, tumor heterogeneity is emerging as one of the major challenges in prognostication and successful treatment (5). Breast cancer heterogeneity manifests in almost all aspects of the disease, including histopathologic, molecular, and functional characteristics (6). The histopathologic characteristics of a tumor have been traditionally analyzed on the basis of selective biopsy tissue samples, which typically represent only a portion of a generally heterogeneous tumor (2–4). Although useful for diagnosis, such limited tumor sampling is inadequate at capturing the entire range of the intratumor heterogeneity, which can influence the course of tumor progression and treatment (7).
Dynamic contrast material–enhanced (DCE) magnetic resonance (MR) imaging, computed tomography, and positron emission tomography (PET) offer the ability to capture anatomic and functional properties of tumors (8–12). For breast cancer, morphologic and kinetic features derived from DCE MR imaging, such as tumor shape, size, spiculation, and contrast material enhancement, have been shown to be associated with different histologic type, tumor grade, and microvessel distribution (13–18). Mammographic and ultrasonographic features, such as mass lobulation, echo attenuation, vascularity, and elasticity, have been shown to be characteristic of triple-negative breast cancer (19). Metabolism and perfusion measures at PET have also been shown to be indicative of breast cancer receptor subtype (20). More recently, studies have also shown correlations between imaging features and specific patterns of gene expression for liver (21,22), brain (23), and lung cancer (24) tumors, which has resulted in the emergence of “radiogenomics” as a field. Although a sizeable amount of the information captured with imaging remains unaccounted for, this emerging evidence suggests that certain patterns of the imaging phenotype can provide insight into the underlying tumor biology, including its molecular characteristics. This potential, coupled with capabilities for three-dimensional visualization, offers a unique opportunity to extract such biologic imaging surrogates, including the ability to better characterize heterogeneity for the entire tumor (7). Ultimately, decoding the information captured by imaging phenotypes and understanding their association with patient outcomes could complement current histopathologic and molecular markers in prognostication and prediction (7).
The purpose of this study was to present a method for identifying intrinsic imaging phenotypes in breast cancer tumors and to investigate their association with prognostic gene expression profiles. Our approach is similar in principle to hierarchical gene expression clustering, which led to the discovery of intrinsic molecular subtypes for breast cancer (25). We show that by using our proposed method, imaging phenotypes derived from breast DCE MR imaging tumor features have distinct inherent patterns and can be used to predict the likelihood of breast cancer recurrence, as determined with a validated gene expression assay (26–28).
Materials and Methods
Study Population
Breast DCE MR imaging data were retrospectively analyzed with use of a Health Insurance Portability and Accountability Act–compliant, institutional review board–approved protocol. The requirement to obtain informed consent was waived. We identified 284 women with estrogen receptor–positive invasive breast cancer who underwent assay with a validated gene expression assay (Oncotype DX; Genomic Health, Redwood City, Calif) as part of standard care at our institution from 2005 to 2010. Oncotype DX is a validated reverse-transcriptase-polymerase-chain-reaction assay that measures the RNA expression of 21 genes from formalin-fixed paraffin-embedded tissue of the primary breast cancer (26). The output of Oncotype DX is a continuous score that predicts the likelihood of recurrence 10 years after treatment (low risk, <18; medium risk, 18–31; high risk, >31). Of these 284 women, 140 had presurgical DCE MR images with confirmed histopathologic findings. Eighty-five of the 140 women were at low risk for recurrence, 45 were at medium risk, and 10 were at high risk. To demonstrate proof of concept for our method, a convenience sample was selected for the purpose of manual tumor delineation. All 10 high-risk cases were included, whereas 19 medium- and 27 low-risk cases were randomly selected to create a relatively balanced data set of low- and medium- or high-risk tumors, resulting in a total of 56 cases for our analysis (Table 1). All DCE MR imaging data, which were obtained with T1-weighted sequences before and after contrast material administration, were analyzed. Women were imaged prone with a 1.5-T unit (LX Echo, GE Healthcare, Little Chalfont, England; or Sonata, Siemens, Berlin, Germany) by using a 512 × 512 matrix, 2.4–4.4-mm-thick sections, and a 25° or 30° flip angle. Dynamic sequences were performed after the administration of gadodiamide (Omniscan; GE Healthcare) or gadobenate dimeglumine (MultiHance; Bracco Diagnostics, Monroe Township, NJ) at intervals of 5, 8, and 11 minutes for three postcontrast time points. The primary tumor location was confirmed on each image by a fellowship-trained breast imaging radiologist (S.G., with 4 years of experience), and each tumor boundary was manually delineated on a central-most representative section for feature extraction.
Table 1.
| Characteristic | Low Risk (Recurrence Score <18) | Medium Risk (Recurrence Score 18-31) | High Risk (Recurrence Score >31) |
|---|---|---|---|
| No. of patients (n = 56) | 27 (48) | 19 (34) | 10 (18) |
| Tumor type | |||
| Ductal | 25 (93) | 17 (89) | 10 (100) |
| Lobular | 2 (7.4) | 2 (10) | 0 (0) |
| Tumor grade | |||
| T1a | 4 (15) | 3 (16) | 0 (0) |
| T1b | 8 (30) | 9 (47) | 2 (20) |
| T1c | 12 (44) | 7 (37) | 5 (50) |
| T2 | 3 (11) | 0 (0) | 2 (20) |
| Tx | 0 (0) | 0 (0) | 1 (10) |
| PR status | |||
| Positive | 27 (100) | 16 (84) | 7 (70) |
| Negative | 0 (0) | 3 (16) | 3 (30) |
| Nodal status | |||
| N0 | 26 (96) | 19 (100) | 8 (80) |
| N1 | 1 (3.7) | 0 (0) | 2 (20) |
| Patient ethnicity | |||
| White | 13 (48) | 10 (53) | 5 (50) |
| African American | 4 (15) | 2 (10) | 1 (10) |
| Asian | 0 (0) | 1 (5.2) | 0 (0) |
| Other | 2 (7.4) | 1 (5.2) | 1 (10) |
| Unknown | 8 (30) | 5 (26) | 3 (30) |
| Patient age (y) | |||
| Mean | 55 | 56.68 | 56.4 |
| Range | 41-76 | 39-72 | 43-67 |
| Tumor size (cm) | |||
| Mean ± standard deviation | 1.32 ± 0.15 | 1.56 ± 0.53 | 1.56 ± 0.26 |
| Range | 0.5-1.9 | 0.4-2.0 | 0.5-3.3 |
Note.—Numbers in parentheses are percentages.
Image Feature Extraction
We constructed a multiparametric imaging phenotype vector for each tumor by extracting features of tumor structure, function, and heterogeneity by means of computerized methods (Table 2).
Table 2.
List of Features Extracted from Breast Tumors with DCE MR Imaging
| Feature No. | Feature | Description |
|---|---|---|
| Morphologic/geometric features | ||
| 1 | Convexity | A measure of tumor regularity. This can be computed as the ratio of the perimeter of the tumor convex hull to the actual tumor perimeter (1) |
| 2 | Ellipticity | Also a measure of tumor regularity. This can be computed by first fitting an ellipse to the tumor shape and then assessing the quality of the fit (2) |
| 3 | Area | Tumor area |
| 4 | Perimeter | Tumor perimeter |
| Aggregate kinetic features | ||
| 5 | MPE | Maximum peak enhancement (3) |
| 6 | CKC-PE | Peak enhancement for the characteristic kinetic curve (4,5) |
| 7 | CKC-TTP | TTP for the characteristic kinetic curve (4,5) |
| 8 | CKC-WIS | Wash-in slope for the characteristic kinetic curve (4,5) |
| 9 | CKC-WOS | Washout slope for the characteristic kinetic curve (4,5) |
| 10 | SER | Hot spot signal enhancement ratio. Highest eight-connected pixel average signal enhancement ratio over the tumor area (6) |
| Heterogeneity kinetic features | ||
| 11-13 | P (Set = i|M) | Proportion of pixels in set i. This gives rise to three features when the tumor is partitioned in three TTP sets |
| 14-16 | μ(PE, i) | Mean peak enhancement for set i pixels |
| 17-19 | σ2(PE, i) | Variance of peak enhancement for set i pixels |
| 20-22 | μ(WIS, i) | Mean wash-in slope for set i pixels |
| 23-25 | σ2(WIS, i) | Variance of wash-in slope for set i pixels |
| 26-28 | μ(WOS, i) | Mean washout slope for set i pixels |
| 29-31 | σ2(WOS, i) | Variance of washout slope for set i pixels |
Note.—CKC = characteristic kinetic curve, MPE = maximum peak enhancement, PE = peak enhancement, SER = signal enhancement ratio, WIS = wash-in slope, WOS = washout slope.
Morphologic features.—We extracted previously validated morphologic features shown to be associated with disease prognosis (13,14). Tumor area and perimeter were extracted to measure tumor size, and ellipticity and convexity were computed to capture the shape of the tumor (29,30).
Aggregate kinetic features.—We computed standard kinetic features from representative regions of the tumor, such as the most enhancing region (ie, hot spot) (31,32). The following kinetic features were extracted: maximum peak enhancement (33), peak enhancement, wash-in slope, washout slope, and time to peak (TTP) of the characteristic kinetic curve (31,32) and the hot spot signal enhancement ratio (34).
Heterogeneity kinetic features.— The pixels within the segmented tumor were first grouped on the basis of their TTP values, therefore partitioning the pixels into three sets (ie, our number of postcontrast time points). Pixel-wise maps were then computed for peak enhancement, wash-in slope, and washout slope (Fig E1 [online]). On the basis of the pixel groupings above, partition-wise kinetic statistics were then computed as follows: Let Mk represent the membership of pixel k to its respective TTP group M, where M ∈ i = {1,2,3}.
The proportion (P) of pixels belonging to TTP set i given the specific tumor partition is as follows:
where δ(Mk = i) equals 1 when Mk = i, and zero otherwise, and N is the total number of pixels. These features represent the corresponding proportion of pixels achieving TTP at time point i.
The mean (μ) and variance (σ2) of feature j for TTP set i, where j ∈ {peak enhancement, wash-in slope, washout slope} is as follows:
and
respectively, where fj(k) is the value of the jth feature for the kth voxel, where the feature can be peak enhancement, wash-in slope, or washout slope. These features capture the mean and variance of the peak enhancement, wash-in slope, and washout slope within each set of pixels achieving TTP at each corresponding postcontrast time point i.
With m = 3 pixel partitions (ie, postcontrast time points) and n = 3 pixel-wise features (ie, peak enhancement, wash-in slope, and washout slope), we compute a total of m(2n + 1) = 21 kinetic statistic features.
Identification of Intrinsic Imaging Phenotypes
To identify intrinsic imaging phenotypes within our study population, we performed unsupervised hierarchical clustering on the extracted feature vectors. In unsupervised clustering, the algorithm is not provided with the output variable (ie, here the “group” label) but relies only on the feature vectors to identify intrinsic groupings within the population. Hierarchical clusters are represented by a dendrogram (35–37), which was generated as follows: Given a set of breast tumors, each represented by a standardized image feature vector (ie, z-score normalized features [38]), a tree node was defined for every tumor and the Pearson correlation was computed between each pair of tumor feature vectors. The pair with the highest correlation was merged and a new parent node created, for which a new phenotype vector was computed by averaging the feature values of the joined vectors. The correlations among the feature vectors were then updated, and the process was repeated until a single node remained (Fig E2a [online]). In the dendrogram, each leaf of the hierarchical tree represents an individual tumor. We used the result of the hierarchical clustering to produce a heat map matrix (35) to visualize the properties of the detected imaging phenotypes. In a heat map matrix, each column represents the extracted feature vector for each tumor (eg, size, shape, kinetics, and heterogeneity statistic features), and each row represents each imaging feature across the entire population. After generating the dendrogram, we determined the number of distinct imaging phenotypes (ie, clusters) in the dendrogram by using the average pairwise distance within the clusters Davg (39) as follows:
where c is the number of clusters, Nl is the number of data points (ie, tumors) in the lth cluster, and xul and xvl are the uth and vth feature vectors. A small Davg is indicative of compact clustering. We computed Davg as a function of number of clusters, from 1 up to the total number of data points, Kmax. The optimal number of distinct clusters was selected by computing the point that gives the maximal percentage decrease in Davg (39,40) (Fig E2b [online]), as follows:
Statistical Analysis
Multivariate linear regression with sequential forward feature selection was used to test the association between the extracted DCE MR imaging features and the recurrence score. Multivariate logistic regression with leave-one-out cross validation and forward feature selection (38) was performed to classify tumors with high versus low or medium risk of recurrence. To determine the additional value of detecting intrinsic imaging phenotypes, our classifier was tested both with and without the inclusion of the phenotype category as a distinct predictor, coded as a categoric variable. Receiver operating characteristic analysis was performed, and the area under the receiver operating characteristic curve (Az) was estimated to assess classification performance.
Results
We found a moderate correlation (r = 0.71, R2 = 0.50, P < .001) among the four DCE MR imaging features selected by the multivariate regression model with use of forward feature selection and the recurrence score (Fig 1). The selected features included the proportion of tumor pixels with a TTP of 1, the mean peak enhancement for pixels with a TTP of 1, and the area and ellipticity of the tumor (Table 3).
Figure 1.
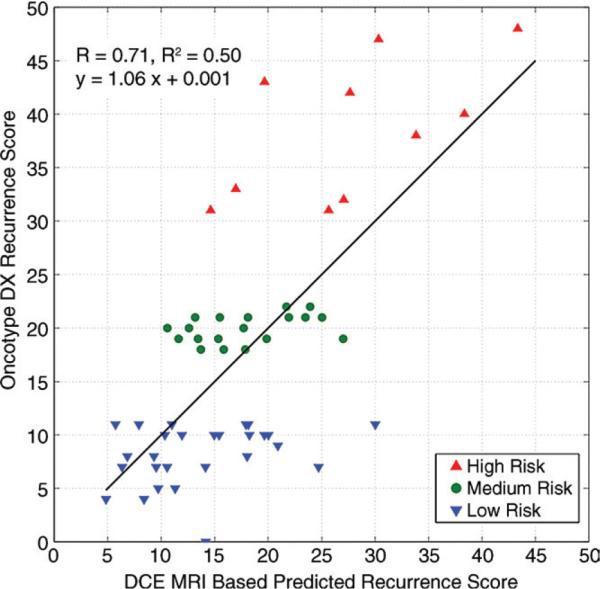
Graph shows correlation between probability of recurrence as predicted with recurrence score and DCE MR imaging features. Regression model is based on four DCE MR imaging features shown in Table 3.
Table 3.
Association between Extracted DCE MR Imaging Features and Recurrence Score
| Feature | Unstandardized Coefficients (B) | Standardized Coefficients (β) | t Statistic | P Value |
|---|---|---|---|---|
| Constant of the linear regression model | 6.498 (3.489) | ... | 1.863 | .068 |
| Proportion of pixels with TTP of 1 | 23.053 (5.770) | 0.412 | 3.995 | <.0001 |
| Mean peak enhancement for pixels with TTP of 1 | –56.045 (13.219) | –0.548 | –4.240 | <.0001 |
| Tumor area | 0.007 (0.002) | 0.433 | 4.118 | <.0001 |
| Tumor ellipticity | –32.410 (12.395) | –0.344 | –2.615 | .012 |
Note.—Numbers in parentheses are standard errors. Data were obtained with the multivariate linear regression model.
Hierarchical clustering indicates that distinct intrinsic imaging phenotypes are present in our population (Fig 2). By computing Davg as a function of the number of clusters, the optimal number of distinct phenotypes in our population was determined to be four, for a 45% decrease in Davg (Fig 2b). When looking at the detected imaging phenotype groupings versus the corresponding Oncotype DX classifications, phenotypes 1 and 2 consist only of tumors at low and medium risk of recurrence, whereas phenotypes 3 and 4 consist of a mix of all the recurrence risk categories (Fig 2c). Box plots of the variation of the recurrence score and the four DCE MR imaging features selected with the regression model are shown in Figures 3 and E3 (online) for each phenotype. The corresponding histopathologic characteristics of the tumors in each phenotype category are shown in Table E1 (online).
Figure 2.

Identification of intrinsic imaging phenotypes for breast cancer with unsupervised hierarchical clustering based on DCE MR imaging features. (a) Heat map with columns representing tumors and rows representing features. CKC = characteristic kinetic curve, MPE = maximum peak enhancement, PE = peak enhancement, SER = hot spot signal enhancement ratio, WIS = wash-in slope, WOS = washout slope. (b) Graph shows within-cluster distance (Davg) as a function of number of phenotype clusters. (c) Dendrogram shows four distinct phenotypes.
Figure 3.
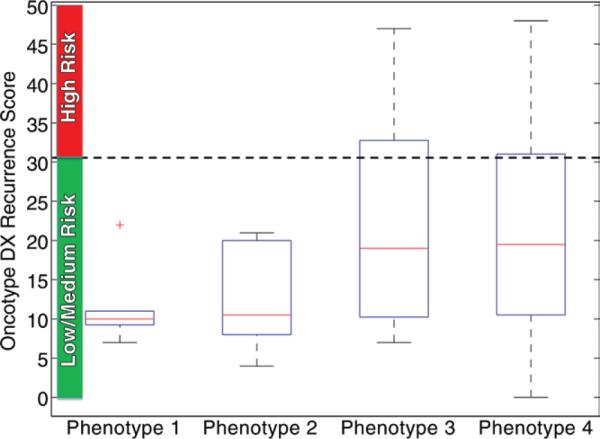
Box plot shows recurrence score within each MR imaging phenotype category. Phenotypes 1 and 2 consist of only low- and medium-risk scores, whereas phenotypes 3 and 4 consist of a mix of recurrence risk scores. Red lines are medians, edges of boxes are 25th and 75th percentiles, whiskers extend to the most extreme data points not considered as outliers (+), horizontal dotted line represents cutoff level in recurrence score that separates high-risk tumors from low- or medium-risk tumors per validated gene expression assay.
Overall, our results indicate that tumors with a gene expression profile that shows a high risk of recurrence tend to show predominantly rapid contrast material uptake. For example, high-risk tumors show more rapid enhancement by having a larger proportion of pixels for which peak enhancement occurs at the first postcontrast time point while having a lower proportion of pixels with late enhancement at the third postcontrast time point (Fig 2a). Representative tumor patterns are shown in Figure 4, where a tumor at high risk for recurrence shows a larger proportion of pixels with more rapid uptake while a low-risk tumor shows slower uptake. These findings are in line with those from previous studies about the prediction of disease-free survival (41,42), where it was shown that high levels of perfusion and vessel permeability, as measured with DCE MR imaging, are associated with low disease-free survival.
Figure 4.

Distinct patterns of DCE MR imaging features in tumors (arrow) with low or medium versus high risk for recurrence. (a) Image in 42-year-old woman with recurrence score of 21 (medium risk) shows that tumor pixels have predominantly a slower contrast material uptake pattern (more TTP = 2 pixels, shown in green). (b) Image in 50-year-old woman with recurrence score of 40 (high risk) shows that major part of tumor has a rapid contrast material uptake pattern (more TTP = 1 pixel, shown in red). (c) Image in 60-year-old woman with recurrence score of 7 (low risk) shows a smaller lesion (153 mm2) with a smoother margin. (d) Image in 43-year-old woman with recurrence score of 48 (high risk) shows a larger lesion (631 mm2) with an irregular margin.
When classifying tumors with high- versus low- or medium-risk gene expression profiles (ie, where the two latter groups are combined to form one category), the logistic regression model with the extracted DCE MR imaging features as inputs has an Az of 0.77 (standard error = 0.079, Fig 5). When the detected phenotypes are included as additional predictors and coded as a categoric variable (ie, the four phenotypes detected with the dendrogram; Fig 2c), the Az increases to 0.82 (standard error = 0.060, P < .01). When the imaging phenotype is not used as a distinct coded variable, the most frequently selected features include the proportion of pixels with a TTP of 1, the proportion of pixels with a TTP of 3, the mean peak enhancement for pixels with a TTP of 1, the variance in peak enhancement for pixels with a TTP of 2, and tumor convexity, area, and perimeter. When the imaging phenotype is used as an additional distinct variable, it is always selected as a predictor by the model, whereas some of the previously selected features tend to be dropped by the model (Table 4).
Figure 5.
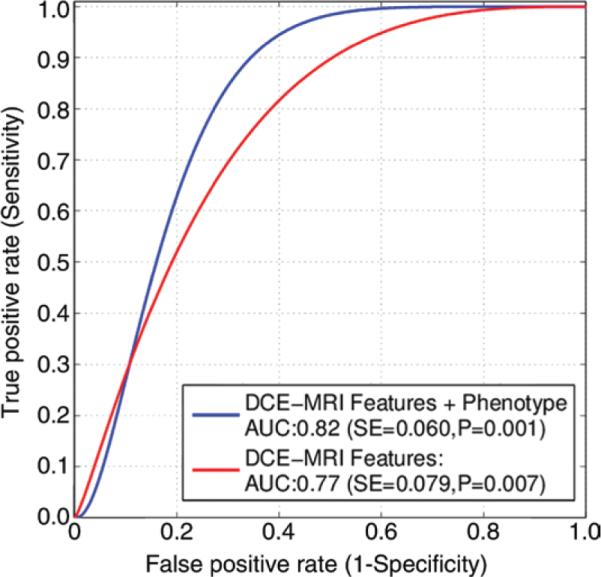
Receiver operating characteristic curves for leave-one-out logistic regression classifier to differentiate tumors at high risk versus low and medium risk of recurrence with use of DCE MR imaging features.
Table 4.
Selection Frequencies of DCE MR Imaging Features with Leave-One-Out Cross Validation
| Feature | No Phenotype | With Phenotype |
|---|---|---|
| Imaging phenotype category | NA | 56 (100)* |
| Morphologic/geometric features | ||
| Convexity | 39 (70)* | 32 (57)* |
| Ellipticity | 19 (34) | 15 (27) |
| Area | 50 (89)* | 18 (32) |
| Perimeter | 52 (93)* | 49 (88)* |
| Aggregate kinetic features | ||
| Maximum peak enhancement | 0 (0) | 0 (0) |
| Peak enhancement for the characteristic kinetic curve | 3 (5) | 2 (4) |
| TTP for the characteristic kinetic curve | 9 (16) | 7 (13) |
| Wash-in slope for the characteristic kinetic curve | 0 (0) | 0 (0) |
| Washout slope for the characteristic kinetic curve | 4 (7) | 3 (5) |
| Hot spot signal enhancement ratio | 4 (7) | 2 (4) |
| Heterogeneity kinetic features | ||
| Proportion of pixels in set 1 | 48 (86)* | 22 (39) |
| Proportion of pixels in set 2 | 20 (36) | 17 (30) |
| Proportion of pixels in set 3 | 50 (89)* | 52 (93)* |
| Mean peak enhancement for set 1 pixels | 35 (63)* | 11 (20) |
| Mean peak enhancement for set 2 pixels | 2 (4) | 6 (11) |
| Mean peak enhancement for set 3 pixels | 0 (0) | 3 (5) |
| Variance in peak enhancement for set 1 pixels | 4 (7) | 6 (11) |
| Variance in peak enhancement for set 2 pixels | 44 (79)* | 42 (75)* |
| Variance in peak enhancement for set 3 pixels | 18 (32) | 15 (27) |
| Mean wash-in slope for set 1 pixels | 13 (23) | 10 (18) |
| Mean wash-in slope for set 2 pixels | 4 (7) | 9 (16) |
| Mean wash-in slope for set 3 pixels | 0 (0) | 2 (4) |
| Variance in wash-in slope for set 1 pixels | 5 (9) | 1 (2) |
| Variance in wash-in slope for set 2 pixels | 1 (2) | 5 (9) |
| Variance in wash-in slope for set 3 pixels | 7 (13) | 10 (18) |
| Mean washout slope for set 1 pixels | 2 (4) | 9 (16) |
| Mean washout slope for set 2 pixels | 0 (0) | 0 (0) |
| Mean washout slope for set 3 pixels | 1 (2) | 7 (13) |
| Variance in washout slope for set 1 pixels | 2 (4) | 10 (18) |
| Variance in washout slope for set 2 pixels | 7 (13) | 12 (21) |
| Variance in washout slope for set 3 pixels | 0 (0) | 0 (0) |
Note.— The reported numbers for each feature indicate the number of cross-validation loops for which the respective feature was selected, where the total cross validation loops = 56. Numbers in parentheses represent the corresponding percentages.
Features were selected in more than 50% of the total of 56 cross-validation loops.
Discussion
Our method of hierarchical clustering offers a principled approach for detecting intrinsic imaging phenotypes. Although previous studies on the identification of distinct imaging patterns for breast tumors associated with different histopathologic correlates are largely based on qualitative interpretation (43,44), we propose a formal methodologic framework that enables quantitative evaluation. The goal of cluster analysis in general is to find groupings of data points within a population so that observations within a cluster are more similar to each other than to observations in different clusters. In this study, we performed unsupervised cluster analysis to identify natural groupings within the extracted imaging features, which gave rise to intrinsic phenotypes with distinct, quantifiable imaging patterns. Our approach is similar in principle to the hierarchical gene expression clustering approaches that led to the discovery of the intrinsic molecular subtypes for breast cancer (25). We used the results of hierarchical clustering to produce heat maps, similar to microarray expression clustering dendrograms (25,45), to visualize and interpret the patterns of the detected imaging phenotypes (eg, tumor shape, size, contrast kinetics) and start gaining a basic understanding of how the imaging presentation of cancer may relate to its underlying molecular profile and, ultimately, the likelihood of recurrence. The patterns of the clustered imaging features in our heat map indicate a more infiltrative phenotype for high-risk tumors, potentially owing to higher vascularity and/or more complex neoangiogenic properties.
Our results suggest that intrinsic imaging phenotypes exist for breast cancer tumors and are associated with prognostic gene expression profiles. Specifically, our findings indicate that there are four dominant phenotypes within our study population. Phenotypes 1 and 2 consist entirely of tumors with a recurrence score of less than 31 (26) and include only low- and medium-risk tumors. This is an important finding because it has been shown that the benefit of adjuvant chemotherapy becomes substantial mainly in women with a recurrence score greater than 31. Therefore, when imaging is already available from standard clinical care (ie, diagnostic or staging DCE MR imaging), information from imaging phenotypes alone could potentially be used to identify women who are at very low risk of recurrence and perhaps obviate the need for, as well as the cost of, the genetic test for this specific subset of women while leaving the remaining subpopulation of women (herein women with phenotypes 3 and 4) to be further tested for tumor gene expression. When including the detected phenotypes as separate predictors in our classifier, the discriminatory capacity of the model improves the differentiation of women at high versus low or medium risk for recurrence. The selection frequency of the features in the leave-one-out cross validation indicates the importance of considering the phenotype categories in the prediction of breast cancer recurrence, as they are consistently selected by our model in all cross-validation loops. In addition, the selection frequency of the heterogeneity kinetic statistic features largely outperforms the standard aggregate kinetic measures (9,31–33), such as maximum peak enhancement, hot spot signal enhancement ratio, and features from the characteristic kinetic curve, which suggests that more comprehensive characterization of spatial tumor heterogeneity from imaging can ultimately result in better prognostic imaging markers.
Limitations of the current study must also be noted. Because our main objective was to present a principled methodologic approach for discovering intrinsic imaging phenotypes, we used a convenience sample of cases with a goal to demonstrate proof of concept. Although we used leave-one-out cross validation to determine generalization, and certain features do seem to represent good prognostic markers by being consistently selected by our model, the validity of our findings, including their applicability for other breast cancer subtypes, requires more extensive validation in larger populations. In addition, we acknowledge that there are additional features that we could potentially include in our phenotype vector. Considering the potential bias of over-fitting and multiple comparison tests, we chose a representative set of morphologic and kinetic features that have been shown to have value in breast lesion characterization and prognostic assessment (9,31–33). Once the most discriminant features are identified, we plan to further explore refinements of the feature set in our future larger studies, including the automation of segmentation for the analysis of the entire tumor volume in larger data sets. We will also seek to analyze DCE MR imaging sequences with larger number of postcontrast time points and multimodality data sets, which would allow us to extract a richer set of kinetic and morphologic descriptors. Moreover, we will also need to investigate the prognostic value of standard clinical variables, in addition to our quantitative measures, such as Breast Imaging Reporting and Data System ratings along with their inter- and intrareader variability, as well as adjust for known clinical and histopathologic prognostic factors (ie, nodal status). Finally, in this proof-of-concept study, we used recurrence score as a validated surrogate of breast cancer recurrence. Although our results suggest that imaging features may have value in prognostic assessment, future studies will also need to validate our findings prospectively in association with true recurrence outcomes based on patient follow-up.
We envision a quantitative breast imaging clinic of the future in which individualized risk assessment and patient education are combined to empower women with knowledge about their personal risk while providing the much-needed fully automated “integrated diagnostics” tools for clinicians. Technologic advances have offered an array of new-generation, highly sensitive breast imaging modalities that allow clinicians to detect and preoperatively characterize the extent of disease (46–48). As part of standard clinical care, several prognostic factors are also assessed on the resected cancer, such as tumor histopathology, immunohistochemistry (49), and gene expression profiling (28,50). These standard markers, merged with multimodality phenotypic imaging biomarkers, which can be automated with computer software, could create an integrated, uniquely tailored, prognostic risk assessment tool. The integration of multiparametric prognostic information (eg, tumor histopathology and predictive marker stains) with emerging genomic signatures and imaging phenotypic biomarkers holds the promise to improve prognostic assessment and clinical decision making for breast cancer treatment. Our proposed method provides a principled approach with general applicability for the identification of imaging phenotypes for cancer that could ultimately help elucidate associations between the imaging presentation of cancer and its structure and function, as associated with patient outcomes.
Supplementary Material
Advances in Knowledge.
■ In Intrinsic imaging phenotypes exist for breast cancer tumors, as derived from multiparametric dynamic contrast material–enhanced (DCE) MR imaging features, which correlate with validated prognostic tumor gene expression profiles.
■ Computer-extracted morphologic, kinetic, and tumor heterogeneity DCE MR imaging features can help predict the likelihood of breast cancer recurrence, as determined with a validated surrogate gene expression assay (r = 0.71, R2 = 0.50, P < .001), and can help differentiate between tumors with high- and low- or medium-risk gene expression profiles, with an area under the receiver operating characteristic curve (Az) of 0.77 (standard error = 0.079, P < .01).
■ When treated as distinct predictors, the detected intrinsic imaging phenotype categories can provide additional prognostic value by improving the prediction of likelihood for recurrence, resulting in an increased Az of 0.82 (standard error = 0.060, P < .01).
Implications for Patient Care.
■ Intrinsic radiologic phenotypes of breast tumors could be used as surrogate markers of prognostic gene expression profiles to noninvasively identify more aggressive breast cancers.
■ The ability to estimate likelihood of recurrence, as determined by means of the underlying molecular profile of the tumor, on the basis of imaging phenotypes could become an important clinical tool for stratifying women according to disease prognosis and making more informed treatment decisions for women with breast cancer.
Acknowledgments
We thank Emily F. Conant, MD, and Mitchell D. Schnall, MD, PhD, for the useful discussions and their suggestions while preparing the manuscript.
Abbreviations
- Az
area under the receiver operating characteristic curve
- DCE
dynamic contrast material enhanced
- TTP
time to peak
Footnotes
Supported by the University of Pennsylvania Institute of Translational Medicine and Therapeutics (ITMAT) Transdisciplinary Program in Translational Medicine and Therapeutics by grant number UL1RR024134 from the National Center for Research Resources, and by the University of Pennsylvania Abramson Cancer Center, 2-PREVENT Translational Center of Excellence Breast Cancer Program.
Author contributions:
Guarantors of integrity of entire study, A.B.A., D.K.; study concepts/study design or data acquisition or data analysis/interpretation, all authors; manuscript drafting or manuscript revision for important intellectual content, all authors; manuscript final version approval, all authors; literature research, A.B.A., D.D., M.F., D.K.; clinical studies, A.B.A., D.D., S.G., C.M.; statistical analysis, A.B.A., D.K.; and manuscript editing, A.B.A., D.D., M.F., M.R., D.K.
Online supplemental material is available for this article.
Conflicts of interest are listed at the end of this article.
Disclosures of Conflicts of Interest: A.B.A. disclosed no relevant relationships. D.D. disclosed no relevant relationships. S.G. disclosed no relevant relationships. C.M. disclosed no relevant relationships. M.F. disclosed no relevant relationships. M.R. disclosed no relevant relationships. D.K. Activities related to the present article: disclosed no relevant relationships. Activities not related to the present article: received travel/accommodations/meeting expensed from Ho-logic. Other relationships: disclosed no relevant relationships.
References
- 1.Reis-Filho JS, Pusztai L. Gene expression profiling in breast cancer: classification, prognostication, and prediction. Lancet. 2011;378(9805):1812–1823. doi: 10.1016/S0140-6736(11)61539-0. [DOI] [PubMed] [Google Scholar]
- 2.Prat A, Parker JS, Karginova O, et al. Phenotypic and molecular characterization of the claudin-low intrinsic subtype of breast cancer. Breast Cancer Res. 2010;12(5):R68. doi: 10.1186/bcr2635. [DOI] [PMC free article] [PubMed] [Google Scholar]
- 3.Mackay A, Weigelt B, Grigoriadis A, et al. Microarray-based class discovery for molecular classification of breast cancer: analysis of interobserver agreement. J Natl Cancer Inst. 2011;103(8):662–673. doi: 10.1093/jnci/djr071. [DOI] [PMC free article] [PubMed] [Google Scholar]
- 4.Kamangar F, Dores GM, Anderson WF. Patterns of cancer incidence, mortality, and prevalence across five continents: defining priorities to reduce cancer disparities in different geographic regions of the world. J Clin Oncol. 2006;24(14):2137–2150. doi: 10.1200/JCO.2005.05.2308. [DOI] [PubMed] [Google Scholar]
- 5.Marusyk A, Polyak K. Tumor heterogeneity: causes and consequences. Biochim Biophys Acta. 2010;1805(1):105–117. doi: 10.1016/j.bbcan.2009.11.002. [DOI] [PMC free article] [PubMed] [Google Scholar]
- 6.Almendro V, Fuster G. Heterogeneity of breast cancer: etiology and clinical relevance. Clin Transl Oncol. 2011;13(11):767–773. doi: 10.1007/s12094-011-0731-9. [DOI] [PubMed] [Google Scholar]
- 7.Benetkiewicz M, Piotrowski A, Díaz De Ståhl T, et al. Chromosome 22 array-CGH profiling of breast cancer delimited minimal common regions of genomic imbalances and revealed frequent intra-tumoral genetic heterogeneity. Int J Oncol. 2006;29(4):935–945. [PubMed] [Google Scholar]
- 8.O'Connor JP, Rose CJ, Jackson A, et al. DCE-MRI biomarkers of tumour heterogeneity predict CRC liver metastasis shrinkage following bevacizumab and FOLFOX-6. Br J Cancer. 2011;105(1):139–145. doi: 10.1038/bjc.2011.191. [DOI] [PMC free article] [PubMed] [Google Scholar]
- 9.Chen WJ, Giger ML, Bick U, Newstead GM. Automatic identification and classification of characteristic kinetic curves of breast lesions on DCE-MRI. Med Phys. 2006;33(8):2878–2887. doi: 10.1118/1.2210568. [DOI] [PubMed] [Google Scholar]
- 10.Chen JH, Bahri S, Mehta RS, et al. Breast cancer: evaluation of response to neoadjuvant chemotherapy with 3.0-T MR imaging. Radiology. 2011;261(3):735–743. doi: 10.1148/radiol.11110814. [DOI] [PMC free article] [PubMed] [Google Scholar]
- 11.McLaughlin R, Hylton N. MRI in breast cancer therapy monitoring. NMR Biomed. 2011;24(6):712–720. doi: 10.1002/nbm.1739. [DOI] [PMC free article] [PubMed] [Google Scholar]
- 12.Arlinghaus LR, Li X, Levy M, et al. Current and future trends in magnetic resonance imaging assessments of the response of breast tumors to neoadjuvant chemotherapy. J Oncol. doi: 10.1155/2010/919620. doi:10.1155/2010/919620. Published online September 29, 2010. [DOI] [PMC free article] [PubMed] [Google Scholar]
- 13.Szabó BK, Aspelin P, Kristoffersen Wiberg M, Tot T, Boné B. Invasive breast cancer: correlation of dynamic MR features with prognostic factors. Eur Radiol. 2003;13(11):2425–2435. doi: 10.1007/s00330-003-2000-y. [DOI] [PubMed] [Google Scholar]
- 14.Tse GM, Chaiwun B, Wong KT, et al. Magnetic resonance imaging of breast lesions—a pathologic correlation. Breast Cancer Res Treat. 2007;103(1):1–10. doi: 10.1007/s10549-006-9352-3. [DOI] [PubMed] [Google Scholar]
- 15.Tozaki M. Interpretation of breast MRI: correlation of kinetic and morphological parameters with pathological findings. Magn Reson Med Sci. 2004;3(4):189–197. doi: 10.2463/mrms.3.189. [DOI] [PubMed] [Google Scholar]
- 16.Teifke A, Behr O, Schmidt M, et al. Dynamic MR imaging of breast lesions: correlation with microvessel distribution pattern and histologic characteristics of prognosis. Radiology. 2006;239(2):351–360. doi: 10.1148/radiol.2392050205. [DOI] [PubMed] [Google Scholar]
- 17.Narisada H, Aoki T, Sasaguri T, et al. Correlation between numeric gadolinium-enhanced dynamic MRI ratios and prognostic factors and histologic type of breast carcinoma. AJR Am J Roentgenol. 2006;187(2):297–306. doi: 10.2214/AJR.05.0696. [DOI] [PubMed] [Google Scholar]
- 18.Matsubayashi R, Matsuo Y, Edakuni G, Satoh T, Tokunaga O, Kudo S. Breast masses with peripheral rim enhancement on dynamic contrast-enhanced MR images: correlation of MR findings with histologic features and expression of growth factors. Radiology. 2000;217(3):841–848. doi: 10.1148/radiology.217.3.r00dc07841. [DOI] [PubMed] [Google Scholar]
- 19.Kojima Y, Tsunoda H. Mammography and ultrasound features of triple-negative breast cancer. Breast Cancer. 2011;18(3):146–151. doi: 10.1007/s12282-010-0223-8. [DOI] [PubMed] [Google Scholar]
- 20.Specht JM, Kurland BF, Montgomery SK, et al. Tumor metabolism and blood flow as assessed by positron emission tomography varies by tumor subtype in locally advanced breast cancer. Clin Cancer Res. 2010;16(10):2803–2810. doi: 10.1158/1078-0432.CCR-10-0026. [DOI] [PMC free article] [PubMed] [Google Scholar]
- 21.Kuo MD, Gollub J, Sirlin CB, Ooi C, Chen X. Radiogenomic analysis to identify imaging phenotypes associated with drug response gene expression programs in hepatocellular carcinoma. J Vasc Interv Radiol. 2007;18(7):821–831. doi: 10.1016/j.jvir.2007.04.031. [DOI] [PubMed] [Google Scholar]
- 22.Segal E, Sirlin CB, Ooi C, et al. Decoding global gene expression programs in liver cancer by noninvasive imaging. Nat Biotechnol. 2007;25(6):675–680. doi: 10.1038/nbt1306. [DOI] [PubMed] [Google Scholar]
- 23.Diehn M, Nardini C, Wang DS, et al. Identification of noninvasive imaging surrogates for brain tumor gene-expression modules. Proc Natl Acad Sci U S A. 2008;105(13):5213–5218. doi: 10.1073/pnas.0801279105. [DOI] [PMC free article] [PubMed] [Google Scholar]
- 24.Gevaert O, Xu J, Hoang CD, et al. Non–small cell lung cancer: identifying prognostic imaging biomarkers by leveraging public gene expression microarray data—methods and preliminary results. Radiology. 2012;264(2):387–396. doi: 10.1148/radiol.12111607. [DOI] [PMC free article] [PubMed] [Google Scholar]
- 25.Parker JS, Mullins M, Cheang MC, et al. Supervised risk predictor of breast cancer based on intrinsic subtypes. J Clin Oncol. 2009;27(8):1160–1167. doi: 10.1200/JCO.2008.18.1370. [DOI] [PMC free article] [PubMed] [Google Scholar]
- 26.Paik S, Tang G, Shak S, et al. Gene expression and benefit of chemotherapy in women with node-negative, estrogen receptor–positive breast cancer. J Clin Oncol. 2006;24(23):3726–3734. doi: 10.1200/JCO.2005.04.7985. [DOI] [PubMed] [Google Scholar]
- 27.Dowsett M, Cuzick J, Wale C, et al. Prediction of risk of distant recurrence using the 21-gene recurrence score in node-negative and node-positive postmenopausal patients with breast cancer treated with anastrozole or tamoxifen: a TransATAC study. J Clin Oncol. 2010;28(11):1829–1834. doi: 10.1200/JCO.2009.24.4798. [DOI] [PubMed] [Google Scholar]
- 28.Albain KS, Barlow WE, Shak S, et al. Prognostic and predictive value of the 21-gene recurrence score assay in postmenopausal women with node-positive, oestrogen-receptor-positive breast cancer on chemotherapy: a retrospective analysis of a randomised trial. Lancet Oncol. 2010;11(1):55–65. doi: 10.1016/S1470-2045(09)70314-6. [DOI] [PMC free article] [PubMed] [Google Scholar]
- 29.Stojmenovic M, Nayak A. Proceedings of the 2nd Pacific Rim conference on advances in image and video technology. Springer-Verlag; Santiago, Chile: 2007. Direct ellipse fitting and measuring based on shape boundaries. pp. 221–235. [Google Scholar]
- 30.Chang RF, Wu WJ, Moon WK, Chen DR. Automatic ultrasound segmentation and morphology based diagnosis of solid breast tumors. Breast Cancer Res Treat. 2005;89(2):179–185. doi: 10.1007/s10549-004-2043-z. [DOI] [PubMed] [Google Scholar]
- 31.Bhooshan N, Giger ML, Jansen SA, Li H, Lan L, Newstead GM. Cancerous breast lesions on dynamic contrast-enhanced MR images: computerized characterization for image-based prognostic markers. Radiology. 2010;254(3):680–690. doi: 10.1148/radiol.09090838. [DOI] [PMC free article] [PubMed] [Google Scholar]
- 32.Chen W, Giger ML, Lan L, Bick U. Computerized interpretation of breast MRI: investigation of enhancement-variance dynamics. Med Phys. 2004;31(5):1076–1082. doi: 10.1118/1.1695652. [DOI] [PubMed] [Google Scholar]
- 33.Loiselle CR, Eby PR, Peacock S, Kim JN, Lehman CD. Dynamic contrast-enhanced magnetic resonance imaging and invasive breast cancer: primary lesion kinetics correlated with axillary lymph node extracapsular extension. J Magn Reson Imaging. 2011;33(1):96–101. doi: 10.1002/jmri.22389. [DOI] [PubMed] [Google Scholar]
- 34.Hylton N. MR imaging for assessment of breast cancer response to neoadjuvant chemotherapy. Magn Reson Imaging Clin N Am. 2006;14(3):383–389. vii. doi: 10.1016/j.mric.2006.09.001. [DOI] [PubMed] [Google Scholar]
- 35.Eisen MB, Spellman PT, Brown PO, Botstein D. Cluster analysis and display of genome-wide expression patterns. Proc Natl Acad Sci U S A. 1998;95(25):14863–14868. doi: 10.1073/pnas.95.25.14863. [DOI] [PMC free article] [PubMed] [Google Scholar]
- 36.Alizadeh AA, Eisen MB, Davis RE, et al. Distinct types of diffuse large B-cell lymphoma identified by gene expression profiling. Nature. 2000;403(6769):503–511. doi: 10.1038/35000501. [DOI] [PubMed] [Google Scholar]
- 37.Guyon I, Weston J, Barnhill S, Vapnik V. Gene selection for cancer classification using support vector machines. Mach Learn. 2002;46(1-3):389–422. [Google Scholar]
- 38.Hastie T, Tibshirani R, Friedman J. The elements of statistical learning: data mining, inference, and prediction. Springer; New York, NY: 2009. [Google Scholar]
- 39.Han J. Data mining: concepts and techniques. Morgan Kaufmann; San Francisco, Calif: 2005. [Google Scholar]
- 40.Sugar CA, James GM. Finding the number of clusters in a dataset: an information-theoretic approach. J Am Stat Assoc. 2003;98(463):750–763. [Google Scholar]
- 41.Pickles MD, Manton DJ, Lowry M, Turnbull LW. Prognostic value of pre-treatment DCE-MRI parameters in predicting disease free and overall survival for breast cancer patients undergoing neoadjuvant chemotherapy. Eur J Radiol. 2009;71(3):498–505. doi: 10.1016/j.ejrad.2008.05.007. [DOI] [PubMed] [Google Scholar]
- 42.Yi A, Cho N, Im SA, et al. Survival outcomes of breast cancer patients who receive neoadjuvant chemotherapy: association with dynamic contrast-enhanced MR imaging with computer-aided evaluation. Radiology. 2013;268(3):662–672. doi: 10.1148/radiol.13121801. [DOI] [PubMed] [Google Scholar]
- 43.Esserman L, Kaplan E, Partridge S, et al. MRI phenotype is associated with response to doxorubicin and cyclophosphamide neoadjuvant chemotherapy in stage III breast cancer. Ann Surg Oncol. 2001;8(6):549–559. doi: 10.1007/s10434-001-0549-8. [DOI] [PubMed] [Google Scholar]
- 44.Schrading S, Kuhl CK. Mammographic, US, and MR imaging phenotypes of familial breast cancer. Radiology. 2008;246(1):58–70. doi: 10.1148/radiol.2461062173. [DOI] [PubMed] [Google Scholar]
- 45.Shannon W, Culverhouse R, Duncan J. Analyzing microarray data using cluster analysis. Pharmacogenomics. 2003;4(1):41–52. doi: 10.1517/phgs.4.1.41.22581. [DOI] [PubMed] [Google Scholar]
- 46.Gavenonis SC, Roth SO. Role of magnetic resonance imaging in evaluating the extent of disease. Magn Reson Imaging Clin N Am. 2010;18(2):199–206. vii–viii. doi: 10.1016/j.mric.2010.02.002. [DOI] [PubMed] [Google Scholar]
- 47.Specht JM, Mankoff DA. Advances in molecular imaging for breast cancer detection and characterization. Breast Cancer Res. 2012;14(2):206. doi: 10.1186/bcr3094. [DOI] [PMC free article] [PubMed] [Google Scholar]
- 48.Zuley ML. The basics and implementation of digital mammography. Radiol Clin North Am. 2010;48(5):893–901. doi: 10.1016/j.rcl.2010.06.003. [DOI] [PubMed] [Google Scholar]
- 49.Hayes DF. Prognostic and predictive factors revisited. Breast. 2005;14(6):493–499. doi: 10.1016/j.breast.2005.08.023. [DOI] [PubMed] [Google Scholar]
- 50.Weigelt B, Baehner FL, Reis-Filho JS. The contribution of gene expression profiling to breast cancer classification, prognostication and prediction: a retrospective of the last decade. J Pathol. 2010;220(2):263–280. doi: 10.1002/path.2648. [DOI] [PubMed] [Google Scholar]
Associated Data
This section collects any data citations, data availability statements, or supplementary materials included in this article.