

Abstract
We assessed the performance of the new Life Technologies Proton sequencer by comparing whole-exome sequence data in a Centre d’Etude du Polymorphisme Humain trio (family 1463) to the Illumina HiSeq instrument. To simulate a typical user’s results, we utilized the standard capture, alignment and variant calling methods specific to each platform. We restricted data analysis to include the capture region common to both methods. The Proton produced high quality data at a comparable average depth and read length, and the Ion Reporter variant caller identified 96 % of single nucleotide polymorphisms (SNPs) detected by the HiSeq and GATK pipeline. However, only 40 % of small insertion and deletion variants (indels) were identified by both methods. Usage of the trio structure and segregation of platform-specific alleles supported this result. Further comparison of the trio data with Complete Genomics sequence data and Illumina SNP microarray genotypes documented high concordance and accurate SNP genotyping of both Proton and Illumina platforms. However, our study underscored the problem of accurate detection of indels for both the Proton and HiSeq platforms.
Background
Genome sequence analysis has emerged as a powerful tool to detect a wide spectrum of genetic variation, from single base pair changes (single nucleotide variants), insertion/deletions, structural rearrangements, chimeric transcripts and gene rearrangements (Gonzaga-Jauregui et al. 2012; Meyerson et al. 2010; Gilissen et al. 2012; Bras et al. 2012; St Hilaire et al. 2011; Veltman and Brunner 2012; Gui et al. 2011). Next generation sequence technologies can generate DNA or RNA sequence and can be applied to characterize both common and rare genomic alterations across cancer types (Cancer Genome Atlas N 2012; Liu et al. 2012). While the cost of genome sequencing has fallen drastically, the field has focused on capturing and sequencing the protein-coding exons (whole-exome sequencing, WES), regions that are more readily interpreted both informatically and in follow-up laboratory studies (Gonzaga-Jauregui et al. 2012). The lower cost of WES has enabled investigators to utilize commercial capture products from companies, including, but not limited to, Agilent, Nimblegen, Life Technologies and Illumina to map Mendelian disorders and discover promising rare variants that contribute to complex diseases, such as cancer, diabetes and neurodegenerative disorders. Commercial capture methods can target small fragments of DNA (Nimblegen, Life Technologies, Illumina) or RNA (Agilent) with oligonucleotides that range in size from 60 to 120 bp (Clark et al. 2011).
Next-generation sequencing (NGS) technologies have enabled the rapid and effective proliferation of WES for both discovery and more recently, clinical diagnostics. In 2013, most WES studies are performed on Illumina HiSeq while the Life Technology SOLiD and Roche 454 platforms account for a small share of activities. The development of semiconductor-based sequencing has recently emerged as an alternate sequencing platform with the commercial release of the Personal Genome Machine (PGM) by Life Technologies (Rothberg et al. 2011; Merriman 2012; Drmanac et al. 2010). It has the potential to be cost-effective with a rapid turnaround time, perhaps faster than other current methods that rely on optical imaging and specialized fluorescent-labeled nucleotides. The underlying principle of the PGM is the non-optical detection of hydrogen ions released with the sequential addition of deoxynucleotides to a growing DNA chain, which could result in an inexpensive alternative to the current fluorescent-labeled detection platforms (Rothberg et al. 2011; Merriman 2012). Although the PGM produces megabases (Mbs) of DNA sequence within hours, its net output is insufficient to generate WES data with adequately high coverage per base. In 2012, Life Technologies released the “next-generation” of semiconductor sequencing instrumentation, the Proton, which was designed to generate gigabases (Gbs) of data, thus enabling investigators to conduct high quality WES, transcriptomes and, eventually, whole-genome sequencing rapidly at low cost.
We evaluated the performance of the Proton semiconductor-based sequencer for WES in a well-characterized Centre d’Etude du Polymorphisme Humain (CEPH) trio (family 1463) using the Life Technologies TargetSeq Exome v2 capture (average of 50 Mb of captured sequence/sample). We compared the output to data captured with the Nimblegen SeqCap Ez Exome v3 (average of 64 Mb of captured sequence/sample) and generated on an Illumina HiSeq according to the manufacturer’s recommendation. The analysis was restricted to the overlapping 43 Mb exome target. Our results from both platforms were compared to data generated on the same subjects using the Complete Genomics, Inc. (CGI) platform and in-house genotype data derived from a series of Illumina HumanHap and OmniChip SNP microarrays used to create the DCEG Imputation Reference Dataset (Wang et al. 2012).
Results
Proton exome sequencing and coverage statistics
For each sample, at least 9 Gb of data was produced with >70 million reads (Table 1). Each sample had >78 % reads on target, with an average depth of coverage >100 with>91 % coverage at 20 × (Table 1). To generate lists of predicted variants, the data were run in the Ion Reporter standard pipeline as described in the “Materials and methods”.
Table 1.
Proton run and alignment metrics
| Sample | Total bases (Gb) | Total aligned bases (Gb) | Mean read length (bp) | Total reads | Mapped reads | % Reads on target | Average coverage depth | Coverage at 20× | Coverage at 100× |
|---|---|---|---|---|---|---|---|---|---|
| NA12889 | 10.4 | 10.3 | 127 | 82,342,156 | 81,185,497 | 82.39 | 133 | 91.39 % | 54.68 % |
| NA12890 | 9.2 | 9.1 | 125 | 73,976,981 | 73,078,997 | 83.77 | 122 | 93.20 % | 50.60 % |
| NA12877 | 9 | 8.8 | 115 | 78,504,902 | 77,121,254 | 78.11 | 112 | 91.20 % | 45.33 % |
Illumina exome sequencing coverage statistics
Table 2 shows that at least 11 Gb of data was generated with >115 million reads. Each sample had ~66 % on-target reads, with an average coverage of >89 % at 20×(Table 2). Predicted variants were generated by the GATK pipeline, using “best practices” as described in the “Materials and methods”.
Table 2.
Illumina run and alignment metrics
| Sample | Total bases (Gb) | Total aligned bases (Gb) | Read length (bp) | Total reads | Mapped reads | % Reads on target | Average coverage depth | Coverage at 20 × | Coverage at 100× |
|---|---|---|---|---|---|---|---|---|---|
| NA12889 | 11.6 | 9.6 | 2 × 100 | 116,227,208 | 95,627,282 | 66.13 | 74 | 89.71 % | 34.05 % |
| NA12890 | 11.8 | 9.8 | 2 × 100 | 118,440,555 | 97,967,707 | 66.97 | 76 | 89.51 % | 35.57 % |
| NA12877 | 11.6 | 11.6 | 2 × 100 | 141,146,167 | 115,696,343 | 66.48 | 89 | 90.74 % | 43.90 % |
Definition of the overlapping region or evaluation region
After quality control metrics were applied as per the standard protocols for the two capture methods, we examined the on-target captures to determine the overlapping content for further analyses. The SeqCapEZ v3 method (Nimblegen, Madison, WI, USA), commonly used for Illumina HiSeq exomic sequencing, targets 63,564,965 bp while the Life Technologies TargetSeq v2 for Life Technologies Proton exomic sequencing targets 46,454,643 bp. The targeted bases overlap substantially (42,532,479 bp); SeqCapEZ v3 and TargetSeq v2 captures 21,274,718 and 3,922,164 unique bps, respectively. For the current analysis, only variants within the overlapping regions totaling 42,532,479 bp (herein referred to as the “evaluation region”) were used.
Variant calls (Illumina vs. Proton)
For NA12889, NA12890 and NA12877, there were a total of 32,542, 34,094 and 33,068 and 61,189, 62,293 and 62,622 variants by Proton and Illumina data, respectively. In the evaluation region there were 27,872, 29,160 and 28,331 variants called by Proton and 33,489, 33,888, and 34,256 by Illumina. There were variant calls observed as unique to Illumina and/or Proton sequencing within the evaluation region, however, there was a consistent and substantial overlap of variants called using both methods (73.7, 75.5, and 72.6 %, respectively) for each sample. Overall results per sample were consistent when evaluating the numbers and types of polymorphisms observed. Therefore, subsequent statistics in this report are for NA12877 (male offspring).
For NA12877, a total of 28,331 variants were observed by Proton, of which 26,323 (93 %) were also detected by Illumina (Table 3); among these there were 25,726 single nucleotide polymorphisms (SNPs) (96 % detected by Illumina) and 597 insertions and deletions (indels) (40 % detected by Illumina). A total of 25,597 (99.5 %) SNPs and 570 insertions and deletions (95.5 %) have been reported in dbSNP build 137 (Table 3). In addition, 7,933 total variants were detected uniquely by Illumina, of which 7,031 (88.6 %) were in dbSNP and 902 (11.4 %) were novel (Table 3). Of the Illumina-specific variants, there were 7,009 SNPs, and 924 indels detected; the majority (88.5 %) of SNPs and 89.9 % of indels had been previously reported in dbSNP (Table 3).
Table 3.
Pairwise comparison of results called for NA12877 by 3 platforms
| Category | Proton vs. Illumina total (dbSNP| novel)
|
Proton vs. CGI total (dbSNP| novel)
|
Illumina vs. CGI total (dbSNP| novel)
|
||||||
|---|---|---|---|---|---|---|---|---|---|
| Proton only | Intersection | Illumina only | Proton only | Intersection | CGI only | Illumina only | Intersection | CGI only | |
| SNP | 1125 (742|383) | 25726 (25597|129) | 7009 (6200|809) | 2841 (2447|394) | 24010 (23892|118) | 4217 (2802|1415) | 6656 (5815|841) | 26079 (25982|97) | 2148 (712|1436) |
| Indel | 883 (111|772) | 597 (570|27) | 924 (831|93) | 892 (124|768) | 588 (557|31) | 1021 (713|308) | 509 (426|83) | 1012 (975|37) | 597 (295|302) |
| Total | 2008 (853|1155) | 26323 (26167|156) | 7933 (7031|902) | 3733 (2571|1162) | 24598 (24449|149) | 5238 (3515|1723) | 7165 (6241|924) | 27091 (26957|134) | 2745 (1007|1738) |
In contrast to SNPs, there was a larger percentage of indels detected by Illumina and not by Proton as well as the converse (36.7 and 38.4 %, respectively). Because we noticed a significant difference in the distribution of indels between the 2 platforms as well as the percentage that had been previously reported in dbSNP, Fig. 1 displays the size distributions of insertions and deletions found in common and specifically to each platform as well as the fraction that are novel. As expected, the most common class of indels was 1 bp insertions and deletions, of which the majority is novel (Fig. 1a). The set of indels that were common to the 2 platforms also shows this pattern (Fig. 1b). However, the indels that are unique to the individual platforms display distinctly different patterns with the Proton showing a greater predominance of 1 bp insertions and deletions (Fig. 1c). There were 419 Illumina-specific deletions, 267 (69.2 %) of which were 1 bp deletions and 483 Illumina-specific insertions, 334 of which (69.2 %) were 1 bp insertions. The Proton-specific variants (Fig. 1d) are almost exclusively 1 bp deletions—of 828 Proton-specific deletions, 752 (90.8 %) were 1 bp deletions and of 55 insertions 24 (43.6 %) were also 1 bp in length. We examined the BAM files in the Integrative Genomics Viewer (IGV; http://www.broadinstitute.org/igv/) for a subset of the indels found to be unique to the Proton or Illumina data, and found that many of them were potentially false-positives due to alignment issues and/or homopolymer sequences.
Fig. 1.

Distribution of sizes of insertion/deletion polymorphisms (indels) by a all indels detected by Proton and Illumina overall, b indels detected in common by both Illumina and Proton, c indels detected by Illumina only and d indels detected by Proton only. Blue bars represent indels previously reported in dbSNP build 137, while red bars represent novel indels
To further examine the platform-specific alleles we used the trio structure to determine alleles that segregate and potential new alleles. There are 570 SNPs and 47 indels seen in the son on both platforms that are candidates for de novo mutations but are more likely missing calls in the parental DNA. Of the 1,125 Proton-specific SNPs in the son, 367 are also found in only one of the parents, consistent with them being real variants; and for indels, 158 of the Proton-specific variants also are found in only one parent. Mendelian segregation errors are rare, and only 11 were detected [supplementary figure].
Comparison to complete genomics WGS
To provide another method of validation, both the Proton and Illumina predicted variant lists were compared against a publicly available WGS dataset for NA12877 generated by CGI for the comparison region. CGI provides a critical benchmark as the WGS approach and the chemistry of the method have been demonstrated to perform well, particularly for indels (Lam et al. 2012). Overall, detection rates across the 3 platforms were high; 24,598 (73.3 %) of variants were detected by both Proton and CGI (Table 3) and 27,091 (73.2 %) of variants were detected by both Illumina and CGI (Table 3). Figure 2 shows a Venn diagram of the overlap among all 3 methods; while there is a substantial percentage of SNPs (66.4 %) detected by all 3 methods, there are still SNPs that only overlap using 2 methods (0.84–6.6 %) and some yet that are platform-specific (2.3–13.0 %). The overlap among platforms for indels is sparser; only 18.1 % of indels are detected by all 3 platforms, and the percentages of platform-specific indels are much higher (Fig. 2; 15.1–28.1 %). As shown in Table 3, 1,012 (67 %) of Illumina indels were confirmed by CG as well as 588 (40 %) Proton indels. In addition there were 1,848 indels detected by CG alone. Clearly the detection of indels is challenging to all 3 platforms (Fig. 2).
Fig. 2.
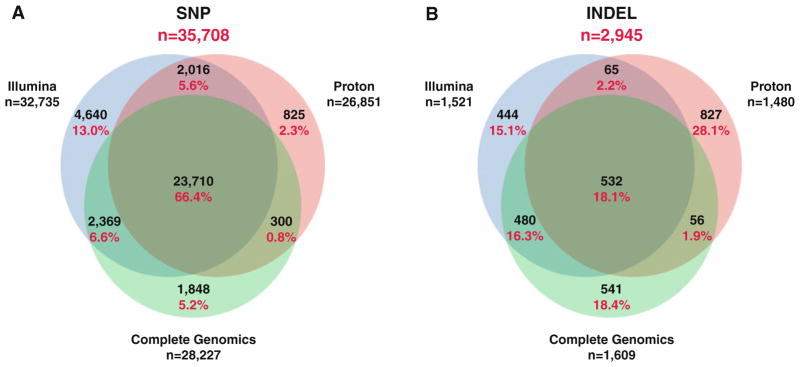
Venn diagrams of the overlap in numbers of variant calls by sequencing platform for a SNPs and b indels
Transitions and transversion (Ts/Tv)
In an analysis of the SNP data, we evaluated the nature of the sequence change (transition or transversion) and the ratio of transitions to transversions (Ts/Tv) because unusually high or low ratios may be indicative of false-positive variants within a group. Overall, Ts/Tv was 2.60 across the entire dataset; for the SNPs that were identified by both Proton and Illumina the ratio was 2.92. In contrast, the Illumina- and Proton-specific ratios were significantly different than the ratios obtained for SNPs detected by both platforms (Illumina: 1.94, 3.7 × 10−45; Proton: 1.39, p = 3.0 × 10⁻³⁴) regardless of whether they were novel or had been reported previously.
Identification of genic regions generating potential artifacts
Because there are regions of the genome that are difficult to align we chose to further evaluate only the variants in single-copy and non-repetitive regions. We performed a series of filters on the variant calls. Subtracting variants in segmentally duplicated regions resulted in 1,083 Illumina-and 699 Proton-specific SNPs. Further subtraction of variants in simple repeat regions (as defined by RE-PEATMASKER, http://www.repeatmasker.org) left 929 Illumina-specific SNPs and 592 Proton-specific SNPs. To remove variants in genes with obvious or apparent paralogs or pseudogenes, we conservatively eliminated genes with 5 or more variants as well as those from selected gene families such as olfactory receptors, HLA, zinc-finger proteins and mucins. This resulted in 488 Illumina-specific SNPs, of which 421 (86 %) had been previously reported in dbSNP. By contrast, for Proton there were 290 remaining SNPs with 225 (78 %) in dbSNP. Therefore, of variants that remain after these filters there are a very small number that are specific to each platform, the majority of which are in dbSNP, and therefore likely to be real variants.
Comparison to SNP microarray genotype data
SNP genotypes were available for more than 4 million loci for the parents of the trio, NA12889 and NA12890, based on a set of Illumina-series SNP microarray data generated as a part of the DCEG Imputation Reference Set (Wang et al. 2012). A total of 21,078 and 32,382 variants overlapped with the SNP genotypes for the Proton and Illumina WES data, respectively. Therefore, we evaluated genotype concordance per sample and per locus (Table 4). Per sample concordance across both platforms was >99 % for both NA12889 and NA12890 (Table 4). Over all loci tested, 34,255 Proton and 53,313 Illumina data comparisons for the 2 samples could be made between the chip-derived genotyping vs. variant calls made from WES. The locus concordance rate was also high (>99 %; Table 4); for the Proton vs. SNP chip comparison the majority (N = 189) of discordant results were for loci in which the chip-derived genotypes were heterozygote and the sequencing results produced homozygote calls. While it is possible that this class of discordance represents false-negative Proton calls, dbSNP annotation obtained from NCBI (http://www.ncbi.nih.gov/SNP) for 44 of these loci are flagged “RefAllele_conflict = yes,” which is described as “Unusual conditions noted by UCSC that may indicate a problem with the data” (see ftp://ncbi.nih.gov/snp/specs/BED_rsDocsum_Mapping.README.txt), which could represent instability in genotyping and/or sequencing within problematic genomic regions. In addition, 46 loci were discordant homozygotes by genotyping to heterozygotes by sequencing, which could either represent false-negative SNP genotype calls or false-positive sequencing calls. There were also a small number of loci for which the genotyping and sequencing data produced different heterozygotes (N = 6) and different homozygote genotypes (N = 29). Upon further examination, the majority of the heterozygote/heterozygote and homozygote/homozygote discordances are likely to be due to strand reporting issues, possibly in the Illumina Infinium genotyping manifest (e.g., the discordances are C/T → A/G or C/C → G/G).
Table 4.
Genotype concordance results per sample and platform vs. SNP microarray data
| Proton vs. SNP chip | Illumina vs. SNP chip | |
|---|---|---|
| NA12889 | 0.9920 | 0.9928 |
| NA12890 | 0.9923 | 0.9931 |
| # Loci tested | 21,078 | 32,382 |
| # Concordant pairs | 34,255 | 53,313 |
| # Discordant heterozygote → heterozygote | 6 | 4 |
| # Discordant heterozygote → homozygote | 189 | 27 |
| # Discordant homozygote → heterozygote | 46 | 304 |
| # Discordant homozygote → homozygote | 29 | 44 |
Direction of discordances is always shown as SNP microarray genotype → sequencing platform
The locus concordance rate was also high (>99 %; Table 4) for the Illumina vs. SNP microarray comparison, though the observed patterns of discordances were different. The majority (N = 304) of discordant results were for loci in which the chip-derived genotypes were homozygous and the sequencing results produced heterozygote calls. Similarly small numbers of heterozygote/heterozygote (N=4) and homozygote/homozygote (N=44) discordances were observed for this comparison and are most likely also due to strand reporting issues.
We further evaluated concordance for the subsets of variants that were private to each platform. Of the 825 Proton-exclusive variants previously reported in dbSNP, only 9 were SNPs that had been genotyped by SNP microarray; of the 4,640 variants called unique to Illumina there were 79 loci that overlapped the SNP chip. Concordance rates across this small number of loci were lower than in the overall set (around 90 %; see Table 4 for overall concordance) though the results were not remarkably different by sample or sequencing platform. Therefore, each platform identifies variants and gets the correct genotype call over 90 % of the time, but each platform detects a subset of variants that the other does not find.
Manual evaluation of BAM files
To examine the nature of the sequence and coverage of the platform-specific variants, the BAM files produced by Illumina and Proton sequencing for all 3 members of the trio were viewed in IGV. Supplementary Fig. 1 displays some representative screen shots. Most of the 1 bp indels specific to the Proton data were well covered in the Illumina sequence and did not display a deletion, thus representing false-positives for the Proton. A proportion of the Proton-specific SNPs occur in or near mononucleotide repeats and the presence of artifact deletions in the Proton sequence creates mis-alignments and false-positive Proton calls. While we found that the performance of the newer IonReporter 3.4 represented an improvement over the 3.2 version, there is still room for further improvement in accuracy. Many of the Illumina-specific SNPs are found in segmentally duplicated regions or simple-sequence repeats. Of those in single-copy regions, many have low-quality reads or low coverage and not called by Proton, representing false-negative Proton calls. In addition there were also examples of false-negative SNP calls in the Illumina sequence that are clear and present in the Proton data, and there are complex variants, tri-nucleotide repeats and other loci that are hard to call on both platforms.
Discussion
With the advent of next generation sequencing technologies, it is now possible to conduct genome-wide studies in search of variants associated with disease susceptibility as well as the drivers and passengers within cancer genomes (Dean 2003). Many studies have focused on the exome due to both cost efficiencies and the fact that it is the most tractable region of the genome for interpretation of the variants observed. In this regard, WES has accelerated the identification of Mendelian disease mutations, discovery of susceptibility alleles for complex diseases, the study of the somatic lesions in cancer (Gui et al. 2011; Lupski et al. 2010; Jones et al. 2010) and has already been introduced into clinical diagnostics and care (Manolio et al. 2013). However, there is a critical need for evaluation of each new method generating sequencing data against competing sequencing methods as well as non-sequence-based techniques (Quail et al. 2012; Lam et al. 2012; Loman et al. 2012). Therefore, we sought to evaluate the results of WES using Life Technologies’ Proton and compare it to the most widely used WES technology, Illumina HiSeq, as well as genotypes derived from SNP microarrays.
Because WES capture methods differ with respect to specific target regions that cover the exons in known or predicted human genes, we chose to compare variants detected only within the regions that were in common between the TargetSeq 50M (Proton sequencing) and Nimblegen SeqCapEZ v3 (Illumina sequencing). There is a small likelihood of introducing major biases, particularly since we also made comparisons to high concordance SNP genotyping, employed the trio structure of the samples, as well as high coverage CGI data. While the capture method differs between Illumina and the Proton, the resultant coverage (112–133 × for Proton and 74–89 × for Illumina) was somewhat higher for Proton, though both technologies produced data adequate for detection of the majority of variants in germline DNA (Tables 1 and 2).
From our study, it is clear that both Illumina and Proton WES perform well for SNP detection, as well as when compared to the CGI WGS data (see Table 3 and Fig. 2a). A substantial number of SNPs were detected within the evaluation region by all 3 platforms (23,710 or 66.4 %) and an additional 13 % were detected by 2 of the 3 methods. Yet, platform-specific SNPs were still observed (2.3–13 %, depending on the platform; Fig. 2a). Though these differences could be due to variable capture efficiency across certain targeted regions or fundamental differences in the abilities of the sequencing technologies themselves, it is also possible that much of these differences are due to the different alignment and calling algorithms (Wilm et al. 2012) as stated previously. Furthermore, there was extremely high concordance for loci between SNP microarray genotypes and variant calls from both Proton and Illumina data (>99 %; Table 4), suggesting that the variants that are called are of high quality.
Our analysis revealed a substantial difference in performance for the detection of indels. Only 18.1 % of indels were detected by all 3 methods, and overall 61.5 % were platform-specific (Table 3 and Fig. 2b). The Proton results were biased towards reporting single-base deletions (Fig. 1c); greater than 90 % of novel indels called by Proton were of this class and upon further examination, we observed many of them to fall within the context of homopolymers or tri-nucleotide repeats. The majority of the Illumina indels are both single-base insertions and deletions (Fig. 1d), with similar proportions of known and novel variants reported. We attempted to use CGI data to resolve Proton- and Illumina-specific calls, and over half of the Illumina-specific indels are also detected by CGI (Fig. 2b). Still, at least 541 indels were detected by only the CGI platform, underscoring the challenge of accurate indel detection by rapid WES analysis (Fig. 2b). The difficulty in detecting and determining the genotype of short indels, especially in homopolymer regions, remains a challenge because of the propensity for polymerase slipping during PCR, resulting in sequence artifacts. Indels can also cause inefficiencies in the hybridization steps of exome capture and both Illumina and Proton sequencing methods would be expected to show polymerase slipping during sequencing. Since indels are expected to account for a larger fraction of somatic changes in cancer, further refinement of the calling algorithms for both Illumina and Proton WES data is needed. O’Rawe et al. (2013) used GATK and 4 other alignment and variant calling pipelines on the same Illumina WES dataset and had concordance as low as 27 % for overlapping variant calls, particularly indels.
Among the limitations of our study are its small sample size, namely a well-studied trio and the use of cell line instead of native DNA, which is known to harbor complex chromosomal rearrangements and aberrations (Nickles et al. 2012). However, the family structure enabled an assessment of possible error rates and de novo mutations. In addition, the same aliquot of DNA was used for all sequencing experiments, so any bias that may be introduced using cell line DNA should be consistent.
Several practical issues related to implementation of a Proton into a NGS pipeline are worth noting. The run time for a Proton is considerably shorter (3.5 h run time and 8 h data processing) than the typically 6-day HiSeq 2 × 100 bp run. While the current Proton chemistry supports one exome per P1 chip to generate sufficient WES coverage for variant detection, newer protocols generating 2 exomes per P1 chip per sequencing run are currently being optimized, and the forthcoming P2 version chip, when it becomes commercially available, may accommodate as many as 8 exomes per chip. This could allow investigators to produce approximately 8 exomes per Proton machine per day.
Conclusions
The Proton instrument can generate high-quality WES data as measured by coverage and accuracy for SNPs. The method detects a small number of SNPs and indels not detected by Illumina WES or CGI WGS (Fig. 2a, b), though this was similarly observed for both the Illumina WES and CGI WGS. Our analysis identifies major discrepancies in all methods in the detection of small indels, a major challenge that necessitates advances in both the technical sequencing and/or the bioinformatics algorithms.
Materials and methods
Samples
Three individuals from CEPH pedigree 1463 were used for sequencing (Dausset et al. 1990), all germline DNA from NA12889 (father), NA12890 (mother) and NA12877 (male offspring). DNA was obtained from Coriell Institute for Medical Research.
Proton sequencing (TargetSeq capture)
DNA preparation
1 μg of high molecular weight DNA per sample (as determined by Picogreen assay from Invitrogen, Carlsbad, CA, USA) was used in TargetSeq exome v2 capture process. The samples were enzymatically sheared using the Ion Shear Plus Reagents Kit (Life Technologies, Carlsbad, CA, USA) to a target size range of 135–165 bp.
Library preparation for TargetSeq exome capture
Sheared Genomic DNA followed the TargetSeq protocol for ligation, nick repair, purification, size selection and final amplification prior to exome capture. For the ligation and nick repair, a master mix consisting of 10 μL 10× Ligase Buffer, 10 μL A and P1 adapters, 2 μL dNTP mix, 41 μL nuclease free water, 4 μL DNA ligase and 8 μL nick repair polymerase. PCR conditions were as follows: 25 °C for 15 min, 98 °C for 20 min. The last step was a hold at 4 °C until further processing. The amplified material was cleaned with Ampure XP reagent (Agencourt, Boston, MA, USA) according to the TargetSeq v2 protocol, except the DNA was eluted in 20 μL of Low TE. Amplified sample libraries were size selected using the Pippen Prep instrument (Sage Science, Beverly, MA, USA). The samples were processed according to the TargetSeq protocol. The Pippen Prep was set to elute “Tight” at 220 bp. The eluted size selected samples were cleaned with Ampure XP reagent (Agencourt, Boston, MA, USA) according to the TargetSeq v2 protocol, except the DNA was eluted in 30 μL of Low TE. The final amplification of the size selected fragment libraries was performed using the following conditions. For each library, a master mix consisting of 200 μL Platinum PCR Supermix High Fidelity and 20 μL Library Amplification Primer Mix was added. PCR cycling conditions were as follows: 95 °C for 5 min, followed by 8 cycles of 95 °C for 15 s, 58 °C for 15 s, 70 °C for 1 min. The reaction was kept at 4 °C until further processing. The amplified samples were purified with Ampure XP reagent (Agencourt, Boston, MA, USA) according to the TargetSeq v2 protocol, except the DNA was eluted in 50 μL of Low TE. At this point, the samples were quantitated and qualitatively assessed on the Agilent Bioanalyzer (Agilent Technologies, Santa Clara, CA, USA).
TargetSeq exome capture
An aliquot of 500 ng of each size selected sample fragment library was used in the TargetSeq Exome enrichment step. For each sample, the following were pipetted into a 1.5 mL tube: 5 μL 1 mg/mL Human Cot-1 DNA, 500 ng of sample, 5 μL each of Ion TargetSeq Blocker P1 and A. The mix was dried down in a vacuum concentrator set at 60 °C. Drying time was approximately 30 min. To each sample tube, we added 7.5 μL TargetSeq Hybridization Solution A (2×) and 3 μL TargetSeq Hybridization Enhancer B. The tubes were placed in a thermocycler for 10 min at 95 °C to denature the DNA. The sample was then transferred to a 0.2 mL tube containing 4.5 μL of the TargetSeq Custom Probe Pool. The tubes were placed in a thermocycler at 47 °C for 72 h. After the 72 h incubation, the samples were washed and the probe-hybridized DNA was recovered. The wash and recovery steps followed the TargetSeq protocol with no deviations. After wash and recovery, the samples were eluted in 30 μL of nuclease free water. Final amplification was performed for each sample according to the TargetSeq protocol. A master mix containing 200 μL Platinum PCR Supermix High Fidelity and 20 μL Ion TargetSeq Amplification Primer Mix was added to the 30 μL of TargetSeq capture beads. PCR cycling conditions were as follows: 95 °C for 5 min, followed by 8 cycles of 95 °C for 15 s, 58 °C for 15 s, 70 °C for 1 min. The reaction was kept at 4 °C until further processing. The amplified samples were purified with Ampure XP reagent (Agencourt, Boston, MA, USA) according to the TargetSeq v2 protocol with the DNA being eluted in 25 μL of Low TE. At this point, the samples were quantitated and qualitatively assessed on the Agilent Bioanalyzer (Agilent Technologies, Santa Clara, CA, USA).
Proton target enrichment and sequencing
Captured DNA was then processed for the Proton Sequencing process according to the commercially available protocols. Each sample was processed on a OneTouch 2 instrument and enriched on a OneTouch 2 ES station. After enrichment, each sample was loaded onto 1 P1 Proton Chip and sequenced individually by chip on our Proton Sequencers.
Illumina sequencing (Nimblegen3.0)
DNA preparation
For each sample, 1.1 μg genomic was sheared with Covaris E210 Sonicator (Covaris, Inc., Woburn, MA, USA) to target of 200–300 bp average size. An adapter-ligated library was prepared with the TruSeq DNA Sample Preparation Kit (Illumina, San Diego, CA, USA) according to Illumina-provided protocol.
Pre-hybridization LM-PCR
Genomic DNA sample libraries were amplified pre-hybridization by ligation-mediated PCR consisting of one reaction containing 20 μL DNA, 26 μL MBG Water, 50 μL Phusion High Fidelity PCR Master Mix (New England BioLabs, Ipswich, MA, USA), 2 μL TS-PCR Oligo 1, 100 μM (5′-AATGATACGGCGACCACCGA CA-3′), 2 μL TS-PCR Oligo 2 and 100 μM (5′-CAAG CAGAAGACGGCATACGAG-3′). PCR cycling conditions were as follows: 98 °C for 30 s, followed by 8 cycles of 98 °C for 10 s, 60 °C for 30 s, 72 °C for 30 s. The last step was an extension at 72 °C for 5 min. The reaction was kept at 4 °C until further processing. The amplified material was cleaned with QIAquick PCR Purification Kit (Qiagen, Valencia, CA, USA) according to the manufacturer’s protocol, except the DNA was eluted in 50 μL of water. Amplified sample libraries were quantified and the evaluated electrophoretically.
Liquid phase sequence capture
Prior to hybridization, 4 amplified sample libraries with unique index adapters were combined in equal amounts (250 ng) into 1 μg pools for multiplex sequence capture. Exome sequence capture was performed with NimbleGen’s SeqCap EZ Human Exome Library v3.0 with 64 Mb of exonic sequence targeted (Roche NimbleGen, Inc., Madison, WI, USA). Prior to hybridization the following components were added to the 1 μg pooled sample library, 4 μL of TS-HE universal oligo, 250 μM (5′-AATGATAC GGCGACCACCGAGATCTACACTCTTTCCCT ACAC GACGCT CTTCCGATCT-3′), 5 μL of each TS-INVE-HE blocking oligo (5′-CAAGCAGAAGACGGCATACG AGA TXGTGACT GGAGTTCAGACGTGTG CTCTTCCGAT CT/C3 Spacer/-3′, where X is 6–8 bp of sequence specific to adapter index used for library construction) within pooled libraries, and 5 μL of 1 mg/mL COT-1 DNA (Invitrogen, Inc., Carlsbad, CA, USA). Samples were dried down by puncturing a hole in plate seal and processing in an Eppendorf 5301 Vacuum Concentrator (Eppendorf, Hauppauge, NY, USA) set to 60 °C for approximately 1 h. To each dried pool, 7.5 μL of NimbleGen Hybridization Buffer and 3.0 μL of NimbleGen Hybridization Component A were added, and placed in a heating block for 10 min at 95 °C. The mixture was then transferred to 4.5 μL of EZ Exome Probe Library and hybridized at 47 °C for 64–72 h. Washing and recovery of captured DNA were performed as described in NimbleGen SeqCap EZ Library SR Protocol.
Post-hybridization LM-PCR
Pools of captured DNA were amplified by ligation-mediated PCR consisting of two reactions for each pool using the same enzyme concentration as the pre-capture amplification. Post-hybridization amplification cycling conditions were as follows: 98 °C for 30 s, followed by 17 cycles of 98 °C for 10 s, 60 °C for 30 s, 72 °C for 30 s. The last step was an extension at 72 °C for 5 min. The reaction was kept at 4 °C until further processing. The amplified captured DNA was cleaned with QIAquick PCR Purification kit according to the manufacturer’s protocol. Pools of amplified captured DNA were then quantified and evaluated electrophoretically.
Illumina sequencing
The resulting post-capture enriched multiplexed sequencing libraries were diluted to 16.25 nM and used in cluster formation on an Illumina cBOT and paired-end sequencing is performed using an Illumina HiSeq following Illumina-provided protocols for 2 × 100 paired-end sequencing. Each exome was sequenced to high-depth to achieve a minimum threshold of 80 % of coding sequence (CDS) covered with at least 15 reads, based on the UCSC hg19 “known gene” transcripts (http://genome.ucsc.edu/). An average CDS coverage of over 160 was typically required to meet the minimum threshold.
Life Technologies Proton browser and Ion Reporter
For each Proton Sequence run (NA12877, NA12889 and NA12890), the Proton Run Browser was used for quality control metrics. The metrics include percent bead loading, useable sequence, read length, alignment metrics to hg19 and mean raw accuracy. As seen in Table 1, each sample had passing scores for each metric mentioned above. Upon successful review of each run, the sequence files were uploaded to Life Technologies Ion Reporter (IR) using the available plug-in, IonReporterUploader_V1_2. Upload time for each sample was approximately 1–2 h depending upon the traffic in the cloud. Once the data was uploaded to IR, the samples were processed using their standard workflow, entitled “TargetSeq Germline Exome from a Single Sample”. The process was straightforward and easy to navigate. Process time was a few hours per sample. Once the variants were called, we easily downloaded the variants and began the comparison across platforms.
Bioinformatic analysis—Illumina pipeline
The human reference genome and the “known gene” transcript annotation were downloaded from the UCSC database (http://genome.ucsc.edu/), version hg19 (corresponding to Genome Reference Consortium assembly GRCh37). Reads were aligned to the hg19 reference genome using the Novoalign software version 2.07.14. Duplicate reads based on paired ends aligning to the same start locations due to either optical or PCR artifacts were marked and ignored from further analysis using the MarkDuplicates module of the Picard software version 1.67 (http://picard.sourceforge.net/) using default parameters. Alignments for each individual were refined using a local realignment strategy around known and novel sites of insertion and deletion polymorphisms using the RealignerTargetCreator and IndelRealigner modules from the Genome Analysis Toolkit (GATK) (McKenna et al. 2010; DePristo et al. 2011). Variant discovery and genotype calling of multi-allelic substitutions, insertions and deletions were performed on each individual using the UnifiedGenotyper module from GATK with a 250 read depth threshold, the minimum call quality parameter and emission confidence both set to 30.
CGI publicly available data
Data for the called variants in the 1463 trio was downloaded from the CGI web site, from:
ftp://ftp2.completegenomics.com/vcf_files/Build37_2.0.0/vcfBeta-NA12877-200-37-ASM.vcf.bz2
ftp://ftp2.completegenomics.com/vcf_files/Build37_2.0.0/vcfBeta-NA12889-200-37-ASM.vcf.bz2
ftp://ftp2.completegenomics.com/vcf_files/Build37_2.0.0/vcfBeta-NA12890-200-37-ASM.vcf.bz2
SNP genotyping data
NA12889 (father) and NA12890 (mother) were genotyped using multiple chip types of the Illumina Omni series (OmniExpress, 2.5M, 5M) and subsequent imputation to 1,000 genomes and the DCEG imputation reference set (Wang et al. 2012). A total of 5,277,009 genotypes, 18,161 of which were polymorphic and overlapped the targeted region, were used for concordance testing.
Analysis tools
To make comparison between variant calls from the two platforms for the common target, VCF files were subset to contain variants within the common target region (Danecek et al. 2011). The common target region was achieved by intersecting target manifest using the bedtools (Quinlan and Hall 2010), then analyzed using GATK’s module ‘Variant-Eval’. In addition to each VCF file evaluation, both VCFs were combined by GATK’s module ‘CombineVariants’ which tags each variant as Proton-specific, Illumina-specific, or intersection of the two. The combined VCF file was then compared with the CGI data as well as dbSNP build 137. SNP genotype concordance was calculated using the GLU software package (https://code.google.com/p/glu-genetics/). Tests of Mendelian inheritance were performed using PLINK (Purcell et al. 2007).
Supplementary Material
Acknowledgments
This research has been funded in whole or in part with federal funds from the National Cancer Institute, National Institutes of Health, under Contract No. HHSN261200800001E and supported in part by the Intramural Research Program of the Division of Cancer Epidemiology and Genetics and the Center for Cancer Research, National Cancer Institute, NIH, DHHS, Bethesda, MD, USA. The content of this publication does not necessarily reflect the views or policies of the Department of Health and Human Services or does mention of trade names, commercial products, or organizations imply endorsement by the U.S. Government.
Footnotes
Electronic supplementary material The online version of this article (doi:10.1007/s00439-013-1321-4) contains supplementary material, which is available to authorized users.
Contributor Information
Joseph F. Boland, Email: bolandj2@mail.nih.gov, Cancer Genomics Research Laboratory, Division of Cancer Epidemiology and Genetics, National Cancer Institute, NIH, DHHS, 8717 Grovemont Circle, Gaithersburg, MD 20877, USA. Frederick National Laboratory for Cancer Research, SAIC-Frederick Inc, Gaithersburg, USA
Charles C. Chung, Cancer Genomics Research Laboratory, Division of Cancer Epidemiology and Genetics, National Cancer Institute, NIH, DHHS, 8717 Grovemont Circle, Gaithersburg, MD 20877, USA. Frederick National Laboratory for Cancer Research, SAIC-Frederick Inc, Gaithersburg, USA
David Roberson, Cancer Genomics Research Laboratory, Division of Cancer Epidemiology and Genetics, National Cancer Institute, NIH, DHHS, 8717 Grovemont Circle, Gaithersburg, MD 20877, USA. Frederick National Laboratory for Cancer Research, SAIC-Frederick Inc, Gaithersburg, USA.
Jason Mitchell, Cancer Genomics Research Laboratory, Division of Cancer Epidemiology and Genetics, National Cancer Institute, NIH, DHHS, 8717 Grovemont Circle, Gaithersburg, MD 20877, USA. Frederick National Laboratory for Cancer Research, SAIC-Frederick Inc, Gaithersburg, USA.
Xijun Zhang, Cancer Genomics Research Laboratory, Division of Cancer Epidemiology and Genetics, National Cancer Institute, NIH, DHHS, 8717 Grovemont Circle, Gaithersburg, MD 20877, USA. Frederick National Laboratory for Cancer Research, SAIC-Frederick Inc, Gaithersburg, USA.
Kate M. Im, Laboratory of Experimental Immunology, Center for Cancer Research, National Cancer Institute, NIH, DHHS, Frederick, MD 21702, USA
Ji He, Cancer Genomics Research Laboratory, Division of Cancer Epidemiology and Genetics, National Cancer Institute, NIH, DHHS, 8717 Grovemont Circle, Gaithersburg, MD 20877, USA. Frederick National Laboratory for Cancer Research, SAIC-Frederick Inc, Gaithersburg, USA.
Stephen J. Chanock, Cancer Genomics Research Laboratory, Division of Cancer Epidemiology and Genetics, National Cancer Institute, NIH, DHHS, 8717 Grovemont Circle, Gaithersburg, MD 20877, USA
Meredith Yeager, Cancer Genomics Research Laboratory, Division of Cancer Epidemiology and Genetics, National Cancer Institute, NIH, DHHS, 8717 Grovemont Circle, Gaithersburg, MD 20877, USA. Frederick National Laboratory for Cancer Research, SAIC-Frederick Inc, Gaithersburg, USA.
Michael Dean, Email: deanm@mail.nih.gov, Laboratory of Experimental Immunology, Center for Cancer Research, National Cancer Institute, NIH, DHHS, Frederick, MD 21702, USA.
References
- Bras J, Guerreiro R, Hardy J. Use of next-generation sequencing and other whole-genome strategies to dissect neurological disease. Nat Rev Neurosci. 2012;13:453–464. doi: 10.1038/nrn3271. [DOI] [PubMed] [Google Scholar]
- Cancer Genome Atlas N. Comprehensive molecular portraits of human breast tumours. Nature. 2012;490:61–70. doi: 10.1038/nature11412. [DOI] [PMC free article] [PubMed] [Google Scholar]
- Clark MJ, Chen R, Lam HY, Karczewski KJ, Chen R, Euskirchen G, Butte AJ, Snyder M. Performance comparison of exome DNA sequencing technologies. Nat Biotechnol. 2011;29:908–914. doi: 10.1038/nbt.1975. [DOI] [PMC free article] [PubMed] [Google Scholar]
- Danecek P, Auton A, Abecasis G, Albers CA, Banks E, DePristo MA, Handsaker RE, Lunter G, Marth GT, Sherry ST, et al. The variant call format and VCFtools. Bioinformatics. 2011;27:2156–2158. doi: 10.1093/bioinformatics/btr330. [DOI] [PMC free article] [PubMed] [Google Scholar]
- Dausset J, Cann H, Cohen D, Lathrop M, Lalouel JM, White R. Centre d’etude du polymorphisme humain (CEPH): collaborative genetic mapping of the human genome. Genomics. 1990;6:575–577. doi: 10.1016/0888-7543(90)90491-c. [DOI] [PubMed] [Google Scholar]
- Dean M. Approaches to identify genes for complex human diseases: lessons from Mendelian disorders. Hum Mutat. 2003;22:261–274. doi: 10.1002/humu.10259. [DOI] [PubMed] [Google Scholar]
- DePristo MA, Banks E, Poplin R, Garimella KV, Maguire JR, Hartl C, Philippakis AA, del Angel G, Rivas MA, Hanna M, et al. A framework for variation discovery and genotyping using next-generation DNA sequencing data. Nat Genet. 2011;43:491–498. doi: 10.1038/ng.806. [DOI] [PMC free article] [PubMed] [Google Scholar]
- Drmanac R, Sparks AB, Callow MJ, Halpern AL, Burns NL, Kermani BG, Carnevali P, Nazarenko I, Nilsen GB, Yeung G, et al. Human genome sequencing using unchained base reads on self-assembling DNA nanoarrays. Science. 2010;327:78–81. doi: 10.1126/science.1181498. [DOI] [PubMed] [Google Scholar]
- Gilissen C, Hoischen A, Brunner HG, Veltman JA. Disease gene identification strategies for exome sequencing. Eur J Hum Genet: EJHG. 2012;20:490–497. doi: 10.1038/ejhg.2011.258. [DOI] [PMC free article] [PubMed] [Google Scholar]
- Gonzaga-Jauregui C, Lupski JR, Gibbs RA. Human genome sequencing in health and disease. Annu Rev Med. 2012;63:35–61. doi: 10.1146/annurev-med-051010-162644. [DOI] [PMC free article] [PubMed] [Google Scholar]
- Gui Y, Guo G, Huang Y, Hu X, Tang A, Gao S, Wu R, Chen C, Li X, Zhou L, et al. Frequent mutations of chromatin remodeling genes in transitional cell carcinoma of the bladder. Nat Genet. 2011;43:875–878. doi: 10.1038/ng.907. [DOI] [PMC free article] [PubMed] [Google Scholar]
- Jones S, Wang TL, Shih Ie M, Mao TL, Nakayama K, Roden R, Glas R, Slamon D, Diaz LA, Jr, Vogelstein B, et al. Frequent mutations of chromatin remodeling gene ARID1A in ovarian clear cell carcinoma. Science. 2010;330:228–231. doi: 10.1126/science.1196333. [DOI] [PMC free article] [PubMed] [Google Scholar]
- Lam HY, Clark MJ, Chen R, Natsoulis G, O’Huallachain M, Dewey FE, Habegger L, Ashley EA, Gerstein MB, Butte AJ, et al. Performance comparison of whole-genome sequencing platforms. Nat Biotechnol. 2012;30:78–82. doi: 10.1038/nbt.2065. [DOI] [PMC free article] [PubMed] [Google Scholar]
- Liu P, Morrison C, Wang L, Xiong D, Vedell P, Cui P, Hua X, Ding F, Lu Y, James M, et al. Identification of somatic mutations in non-small cell lung carcinomas using whole-exome sequencing. Carcinogenesis. 2012;33:1270–1276. doi: 10.1093/carcin/bgs148. [DOI] [PMC free article] [PubMed] [Google Scholar]
- Loman NJ, Misra RV, Dallman TJ, Constantinidou C, Gharbia SE, Wain J, Pallen MJ. Performance comparison of benchtop high-throughput sequencing platforms. Nat Biotechnol. 2012;30:434–439. doi: 10.1038/nbt.2198. [DOI] [PubMed] [Google Scholar]
- Lupski JR, Reid JG, Gonzaga-Jauregui C, Rio Deiros D, Chen DC, Nazareth L, Bainbridge M, Dinh H, Jing C, Wheeler DA, et al. Whole-genome sequencing in a patient with Charcot–Marie-Tooth neuropathy. N Engl J Med. 2010;362:1181–1191. doi: 10.1056/NEJMoa0908094. [DOI] [PMC free article] [PubMed] [Google Scholar]
- Manolio TA, Chisholm RL, Ozenberger B, Roden DM, Williams MS, Wilson R, Bick D, Bottinger EP, Brilliant MH, Eng C, et al. Implementing genomic medicine in the clinic: the future is here. Genet Med. 2013;15(4):258–267. doi: 10.1038/gim.2012.157. [DOI] [PMC free article] [PubMed] [Google Scholar]
- McKenna A, Hanna M, Banks E, Sivachenko A, Cibulskis K, Kernytsky A, Garimella K, Altshuler D, Gabriel S, Daly M, DePristo MA. The genome analysis toolkit: a MapReduce framework for analyzing next-generation DNA sequencing data. Genome Res. 2010;20:1297–1303. doi: 10.1101/gr.107524.110. [DOI] [PMC free article] [PubMed] [Google Scholar]
- Merriman B, ITRDT, Rothberg JM. Progress in Ion Torrent semiconductor chip based sequencing. Electrophoresis. 2012;33:3397–3417. doi: 10.1002/elps.201200424. [DOI] [PubMed] [Google Scholar]
- Meyerson M, Gabriel S, Getz G. Advances in understanding cancer genomes through second-generation sequencing. Nat Rev Genet. 2010;11:685–696. doi: 10.1038/nrg2841. [DOI] [PubMed] [Google Scholar]
- Nickles D, Madireddy L, Yang S, Khankhanian P, Lincoln S, Hauser SL, Oksenberg JR, Baranzini SE. In depth comparison of an individual’s DNA and its lymphoblastoid cell line using whole genome sequencing. BMC Genomics. 2012;13:477. doi: 10.1186/1471-2164-13-477. [DOI] [PMC free article] [PubMed] [Google Scholar]
- O’Rawe J, Jiang T, Sun G, Wu Y, Wang W, Hu J, Bodily P, Tian L, Hakonarson H, Johnson WE, et al. Low concordance of multiple variant-calling pipelines: practical implications for exome and genome sequencing. Genome Med. 2013;5:28. doi: 10.1186/gm432. [DOI] [PMC free article] [PubMed] [Google Scholar]
- Purcell S, Neale B, Todd-Brown K, Thomas L, Ferreira MA, Bender D, Maller J, Sklar P, de Bakker PI, Daly MJ, Sham PC. PLINK: a tool set for whole-genome association and population-based linkage analyses. Am J Hum Genet. 2007;81:559–575. doi: 10.1086/519795. [DOI] [PMC free article] [PubMed] [Google Scholar]
- Quail MA, Smith M, Coupland P, Otto TD, Harris SR, Connor TR, Bertoni A, Swerdlow HP, Gu Y. A tale of three next generation sequencing platforms: comparison of Ion Torrent, Pacific Biosciences and Illumina MiSeq sequencers. BMC Genomics. 2012;13:341. doi: 10.1186/1471-2164-13-341. [DOI] [PMC free article] [PubMed] [Google Scholar]
- Quinlan AR, Hall IM. BEDTools: a flexible suite of utilities for comparing genomic features. Bioinformatics. 2010;26:841–842. doi: 10.1093/bioinformatics/btq033. [DOI] [PMC free article] [PubMed] [Google Scholar]
- Rothberg JM, Hinz W, Rearick TM, Schultz J, Mileski W, Davey M, Leamon JH, Johnson K, Milgrew MJ, Edwards M, et al. An integrated semiconductor device enabling non-optical genome sequencing. Nature. 2011;475:348–352. doi: 10.1038/nature10242. [DOI] [PubMed] [Google Scholar]
- St Hilaire C, Ziegler SG, Markello TC, Brusco A, Groden C, Gill F, Carlson-Donohoe H, Lederman RJ, Chen MY, Yang D, et al. NT5E mutations and arterial calcifications. N Engl J Med. 2011;364:432–442. doi: 10.1056/NEJMoa0912923. [DOI] [PMC free article] [PubMed] [Google Scholar]
- Veltman JA, Brunner HG. De novo mutations in human genetic disease. Nat Rev Genet. 2012;13:565–575. doi: 10.1038/nrg3241. [DOI] [PubMed] [Google Scholar]
- Wang Z, Jacobs KB, Yeager M, Hutchinson A, Sampson J, Chatterjee N, Albanes D, Berndt SI, Chung CC, Diver WR, et al. Improved imputation of common and uncommon SNPs with a new reference set. Nat Genet. 2012;44:6–7. doi: 10.1038/ng.1044. [DOI] [PMC free article] [PubMed] [Google Scholar]
- Wilm A, Aw PP, Bertrand D, Yeo GH, Ong SH, Wong CH, Khor CC, Petric R, Hibberd ML, Nagarajan N. LoFreq: a sequence-quality aware, ultra-sensitive variant caller for uncovering cell-population heterogeneity from high-throughput sequencing datasets. Nucleic Acids Res. 2012;40:11189–11201. doi: 10.1093/nar/gks918. [DOI] [PMC free article] [PubMed] [Google Scholar]
Associated Data
This section collects any data citations, data availability statements, or supplementary materials included in this article.