

Abstract
Background/Objectives
Genetic factors play an important role in body mass index (BMI) variation, and also likely play a role in the weight-loss and body composition response to physical activity/exercise. With the recent identification of BMI–associated genetic variants, it is possible to investigate the interaction of these genetic factors with exercise on body composition outcomes.
Subjects/Methods
In a block-randomized clinical trial of resistance exercise among women (n=148), we examined whether the putative effect of exercise on weight and DXA-derived body composition measurements differs according to genetic risk for obesity. Approximately one-half of the sample was randomized to an intervention consisting of a supervised, intensive, resistance exercise program, lasting one year. Genetic risk for obesity was defined as a genetic risk score (GRS) comprised of 21 SNPs known to be associated with normal BMI variation. We examined the interaction of exercise intervention and the GRS on anthropometric and body composition measurements after one year of the exercise intervention.
Results
We found statistically significant interactions for body weight (p=0.01), body fat (p=0.01), body fat % (p=0.02), and abdominal fat (p=0.02), whereby the putative effect of exercise is greater among those with a lower level of genetic risk for obesity. No single SNP appears to be a major driver of these interactions.
Conclusions
The weight-loss response to resistance exercise, including changes in body composition, differs according to an individual’s genetic risk for obesity.
Introduction
Evidence suggests that increased physical activity can reduce fat mass, increase muscle mass, and prevent weight gain1,2. It is also well established that body weight is under the influence of genetic factors3. In addition, evidence suggests that genetic factors play a role in how individuals respond to exercise/physical activity4,5. As specific genetic factors for body weight have recently been identified, there is increasing interest in whether/how genetic susceptibility might interact with lifestyle factors such as physical activity6,7.
Through meta-analyses of genome-wide association studies (GWAS), over 30 single nucleotide polymorphisms (SNPs) have been identified as being associated with body mass index (BMI) variation (e.g.8). Subsequent analyses suggest that the putative effect of these SNPs varies according to one’s self-reported level of physical activity7,9,10. However, many of the studies assessing the interaction of physical activity with genetic factors are based on subjective assessments of physical activity. A more accurate way to assess such interactions is to randomize and supervise an exercise intervention so as to minimize several potential biases that might exist in observational studies. Two previous studies that have examined the interaction of a genetic variant in the FTO variant with exercise11,12 show mixed results with respect to whether the effect of exercise differs according to this major obesity gene.
In a one-year long randomized exercise intervention study, we have previously examined variants in the adrenergic receptor, and identified a significant SNP*exercise interaction on body composition outcomes13. Here, we hypothesize that the effect of resistance exercise on changes in weight and body composition over one year is modified by overall genetic risk, defined as a score based on 21 BMI-associated genetic variants.
Methods
Study sample
The Bone Estrogen Strength Training (BEST) study is a block-randomized clinical trial examining the effect of resistance training on bone and body composition in early post-menopausal women14. Postmenopausal women (n=320), using or not using hormone replacement therapy (HT versus NHT) were randomized to exercise (EX) or no exercise (control—NEX) within each HT group. Participants were recruited through direct mailing in zip codes selected based on proximity (within 5 miles) of the University of Arizona testing site, as well as at community organizations, medical clinics, and through media advertisement. Inclusion criteria included: 30–65 years of age, BMI between 19 and 33, non-smoking, performing less than 120 minutes of low-intensity exercise per week, and no weightlifting or similar activity. Further details on the recruitment, screening, and inclusion criteria can be found elsewhere1,14. IRB approval was obtained from the University of Arizona, and written informed consent was obtained from all participants.
Participants agreed to maintain HT status, body weight, and diet during the trial2,14. Women who completed 12 months of the BEST Study (n=266) were re-recruited and consented for genetic studies. A total of 148 (55.6%) returned the consent along with a buccal sample for DNA extraction. The genotyped sub-sample of the parent study was not considered clinically different from those in the main study at baseline or at 12 months for completers of the trial that re-consented for genotyping versus those that did not. However, the genetic ancillary study participants consisted of more exercisers (56.8% EX group; 43.2% NEX group re-consented). The number of HT users that participated in the genetic study was also slightly higher than non-HT users13.
Exercise Intervention
Participants randomized to the exercise intervention were asked to engage in supervised, high-intensity resistance training and moderate impact weight-bearing exercise for 75 minutes, 3 days/week, for 12 months. Eight weight-training exercises were performed per session, where individuals completed two sets of 6–8 repetitions at 70–80% of the one-repetition maximum loads per exercise. Strength was measured every 6–8 weeks over the 12 months to increase loads and maintain relative intensity. Attendance, weightlifting loads, sets and repetitions, and minutes of progressive weight bearing activity were recorded in exercise logs which were monitored regularly by on-site study trainers throughout the year. Compliance was assessed among exercisers as the proportion of days (out of three-per-week) that they attended training sessions. Muscle strength was assessed through a LIDO isokinetic dynamometer (Loredan Biomedical, Sacramento, CA). Peak torque was measured at 60°/s of the right knee flexion-extension (KF, KE) and right elbow flexion-extension (EF, EE). One-repetition maximum (1-RM) was assessed only among exercisers, and defined as the maximum amount of weight that could be lifted one single time, using proper technique, for each exercise. Here we include data on 1-RM for military press and leg press. Detailed descriptions of the study design, exclusion criteria, and exercise and strength measurement protocol have been previously published2,14–16.
Phenotypes and dietary intake
Height, weight, and body composition traits were measured at baseline and after one year of the study. Whole-body lean and fat tissue were measured by dual-energy x-ray absorptiometry (DXA; model DPX-L, Lunar Radiation Corporation, Madison, WI, software version 1.3y Lunar). Abdominal fat was retrospectively measured by an operator-set region extending from the intervertebral region between the first and second vertebra to the iliac crest. Further details on body composition measurements can be found elsewhere1,14. Dietary intake was assessed by diet records on eight randomly assigned days at baseline (3 days), 6 months (2 days), and 12 months (3 days). Each 2- to 3-week recording period included 1 weekend day and 1–2 non-consecutive weekdays. Participants did not receive dietary advice and were instructed not to change their diets during the study. Analysis of the diet records for macro-, micro-nutrients, and total energy intake (kcal) was conducted using the Minnesota Nutrient Data System (NDS) versions 2.8–2.92, as previously described14.
Genotypes and genetic risk score
DNA was obtained from buccal cells collected in mouthwash either during routine lab visits or via a mailed buccal cell collection kit, containing a sealed 44 mL bottle of Scope mouthwash (Proctor & Gamble, Cincinnati, OH), a sealed, sterile collection cup, instructions for collection, and a prepaid return envelope. Participants were asked not to eat or drink for 1 hour prior to sample collection, swish 10 mL mouthwash vigorously for 45 sec, expectorate into the cup, and mail the container in the provided packaging13,17. DNA extraction was performed by the QIAampDNA Mini Kit (QIAGEN #51104, Valencia, CA) following manufacturer guidelines. DNA quality and quantity were assessed by 558 base-pair polymerase chain reaction (PCR), separated on a 2% agarose gel by electrophoresis, and visualized by ethidium bromide staining. DNA quantification was also performed by PicoGreen dsDNA Quantitation Reagent and fluorimetry.
Of the 32 SNPs previously identified for BMI through GWAS meta-analyses (e.g. Speliotes et al., 2010; Willer et al., 2009), we were able to perform and obtain genotyping for 21 using the Sequenom (San Diego, CA) MassARRAY platform. A genetic risk score for BMI was calculated by summing the risk alleles across all SNPs, and weighting each risk allele by the effect size, where the respective risk alleles and effect sizes were determined from the latest BMI GWAS meta-analysis8. The list of SNPs that we examined, along with their respective risk alleles and effect sizes (weights) can be found in Table 1.
Table 1.
List of single nucleotide polymorphisms (SNPs).
| SNP | Nearest Gene | Minor Allele | Minor Allele Frequency | Other Allele | Risk allele | Weight* |
|---|---|---|---|---|---|---|
| rs10150332 | NRXN3 | C | 0.25 | T | C | 0.13 |
| rs10938397 | GNPDA2 | G | 0.44 | A | G | 0.18 |
| rs10968576 | LRRN6C | G | 0.32 | A | G | 0.11 |
| rs11847697 | PRKD1 | T | 0.04 | C | T | 0.17 |
| rs12444979 | GPRC5B | T | 0.09 | C | C | 0.17 |
| rs13107325 | SLC39A8 | T | 0.06 | C | T | 0.19 |
| rs1558902 | FTO | A | 0.38 | T | A | 0.39 |
| rs2112347 | FLJ35779 | G | 0.41 | T | T | 0.1 |
| rs2241423 | MAP2K5 | A | 0.27 | G | G | 0.13 |
| rs2287019 | QPCTL-GIPR | T | 0.23 | C | C | 0.15 |
| rs2815752 | NEGR1 | C | 0.35 | T | A | 0.13 |
| rs2890652 | LRP1B | C | 0.15 | T | C | 0.09 |
| rs3817334 | MTCH2 | T | 0.47 | C | T | 0.06 |
| rs4771122 | MTIF3 | G | 0.22 | A | G | 0.09 |
| rs4836133 | ZNF608 | A | 0.42 | C | A | 0.07 |
| rs4929949 | RPL27A | T | 0.48 | C | C | 0.06 |
| rs543874 | SEC16B | G | 0.19 | A | G | 0.22 |
| rs7138803 | FAIM2 | A | 0.35 | G | A | 0.12 |
| rs887912 | FANCL | A | 0.28 | G | T | 0.1 |
| rs9816226 | ETV5 | A | 0.19 | T | T | 0.14 |
| rs987237 | TFAP2B | G | 0.20 | A | G | 0.13 |
weight refers to the SNP coefficient estimated in Speliotes et al.8
Statistical analysis
We used multiple linear regression, assuming an additive SNP model. We included exercise, and the corresponding baseline phenotype as covariates when examining measurements at year 1. We also tested models including age, hormone use, and dietary energy intake as additional covariates. We considered a p-value less than 0.05 as statistically significant. To test interactions, we included in the model the product of exercise and the GRS. We stratified the sample according to tertiles of GRS to examine how the association of exercise with phenotype differs across these three groups of individuals. All analyses were conducted using R Statistical Software19.
Results
Characteristics of the sample are shown in Table 2. These results have previously been described13, but we will briefly describe them here again. The mean age is 56.1 ± 4.6 years of age. At baseline, we find no significant differences in characteristics between the control and exercise group. Mean compliance among those in the exercise group was 77.3%, which corresponds to exercise session attendance at approximately 2.3 days per week, on average. After one year, we observe a greater increase in lean soft tissue (p<0.001) and % soft tissue (p<0.001) and a greater decrease in fat (p=0.049) and % fat (p=0.002) in the exercise group as compared to the control group. Strength increased significantly among the exercisers as compared to the control group for leg strength (p<0.0001). For arm strength, we observed a non-significant trend for increased strength among exercisers as compared to the control group. Among only exercisers, 1-RM for leg press and military press increased by an average of 171.6 and 7.4 pounds, respectively, over the one year of the intervention (see Table 2).
Table 2.
Descriptive statistics of the sample
| Characteristics | Total (n=148) | Control (n=64) | Exercise (n=84) | p |
|---|---|---|---|---|
| Age (years) | 56.1±4.6 | 56.4±5.0 | 55.8±4.2 | 0.40 |
| Hormone therapy (%) | 54% | 53% | 55% | 0.84 |
| Year 1 Dietary intake (kcal) | 1670.9±422.6 | 1679.0±404.7 | 1665.0±438.2 | 0.85 |
| Baseline weight (kg) | 66.9±11.7 | 66.0±10.9 | 67.6±12.2 | 0.42 |
| Change after 1 year | 0.1±2.7 | 0.3±3.0 | 0.03±2.5 | 0.62 |
| Baseline total body fat (g) | 25381±8249 | 24950±8232 | 25710±8295 | 0.58 |
| Change after 1 year | −312±2471 | 153±2580 | −665±2339 | 0.049 |
| Baseline total body % fat (%) | 37.7±6.6 | 37.4±7.2 | 37.9±6.2 | 0.71 |
| Change after 1 year | −0.6±2.6 | 0.09±2.5 | −1.2±2.5 | 0.002 |
| Baseline lean soft tissue (kg) | 38.3±4.6 | 38.0±4.2 | 38.6±4.9 | 0.42 |
| Change after 1 year | 0.5±1.2 | 0.02±1.2 | 0.9±1.0 | <0.001 |
| Baseline % lean soft tissue (%) | 58.0±6.2 | 58.3±6.8 | 57.0±5.8 | 0.64 |
| Change after 1 year | 0.7±2.6 | −0.1±2.5 | 1.3±2.4 | <0.001 |
| Baseline abdominal fat (kg) | 10.4±2.3 | 10.5±2.2 | 10.3±2.3 | 0.64 |
| Change after 1 year | −0.03±0.6 | 0.06±0.5 | −0.1±0.7 | 0.10 |
| KF change (n=121;0=53,1=68) | 3.43±9.69 | 0.55±7.77 | 5.68±10.5 | <0.001 |
| KE change (n=121;0=53,1=68) | 6.40±16.23 | 1.78±13.30 | 10.0±17.5 | <0.001 |
| EE change (n=114;0=47,1=67) | 0.34±3.52 | −0.128±1.85 | 0.66±4.3 | 0.31 |
| EF change (n=114;0=47,1=67) | 0.79±4.57 | −0.04±2.340 | 1.37±5.6 | 0.07 |
| Change Leg Press 1-RM (lbs) | 171.6±90.1 | |||
| Change Military Press 1-RM (lbs) | 7.42±3.59 |
KF – knee flexion; KE – knee extension; EF – elbow flexion; EE – elbow extension; 1-RM – 1 repetition maximum
Values are expressed as means ± SD
Sample sizes for the strength measures are given, where 0 refers to controls, and 1 refers to exercisers.
We found statistically significant interactions (pinteraction<0.05) of exercise with the GRS on change in weight, total and % body fat, and abdominal fat (see Table 3). The interaction of exercise with GRS was not statistically significant for % lean soft tissue (p=0.05). Including additional covariates (age, hormone use, and dietary intake) did not significantly change the results. Upon stratifying the sample according to tertiles of GRS, we find that the association of exercise with phenotype change is strongest among the individuals with low genetic risk (see Figure 1, and Table 4 for all phenotypes). No SNP-by-exercise interaction was statistically significant after correction for multiple testing.
Table 3.
Regression model for year 1 phenotypes in relation to GRS, exercise, and the GRS*exercise interaction
| GRS | Exercise | GRS*Exercise | ||||||||
|---|---|---|---|---|---|---|---|---|---|---|
|
|
||||||||||
| Coeff | SE | p | Coeff | SE | p | Coeff | SE | p | ||
| year 1 weight | Model 0 | −0.06 | 0.41 | 0.88 | – | – | – | – | – | – |
| Model 1 | −0.05 | 0.41 | 0.91 | −0.17 | 0.44 | 0.70 | – | – | – | |
| Model 2 | −1.25 | 0.61 | 0.04 | −4.82 | 1.85 | 0.01 | 2.10 | 0.81 | 0.01 | |
|
| ||||||||||
| year 1 total body fat | Model 0 | 126.25 | 378.27 | 0.74 | – | – | – | – | – | – |
| Model 1 | 175.75 | 375.25 | 0.64 | −816.52 | 408.92 | 0.048 | – | – | – | |
| Model 2 | −940.14 | 564.17 | 0.10 | −5127.43 | 1700.23 | 0.003 | 1945.80 | 745.78 | 0.01 | |
|
| ||||||||||
| year 1 total body % fat | Model 0 | 0.22 | 0.39 | 0.58 | – | – | – | – | – | – |
| Model 1 | 0.30 | 0.38 | 0.43 | −1.30 | 0.41 | 0.002 | – | – | – | |
| Model 2 | −0.73 | 0.57 | 0.20 | −5.27 | 1.73 | 0.003 | 1.79 | 0.76 | 0.02 | |
|
| ||||||||||
| year 1 lean soft tissue | Model 0 | −0.17 | 0.18 | 0.33 | – | – | – | – | – | – |
| Model 1 | −0.23 | 0.16 | 0.17 | 0.89 | 0.18 | <0.001 | – | – | – | |
| Model 2 | −0.42 | 0.25 | 0.10 | 0.15 | 0.75 | 0.84 | 0.33 | 0.33 | 0.31 | |
|
| ||||||||||
| year 1 % lean soft tissue | Model 0 | −0.19 | 0.39 | 0.63 | – | – | – | – | – | – |
| Model 1 | −0.28 | 0.38 | 0.46 | 1.49 | 0.41 | <0.001 | – | – | – | |
| Model 2 | 0.58 | 0.57 | 0.31 | 4.81 | 1.73 | 0.01 | −1.50 | 0.76 | 0.05 | |
|
| ||||||||||
| year 1 abdominal fat | Model 0 | 0.05 | 0.09 | 0.60 | – | – | – | – | – | – |
| Model 1 | 0.06 | 0.09 | 0.52 | −0.17 | 0.10 | 0.09 | – | – | – | |
| Model 2 | −0.19 | 0.14 | 0.17 | −1.13 | 0.41 | 0.01 | 0.43 | 0.18 | 0.02 | |
Model 0: Year 1 body composition = β0 + β1*Baseline body composition + β2*GRS + error
Model 1: Year 1 body composition = β0 + β1*Baseline body composition + β2*GRS + β3*exercise + error
Model 2: Year 1 body composition = β0 + β1*Baseline body composition + β2*GRS + β3*exercise + β4*exercise*GRS +error
Figure 1.
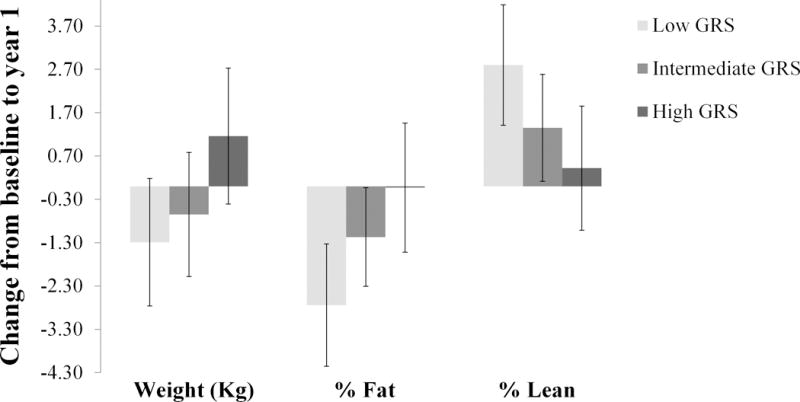
Change in weight, % fat, and % lean from baseline to year 1 associated with the exercise intervention in three strata of obesity GRS.
Table 4.
GRS-stratified association of phenotype change from baseline to year 1 with exercise.
| Exercise | |||||||||
|---|---|---|---|---|---|---|---|---|---|
|
| |||||||||
| 1st Tertile GRS | 2nd Tertile GRS | 3rd Tertile GRS | |||||||
|
| |||||||||
| Coeff | SE | p | Coeff | SE | p | Coeff | SE | p | |
| Change weight (kg) | −1.29 | 0.75 | 0.09 | −0.65 | 0.73 | 0.38 | 1.16 | 0.80 | 0.16 |
| Change total body fat | −2121.86 | 656.55 | 0.002 | −909.51 | 614.74 | 0.15 | 496.85 | 783.79 | 0.53 |
| Change total body % fat | −2.74 | 0.72 | <0.001 | −1.17 | 0.58 | 0.049 | −0.03 | 0.76 | 0.97 |
| Change lean soft tissue | 0.99 | 0.27 | <0.001 | 0.51 | 0.33 | 0.13 | 1.01 | 0.37 | 0.01 |
| Change % lean soft tissue | 2.80 | 0.71 | <0.001 | 1.35 | 0.63 | 0.037 | 0.42 | 0.73 | 0.57 |
| Change abdominal fat | −0.46 | 0.20 | 0.024 | −0.16 | 0.16 | 0.33 | 0.14 | 0.14 | 0.33 |
Model: Change body composition = β0 + β1* Exercise + error
p-values <0.05 are bolded
Discussion
In a block-randomized clinical trial for resistance exercise, we find significant interactions of exercise with genetic risk for obesity on change in weight and body fat. It appears that these interactions are not driven by any one particular SNP, but rather are the result of a collective effect of many SNPs.
Our results show that the putative effect of exercise is weakest among those at high genetic risk. Conversely, the putative effect of the genes is strongest among those who were randomized to the exercise intervention. These findings contrast with our previous finding in this sample showing that a risk variant in ADR (not included in present genetic risk score) was associated with detrimental effects when sedentary, but had an effect that was equivalent to the non-risk group when exercising13. They also contrast with the observational and cross-sectional findings regarding the interaction of FTO and self-reported physical activity, in which the association of physical activity with BMI is strongest among individuals with high genetic risk7,10. However, we would note, that besides the important methodological differences with our study, the results from these meta-analyses are not consistent across studies. Furthermore, our results are consistent with another intervention study that found that the association of physical activity/exercise is weakest among FTO risk allele carriers11. Our results are also in agreement with a prospective observational study which showed that the association of physical activity and type-2 diabetes is weakest among individuals at high genetic risk20, and a study showing that among individuals with high genetic risk for an adverse lipid profile, the effect of a lifestyle intervention on LDL reduction was weaker than in those with low genetic risk21.
Given the high expression of BMI-associated genes in the hypothalamus8,22, it is plausible that these genes interact with physical activity through physiological mechanisms such as taste, satiety, or regulation of energy expenditure23,24. It is also possible that these genes influence BMI and response to exercise through other mechanisms such as nutrient partitioning or other metabolic processes. For example, variant rs2287019 near GIPR (gastric inhibitory polypeptide receptor), may be involved in mediating insulin secretion. Other loci, although of unknown function, may be involved in other metabolic processes, as suggested by pathway analysis8. One possibility is that exercise changes the way in which these genes are expressed. Specifically, the effect of these genes may be down-regulated through the effect of exercise, and thus reduce hunger or taste cues, or alter metabolic processes, for example. Individuals at low genetic risk may have a decreased food-intake, increased energy-expenditure, and/or improved metabolic response to increased exercise, compared to those at high genetic risk. Further research is needed however to determine the functional impact of these genetic variants.
The strengths of our study include the use of a randomized and supervised exercise intervention of relatively long duration (1 year), detailed phenotypic measurements of body composition before and after the intervention, and the use of a GRS which increases our statistical power. The main weakness of our study is the small sample size, partly due to the need to re-consent. However, our power to detect genetic effects is increased through the reduction in environmental variance which is afforded through the randomized intervention, thus potentially offsetting the relatively small sample size.
Further research in other populations may eventually enable the routine use of genetic profile information in tailoring disease prevention and treatment measures.
Acknowledgments
The authors would like to thank the organizers and participants of the BEST study.
Funding: The BEST Study was funded by National Institutes of Health (NIH) AR39939 and the 2005 Gatorade Sports Science Institute Student Grant Award. Calcium supplements and Scope mouthwash were donated by Mission Pharmacal and Proctor and Gamble, respectively. Y.C.K. was supported by NIH Grant K01DK095032.
Footnotes
Conflict of Interest Statement: The authors have no conflicts of interest to declare.
References
- 1.Bea J, Cussler E, Going S, Blew R, Metcalfe L, Lohman T. Resistance Training Predicts Six-Year Body Composition Change in Postmenopausal Women. Med Sci Sport Exerc. 2010;42(7):1286–95. doi: 10.1249/MSS.0b013e3181ca8115. [DOI] [PMC free article] [PubMed] [Google Scholar]
- 2.Teixeira PJ, Going SB, Houtkooper LB, Metcalfe LL, Blew RM, Flint-Wagner HG, et al. Resistance training in postmenopausal women with and without hormone therapy. Med Sci Sports Exerc. 2003;35(4):555–62. doi: 10.1249/01.MSS.0000058437.17262.11. [DOI] [PubMed] [Google Scholar]
- 3.Stunkard AJ, Harris JR, Pedersen NL, McClearn GE. N Engl J Med [Internet] Department of Psychiatry, University of Pennsylvania; Philadelphia: 1990. May 24, The body-mass index of twins who have been reared apart. 322(0028-4793 (Print) LA – eng PT – Journal Article PT – Research Support, Non-U.S. Gov’t PT – Research Support, U.S. Gov’t, P.H.S SB – AIM SB – IM):1483–7. [DOI] [PubMed] [Google Scholar]
- 4.Bouchard C, Dionne F, Simoneau J, Boulay M. Genetics of aerobic and anaerobic performances. Exerc Sport Sci Rev. 1992;20:27–58. [PubMed] [Google Scholar]
- 5.Bouchard C, Rankinen T. Individual differences in response to regular physical activity. Med Sci Sports Exerc. 2001;33(6 Suppl):S446–51. doi: 10.1097/00005768-200106001-00013. discussion S452–3. [DOI] [PubMed] [Google Scholar]
- 6.Kilpeläinen TO, Qi L, Brage S, Sharp SJ, Sonestedt E, Demerath E, et al. Physical activity attenuates the influence of FTO variants on obesity risk: A meta-analysis of 218,166 adults and 19,268 children. PLoS Med. 2011;8(11) doi: 10.1371/journal.pmed.1001116. [DOI] [PMC free article] [PubMed] [Google Scholar]
- 7.Ahmad S, Rukh G, Varga TV, Ali A, Kurbasic A, Shungin D, et al. Gene × physical activity interactions in obesity: combined analysis of 111,421 individuals of European ancestry. In: Allison DB, editor. PLoS Genet [Internet] 7. Vol. 9. p. e1003607. Public Library of Science; 2013 Jan [cited 2014 Jul 9]; [DOI] [PMC free article] [PubMed] [Google Scholar]
- 8.Speliotes EK, Willer CJ, Berndt SI, Monda KL, Thorleifsson G, Jackson AU, et al. Nat Genet [Internet] Vol. 42. Metabolism Initiative and Program in Medical and Population Genetics, Broad Institute; Cambridge, Massachusetts, USA: 2010. Nov, Association analyses of 249,796 individuals reveal 18 new loci associated with body mass index. (1546-1718 (Electronic)):937–48. [DOI] [PMC free article] [PubMed] [Google Scholar]
- 9.Kilpeläinen T, Qi L, Brage S, Sharp S, Sonestedt E, Demerath E, et al. Physical activity attenuates the influence of FTO variants on obesity risk: a meta-analysis of 218,166 adults and 19,268 children. In: Lewis C, editor. PLoS Med [Internet] 11. Vol. 8. 2011. p. e1001116. Public Library of Science. [DOI] [PMC free article] [PubMed] [Google Scholar]
- 10.Li S, Zhao JH, Luan J, Ekelund U, Luben RN, Khaw K-T, et al. Physical Activity Attenuates the Genetic Predisposition to Obesity in 20,000 Men and Women from EPIC-Norfolk Prospective Population Study. In: Ioannidis JPA, editor. PLoS Med [Internet] 8. Vol. 7. 2010. p. 9. Public Library of Science. [DOI] [PMC free article] [PubMed] [Google Scholar]
- 11.Rankinen T, Rice T, Teran-Garcia M, Rao DC, Bouchard C. FTO genotype is associated with exercise training-induced changes in body composition. Obesity (Silver Spring) 2010;18(2):322–6. doi: 10.1038/oby.2009.205. [DOI] [PMC free article] [PubMed] [Google Scholar]
- 12.Mitchell JA, Church TS, Rankinen T, Earnest CP, Sui X, Blair SN. FTO genotype and the weight loss benefits of moderate intensity exercise. Obesity (Silver Spring) 2010;18(3):641–3. doi: 10.1038/oby.2009.311. [DOI] [PMC free article] [PubMed] [Google Scholar]
- 13.Bea J, Lohman T, Cussler E, Going S, Thompson P. Lifestyle modifies the relationship between body composition and adrenergic receptor genetic polymorphisms, ADRB2, ADRB3 and ADRA2B: A secondary analysis of a randomized controlled trial of physical activity among postmenopausal women. Behav Genet. 2010;40(5):649–59. doi: 10.1007/s10519-010-9361-1. [DOI] [PMC free article] [PubMed] [Google Scholar]
- 14.Going S, Lohman T, Houtkooper L, Metcalfe L, Flint-Wagner H, Blew R, et al. Effects of exercise on bone mineral density in calcium-replete postmenopausal women with and without hormone replacement therapy. Osteoporos Int. 2003;14(8):637–43. doi: 10.1007/s00198-003-1436-x. [DOI] [PubMed] [Google Scholar]
- 15.Metcalfe L, Lohman T, Going S, Houtkooper L, Ferreira D, Flint-Wagner H, et al. Postmenopausal women and exercise for the prevention of osteoporosis: The Bone, Estrogen, and Strength Training (BEST) study. ACSM’s Heal Fit J. 2001;5(3):6–14. [Google Scholar]
- 16.Figueroa A, Going SB, Milliken LA, Blew RM, Sharp S, Teixeira PJ, et al. Effects of exercise training and hormone replacement therapy on lean and fat mass in postmenopausal women. J Gerontol A Biol Sci Med Sci. 2003:266–70. doi: 10.1093/gerona/58.3.m266. [DOI] [PubMed] [Google Scholar]
- 17.García-Closas M, Egan KM, Abruzzo J, Newcomb PA, Titus-Ernstoff L, Franklin T, et al. Collection of genomic DNA from adults in epidemiological studies by buccal cytobrush and mouthwash. Cancer Epidemiol Biomarkers Prev. 2001;10(6):687–96. [PubMed] [Google Scholar]
- 18.Willer CJ, Speliotes EK, Loos RJ, Li S, Lindgren CM, Heid IM, et al. Nat Genet [Internet] Vol. 41. Genetic Investigation of ANthropometric Traits Consortium; 2009. Jan, Six new loci associated with body mass index highlight a neuronal influence on body weight regulation. (1546-1718 (Electronic)):25–34. [DOI] [PMC free article] [PubMed] [Google Scholar]
- 19.Team RDC. R: A language and environment for statistical computing. 2011 [Google Scholar]
- 20.Klimentidis YC, Chen Z, Arora A, Hsu CH. Association of physical activity with lower type 2 diabetes incidence is weaker among individuals at high genetic risk. Diabetologia. 2014 doi: 10.1007/s00125-014-3380-z. [DOI] [PMC free article] [PubMed] [Google Scholar]
- 21.Pollin TI, Isakova T, Jablonski KA, de Bakker PIW, Taylor A, McAteer J, et al. Genetic modulation of lipid profiles following lifestyle modification or metformin treatment: the Diabetes Prevention Program. In: Allison DB, editor. PLoS Genet [Internet] 8. Vol. 8. p. e1002895. Public Library of Science; 2012 Jan [cited 2014 Oct 13]; [DOI] [PMC free article] [PubMed] [Google Scholar]
- 22.Gerken T, Girard CA, Tung Y-CL, Webby CJ, Saudek V, Hewitson KS, et al. The obesity-associated FTO gene encodes a 2-oxoglutarate-dependent nucleic acid demethylase. Science. 2007;318(5855):1469–72. doi: 10.1126/science.1151710. [DOI] [PMC free article] [PubMed] [Google Scholar]
- 23.Heni M, Kullmann S, Veit R, Ketterer C, Frank S, Machicao F, et al. Variation in the obesity risk gene FTO determines the postprandial cerebral processing of food stimuli in the prefrontal cortex. Mol Metab Elsevier GmbH. 2014;3(2):109–13. doi: 10.1016/j.molmet.2013.11.009. [DOI] [PMC free article] [PubMed] [Google Scholar]
- 24.Cecil JE, Ph D, Tavendale R, Watt P, Hetherington MM, Palmer CNA. An obesity-associated FTO gene variant and increased energy intake in children. N Engl J Med [Internet] 2008;359(24):2558–66. doi: 10.1056/NEJMoa0803839. [DOI] [PubMed] [Google Scholar]