

Abstract
We present a novel strategy for deriving a classification system of functional neuroimaging paradigms that relies on hierarchical clustering of experiments archived in the BrainMap database. The goal of our proof-of-concept application was to examine the underlying neural architecture of the face perception literature from a meta-analytic perspective, as these studies include a wide range of tasks. Task-based results exhibiting similar activation patterns were grouped as similar, while tasks activating different brain networks were classified as functionally distinct. We identified four sub-classes of face tasks: (1) Visuospatial Attention and Visuomotor Coordination to Faces, (2) Perception and Recognition of Faces, (3) Social Processing and Episodic Recall of Faces, and (4) Face Naming and Lexical Retrieval. Interpretation of these sub-classes supports an extension of a well-known model of face perception to include a core system for visual analysis and extended systems for personal information, emotion, and salience processing. Overall, these results demonstrate that a large-scale data mining approach can inform the evolution of theoretical cognitive models by probing the range of behavioral manipulations across experimental tasks.
Keywords: faces, face perception, cognitive paradigms, functional neuroimaging, meta-analysis, neuroinformatics
INTRODUCTION
As more resources are being developed and deployed for the management, sharing, and meta-analysis of “big data” in neuroimaging, the development of knowledge representation systems has likewise accelerated to enable objective and succinct descriptions of these data, including neurotechnological, neuroanatomical, and cognitive parameters. However, cognitive data descriptors are relatively under-developed compared to those from the neurotechnological and neuroanatomical domains. That is, as a community we are relatively more confident regarding data annotations differentiating sub-class or type of MRI scan (e.g., T2* or EPI images) or brain structure (e.g., hippocampus or amygdala) than in differentiating data that relates to memory (e.g., episodic or working). Nevertheless, semantic representation of cognitive and perceptual mental processes is a necessary component of large-scale, community-wide, and consensus-based mapping of structure-function correspondences in the human brain. Such a representation must include the full and robust definitions of mental processes; however, the identification and standardization of terms we use to describe the multitude and diversity of cognitive and perceptual functions is an inexact science. As a result, many alternative and often competitive terminologies exist. With the rise of high profile, high-impact projects such as the Human Connectome Project (Van Essen et al., 2013; Toga et al., 2012), the BRAIN Initiative (BRAIN Working Group, 2014), the Human Brain Project (Markram, 2012), and the RDoCs framework (Insel et al., 2010), the need for knowledge representations of cognitive aspects of neuroscience data has reached a critical point. Our community goal of mapping the human brain will surely require definition and standardization of the terms that are used to describe human thought and mental processes, as well as the behavioral tasks used to elicit them during neuroscience experiments.
Here, we propose and validate a strategy for deriving a classification system of functional neuroimaging paradigms using a proof-of-concept application. Our aim was to develop a meta-analytic data mining approach for paradigm classification based on neurobiological evidence provided by functional activation patterns, with the intent that such a strategy may mitigate the challenges associated with a lack of paradigm-related semantic consensus within a given domain. The overall premise of this work is that differences in activation patterns across studies should be captured and leveraged as they indicate meaningful segregations in brain function. Under this premise, tasks activating similar brain networks should be grouped as functionally similar in a cognitive schema, while tasks demonstrating differential activation patterns should be classified as functionally distinct.
As an exemplar domain, we demonstrate our approach in the context of face discrimination, as this category of neuroimaging tasks is highly heterogeneous and commonly employed across numerous perceptual, cognitive, and affective studies in both healthy and diseased populations. These studies broadly include visual stimulus presentation of human faces in which participants passively view faces or actively discriminate one or more aspects or features of face presentation (e.g., old/new, male/female, happy/sad/angry/fearful, etc.). Faces can be used as stimuli for classical conditioning, lip-reading, and naming tasks, or to cue autobiographical memory retrieval, emotion induction, or social processing. Given the wide scope of face tasks in the literature, our aim was to establish a neuroinformatics procedure capable of objectively decomposing the collective group into meaningful sub-categories. Using meta-analytic data reported across a diverse range of studies archived in the BrainMap database, we sought to determine if multiple functional networks distributed across the brain are differentially recruited for various task paradigms. Our ultimate goal was threefold: to develop a paradigm classification strategy for use by cognitive ontologies, to examine the underlying neural architecture of face perception from a meta-analytic perspective, and, more broadly, to assess whether an evidence-based data mining approach can inform the evolution of existing cognitive models.
METHODS
Meta-Analytic Data Extraction and Pre-Processing
The BrainMap database (Fox and Lancaster, 2002; Laird et al., 2005a; Laird et al., 2011a) currently archives brain activation locations from over 11,900 functional magnetic resonance imaging (fMRI) or positron emission tomography (PET) experiments (from over 2,400 journal articles). These experiments have been manually annotated with metadata that describe the experimental design of each archived study. Our study focused on a subset of tasks within BrainMap that were annotated with the paradigm class of “Face Monitor or Discrimination”; the relevant experiments were identified and downloaded for further analysis using the desktop search engine application, BrainMap Sleuth (http://www.brainmap.org/sleuth). Search results were filtered to include only face tasks performed by healthy adults to limit any potential bias due to effects of age, disease, or treatment differences. Information about the specific behavioral task performed by participants in each experiment, along with the experiment name, sample size, and stereotaxic coordinates of activation were exported as a tab-delimited text file. Exported coordinates reported in MNI space (Evans et al., 1993; Collins et al., 1994) were transformed to Talairach space (Talairach and Tournoux, 1988) using the Lancaster transform function icbm2tal (Lancaster et. al., 2007). icbm2tal was developed using global affine transforms to accommodate spatial disparity between Talairach and MNI coordinates as compared to the earlier mni2tal transform (Brett et al., 2001), and to minimize meta-analytic spatial dissonance due to template differences (Laird et al., 2010). Modeled activation (MA) maps were generated by modeling each coordinate of activation as a spherical Gaussian distribution of uncertainty to represent the probability of activation for each voxel, centered upon the experiment’s activation foci (Figure 1, Step 1). The algorithm includes an estimation of the inter-subject and inter-laboratory variability associated with each experiment, and is weighted by the number of subjects included in each experiment (Eickhoff et al., 2009). The per-experiment MA probability maps were converted into feature vectors of voxel values and concatenated horizontally to form an array of size n experiments by p voxels.
Figure 1. Data Analysis Pipeline.

Step 1: Per-experiment coordinate-based data were extracted from BrainMap and used to generate modeled activation (MA) maps. Step 2: A pairwise correlation analysis was performed in which correlation coefficients were calculated for each n experiment compared to every other n experiment. Step 3: Experiments were grouped into clusters using hierarchical clustering analysis. Step 4: Meta-analysis of the per-cluster set of experimental MA-maps was performed using the activation likelihood estimation (ALE) method.
Correlation Matrix Based Hierarchical Clustering Analysis
After generating the n X p matrix of MA probability maps, we employed a pairwise correlation analysis in which correlation coefficients were calculated for each n experiment compared to every other n experiment, to assess similarity of spatial topography across MA maps. Hence, the n X p array of MA maps was transformed into an n X n correlation matrix that captured the similarity of whole-brain modeled activation images across face discrimination experiments (Figure 1, Step 2). Experiments within the n X n correlation matrix were subsequently grouped into clusters using hierarchical clustering analysis, an agglomerative unsupervised classifier (Figure 1, Step 3). Previous implementation of correlation matrix based hierarchical clustering of resting state fMRI data (Liu et al., 2012; Keilholz et al., 2010) and hierarchical clustering of BrainMap-based meta-analytic images (Laird et al., 2011b) demonstrated optimal clustering using the average linkage algorithm and 1 – r as the distance between clusters, where r is the Pearson’s correlation coefficient. Following initial testing for optimal performance, these parameters were adopted in the present study. Notably, Pearson’s correlation distance maximizes the effects of direction, rather than magnitude, of the two observational vectors, thus identifying correlated MA maps as being topologically similar and anti-correlated MA maps as dissimilar.
The resultant dendrogram was examined to identify sets of experiments that clustered together. Selecting a clustering solution yielding an optimal parcellation of BrainMap experiments relied on two measures. The cophenetic distance between clusters at a specific model order (i.e., number of clusters) describes the dissimilarity between sub-clusters, and is intrinsically higher at low model orders (e.g., a two-cluster solution). Importantly, the relative difference in cophenetic distances when transitioning from model order x to the next highest model order x+1 can be informative when examining if cluster separation results in vastly different solutions. Therefore, we sought to determine the extent to which increasing model order resulted in substantially different activation patterns respective to each cluster by maximizing the relative difference, dc, in cophenetic distances cx and cx+1, as model order, x, increased:
| (Eqn. 1) |
Related to the above measure of difference in cophenetic distances is the impact that increasing model order has on separating clusters into sub-clusters of proportionate number of variables (e.g., experiments). Increasing the cluster solution could potentially yield a segregation of experiments in which one sub-cluster dominates with a disproportionately large number of experiments. Therefore, we sought to minimize the effect of cluster segregation by calculating the maximum density of experiment separation. Essentially, we aimed to determine if increasing model order resulted in a disproportionate divergence of experiments. For example, if cluster i0, consisted of n0 experiments at model order x, and separated into clusters i1 and i2, with n1 and n2 experiments, respectively, then the density of experiment separation, ds is calculated as:
| (Eqn. 2) |
Thus, to achieve an optimal clustering solution of BrainMap experiments, the impact of parcellating clusters with increasing model order was assessed by both the relative difference in cophenetic distances and the experiment separation density.
ALE Meta-Analysis of Clustered Experiments
After selecting an optimal clustering solution, we investigated the underlying spatial features of the groups of experiments deemed similar in terms of their convergent activation patterns. Meta-analysis of the per-cluster set of experimental MA-maps was performed using the activation likelihood estimation (ALE) method (Turkeltaub et al., 2002; Laird et al., 2005b) (Figure 1, Step 4). Similar to the generation of the MA maps, ALE models the stereotaxic coordinates for each experiment as spherical Gaussian probability distributions. Using BrainMap GingerALE (version 2.3), an extended ALE algorithm was implemented that accounts for between-subject variability and between-template variance due to differences in spatial normalization methods across publications (Eickhoff et al., 2009), as well as eliminates within-experiment effects (Turkeltaub et al., 2012). Voxel-wise ALE scores were computed as the union of the probability distributions, which provide a quantitative representation of convergent brain activation patterns; statistical significance was assessed by analytically deriving the null distribution of random spatial association between experiments (Eickhoff et al., 2012). ALE maps for each cluster of the dendrogram were thresholded at P<0.05 (cluster-level family-wise error rate (FWER) corrected for multiple comparisons; cluster-forming threshold P<0.001 at the voxel-level; Woo et al., 2014).
Functional Decoding of Paradigm Clusters
Once the convergent spatial activation patterns were identified for each cluster, we examined the experimental design of the contributing tasks to determine which task features (e.g., stimulus, response, or instructions) led to the observation of similar activation patterns. That is, for a dendrogram yielding n clusters of activation patterns, we evaluated the behavioral tasks utilized in the experiments grouped together in cluster #1, the tasks in cluster #2, and so on for all n clusters. To this end, the associated metadata of the contributing experiments were analyzed to determine the combinations of stimulus, response, and instructions that were most likely to contribute to the observed clustering of activation patterns. Forward and reverse inference analyses (Poldrack, 2006; Yarkoni et al., 2011) were performed on the distributions of metadata fields for each cluster of experiments to determine over-representation compared to the entire BrainMap database (Cieslik et al., 2013; Nickl-Jockschat et al., In Press). Forward inference is the probability of observing activity in a brain region given knowledge of the psychological process, whereas reverse inference is the likelihood that a given metadata term resulted in an activation in the experiments within a cluster. In the forward inference approach, we tested whether the conditional probability of activation given a particular label [P(Activation|Task)] was higher than the baseline probability of activating the region in question per se [P(Activation)]. Significance was established using a binomial test (P < 0.05, corrected for multiple comparisons using Bonferroni’s method), which was appropriate since our goal was to compare the observed distribution to the expected distribution given only two categories (i.e., frequency of term within a cluster and across the entire database). In the reverse inference approach, we identified the most likely metadata term (e.g., behavioral domain) given activation in a particular cluster. This likelihood P(Task|Activation) can be derived from P(Activation|Task) as well as P(Task) and P(Activation) using Bayes rule. Significance (at P < 0.05, corrected for multiple comparisons using Bonferroni’s method) was then assessed by means of a chi-squared test. Tested metadata fields included the behavioral domain, stimulus type, response type, and instructions. In addition, the field of paradigm class was also analyzed; however, it was expected that every cluster would return a significant paradigm of “Face Monitor/Discrimination”, given that this was the field chosen for the initial BrainMap query. However, this field was still deemed potentially informative since studies can be annotated with multiple paradigm classes, when relevant.
RESULTS
Search of the BrainMap database for experiments meeting the criteria of paradigm class of “Face Monitor/Discrimination” in healthy individuals yielded 379 experiments, which included results reported across 2,917 brain locations in 4,945 participants. A complete listing of these experiments, along with the corresponding Sleuth workspace file, can be accessed in the Supplementary Materials. MA probability maps were generated for each of the 379 experiments, and a spatial correlation analysis was performed to compare the topography of each pair of experiments, thereby assessing the similarity of whole-brain modeled activation images across face discrimination experiments.
Correlation Matrix Based Hierarchical Clustering Analysis
Hierarchical clustering was performed on the 379 x 379 correlation matrix, yielding a complex dendrogram. The optimal clustering solution of “Face Monitor or Discrimination” experiments was identified by observing the impact of parcellating clusters with increasing model order through both the experiment separation density and relative change in cophenetic distances. We aimed to achieve a robust solution for characterizing the groupings of experiments in our data; here, we describe results for solutions between 3 and 10 clusters. While the metrics pertaining to higher cluster solutions were also examined, these fell well short of the optimal solution we aimed to achieve.
To achieve an clustering solution that optimally parcellated across different groups of experimental activation patterns, the relative difference in cophenetic distances and the experiment separation density were calculated as a function of increasing model order. Peak values for the relative difference in cophenetic distances were observed for solutions of 4, 6, and 8 clusters (Figure 2, blue), indicating model orders of activation patterns with substantially different topological characteristics. The second cluster criterion examined was the experiment separation density. The goal for this measure was to avoid solutions that segregated a single cluster into sub-clusters of disproportionate experiment density. Cluster solutions resulting in a decrease in experiment separation density from one model or to the next were observed for 4, 6, 7, and 10 clusters (Figure 2, red). Based on convergence of both metrics, clustering solutions of 4 and 6 were considered as candidate clustering solutions; these solutions agreed with visual inspection of the dendrogram. Ultimately, the 6-cluster solution was identified as the optimal solution due to the substantially larger relative difference in cophenetic distances compared to the 4-cluster solution.
Figure 2. Cluster Criteria.
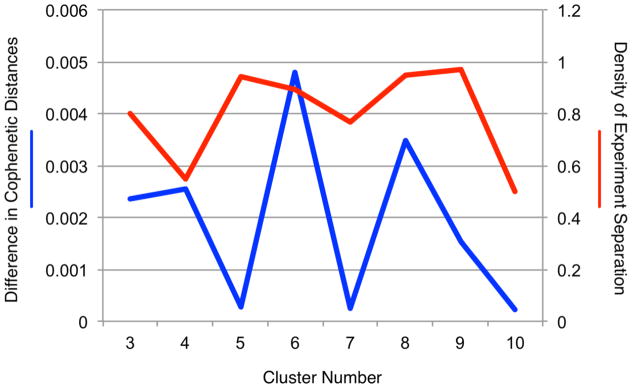
The difference in cophenetic distances (blue) and density of experiment separation (red) are plotted as a function of candidate model orders. Peaks in the difference in cophenetic distances indicate that the corresponding clustering solution results in clusters with substantially different activation patterns than the model order below it. Decreases in density of experiment separation indicate a given solution yields clusters of non-trivial size, providing robustly different activation patterns. Convergence across both metrics was observed for a solution of 6 clusters.
Any clusters with less than 19 experiments (<5% of the dataset) were deemed as outlying data and excluded from further analysis. The small clusters on the far left and right of the dendrogram fell into this criterion (seen in white) with thirteen and two experiments, respectively, and were subsequently discarded. The cophenetic distances indicated that these clusters were quite different from the other clusters, further providing support for their omission. Four final clusters remained suitable for further analyzed: Cluster 1 (blue; 111 experiments), Cluster 2 (pink; 151 experiments), Cluster 3 (green; 68 experiments), and Cluster 4 (red; 34 experiments) (Figure 3).
Figure 3. Hierarchical Clustering of MA Maps.

Results of the hierarchical clustering analysis of face studies yielded a 4-cluster solution, as depicted via a dendrogram plot. Cluster 1 (blue) was comprised of 111 experiments, Cluster 2 (purple) = 151 experiments, Cluster 3 (green) = 68 experiments, Cluster 4 (red) = 34 experiments. Due to small representation (i.e., less than 5% of total number of experiments), clusters of size 13 and 2 (white) were omitted from further analysis.
ALE Meta-Analysis of Clustered Experiments
Coordinates of activation reported across each of the four clusters were separately meta-analyzed using the ALE approach (Eickhoff et al., 2012; Turkeltaub et al., 2002) to generate four maps illustrating the locations of convergent activations (P > 0.05; cluster-level FWE-corrected for multiple comparisons; cluster-forming threshold P < 0.001 at the voxel-level). As shown in Figure 4, the ALE meta-analysis map for Cluster 1 included significant areas of convergence in the anterior cingulate cortex, bilateral insula, precentral gyrus, premotor cortex and (pre-) supplementary motor area, lateral inferior frontal gyrus, dorsolateral prefrontal cortex (DLPFC), putamen, and left superior temporal sulcus. The Cluster 2 map indicated significant convergence in the bilateral fusiform gyrus, extrastriate cortex, superior and middle temporal cortex, lingual gyrus, amygdala, DLPFC, and cerebellum. Significant convergence was observed in Cluster 3 in the ventromedial prefrontal cortex, posterior cingulate cortex and precuneus, and right amygdala and corpus striatum. Lastly, Cluster 4 included significant convergence within the bilateral middle temporal gyrus and inferotemporal cortex, temporal pole, left superior temporal sulcus, parahippocampal gyrus, and inferior and superior frontal gyrus.
Figure 4. ALE Meta-Analysis of Experimental Clusters.
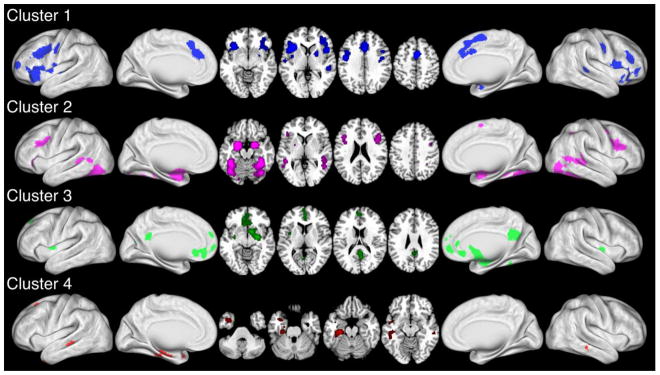
ALE meta-analysis results of experiments comprising each dendrogram cluster are shown for the left hemisphere (lateral and medial), axial slices, and right hemisphere (medial and lateral). ALE images were thresholded at P<0.05 (cluster-level FWE corrected for multiple comparisons; cluster-forming threshold P<0.001 at the voxel-level).
Functional Decoding of Paradigm Clusters
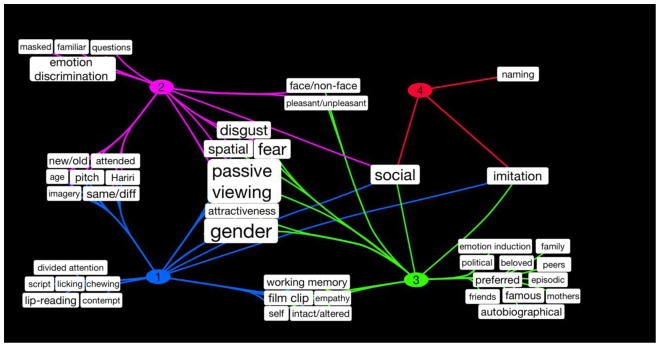
The clustering results indicated four robust groupings of experiments with similar within-cluster and different across-cluster spatial topographies. Forward and reverse inference analyses were performed on five different metadata fields of the BrainMap coding scheme: behavioral domain, paradigm class, stimulus type, response type, and instructions, to determine which metadata classes within each field exhibited an over-representation in each cluster’s experiment set compared to the distribution across experiments in the entire BrainMap database. The number of metadata classes within each field varied from 18 (response types) to 95 (paradigms), with a total of 258 classes investigated across all fields. Forward and reverse inference analyses indicated 14, 14, 10, and 8 significant classes within Clusters 1, 2, 3, and 4, respectively. Figure 5 illustrates the significant metadata BrainMap classes for each cluster, with pathways that connect one or more clusters indicating specific terms that were significantly associated with multiple clusters. For example, the stimulus type of “Faces” and the paradigm class of “Face Monitor/Discrimination” were associated with all clusters as predicted, whereas the instruction of “Discriminate” related only to Clusters 2 and 4. Notably, all clusters except Cluster 4 indicated significant association with several behavioral domain terms associated with emotional and visual processing, as shown in the center of Figure 5. Visualization of these metadata results was achieved using Cytoscape version 3.1.1 (Shannon et al., 2003).
Figure 5. Significant BrainMap Metadata Fields for Each Cluster.

Forward and reverse inference analyses were performed to identify significant BrainMap metadata for each cluster. The network of significant classes is visualized using Cytoscape (Shannon et al., 2003). Here, pathways that connect one or more clusters indicate specific terms that were significantly associated with multiple clusters.
The metadata in Figure 5 depict the standardized BrainMap terms that corresponded to each cluster; however, the results generated by the forward and reverse inference analyses lacked a sufficient level of detail needed to fully understand the subtle variations as to how experimental designs varied across clusters. Thus, we manually evaluated each experiment comprising a cluster by reviewing its experimental design, with emphasis on identifying key terms distinguishing task types. For example, a set of instructions across four different tasks may all be coded in BrainMap with the same instruction of “Discriminate”, while manual evaluation clarifies the differential nature of the instructed discriminations: (1) “Subjects performed a gender discrimination and indicated whether the presented face was male or female”, (2) “Subjects indicated the color presented behind the face”, (3) “Subjects determined if the two faces were the same or different”, or (4) “Subjects indicated which face they preferred”. For these example tasks, manually extracted terms included “gender”, “color”, “same/different”, and “preferred”, respectively. Using these salient terms identified during manual evaluation of clusters, we generated a secondary Cytoscape visualization of the complex relations between the combinations of task stimulus, response, and instructions and the newly classified brain activation patterns (Figure 6).
Figure 6. Enhanced Terms for Metadata Characterization.
Category assignments based on the rule set were generated for the original set of face experiments in BrainMap. A novel set of non-BrainMap, non-CogPO terms were derived to annotate each experiment with the specific rule that was applied in each instance. These terms were pooled within the clusters of experiments to visualize experimental trends, resulting in a clear summary picture of the distribution of face tasks across sub-classes.
The combined knowledge gained from both the BrainMap-based forward and reverse inference analyses and the manual inspection and identification of salient terms enabled a clear picture to emerge. Below is a summary of the four clusters across face tasks:
Cluster 1 resulted in convergent activation patterns predominantly localized to the salience network (Seeley et al., 2007), including bilateral anterior insula and anterior cingulate cortices. BrainMap metadata convergence indicated significance correspondence in the forward and reverse analyses within the behavioral domains of “Emotion” and “Cognition.Soma” and the paradigm class of “Film Viewing”. Manual review of experimental design trends indicated that this cluster broadly focused on tasks that engage integrative processing across action, vision, and cognitive control, including spatial or location discrimination, working memory (e.g., Sternberg or n-back tasks involving face stimuli), or facial emotion imitation. Film clips or videos were presented while participants observed and/or performed dynamic movements (e.g., chewing, licking, etc.) or lip-reading (cross-represented in Cluster 4). Cluster 1 also encompassed experiments involving passive viewing of static or dynamic faces in which no discrimination was required. Lastly, Cluster 1 included experiments combining visual face presentation with auditory stimuli in which participants were required to perform pitch discrimination (e.g., discriminate gender of voice). Overall, the cluster consensus indicated that this diverse cluster was associated with Visuospatial Attention and Visuomotor Coordination to Faces.
Cluster 2 resulted in convergent activation patterns in bilateral amygdala, fusiform face area, and other occipito-temporal areas. BrainMap metadata convergence indicated significance correspondence in the forward and reverse analyses within the behavioral domain of “Perception.Vision.Shape”, and the paradigm class of “Classical Conditioning”. Manual review of experimental design trends indicated that this cluster broadly focused on tasks involving active visual discrimination of faces, including emotional discrimination (e.g., intensity or valence discrimination, emotion matching, the Hariri task (Hariri et al., 2000), same/different discrimination), face/object discrimination, gender discrimination, memory tasks in which stimuli were encoded in a separate scan (unfamiliar vs. familiar, old/new), attending to one stimulus among multiple or divided attention, classical conditioning, and visual imagery. Overall, the cluster consensus indicated that this network was associated with Perception and Recognition of Faces.
Cluster 3 was dominated by convergent activation in the default mode network (Raichle et al., 2001; Laird et al., 2009), including the medial prefrontal and posterior cingulate cortices. BrainMap metadata convergence indicated significance correspondence in the forward and reverse analyses within the behavioral domain of “Cognition.Attention” and the paradigm class of “Episodic Recall”. Manual review of experimental design trends indicated that this cluster broadly focused on tasks involving emotion induction, in which emotional faces were presented to participants with instructions to recall their own autobiographical memories associated with the presented emotion. Other tasks included discrimination of famous vs. unfamiliar faces, discrimination as to facial attractiveness, pleasant/unpleasant, or other subjective qualities, discriminations based on personal relationships (e.g., friends, mothers, children, peers, family, beloved), and tasks involving participants predicting an emotional response based on the presented facial stimuli. Overall, the cluster consensus indicated that this network was associated with Social Processing and Episodic Recall of Faces.
Cluster 4 resulted in convergent activation patterns in the inferior middle temporal and parahippocampus gyri, although the convergence observed in this cluster was neither as robust nor as widespread compared to the other clusters. BrainMap metadata convergence indicated significant correspondence in the forward and reverse analyses within the behavioral domain of “Cognition.Language.Speech” and the paradigm class of “Overt Naming”. Manual review of experimental design trends indicated that this cluster was comparatively more narrow in focus, and primarily involved naming of faces, semantic memory, face recognition, and lip-reading (the latter being cross-represented with Cluster 1). Overall, the cluster consensus indicated that this network was associated with Face Naming and Lexical Retrieval.
DISCUSSION
To address the need for improved semantic representation of cognitive paradigms in neuroimaging studies, we developed an evidence-based cognitive neuroinformatics approach using face perception as a proof-of-concept application. Rather than subjectively generate a list of sub-classes to increase the existing classification granularity of face tasks, we systematically identified clusters of brain activation patterns and summary terms driving the segregation across these clusters. Our study was operationalized under the premise that tasks activating similar brain networks should be grouped as functionally similar in a given cognitive schema, while tasks demonstrating differential activation patterns should be classified as functionally distinct. We identified four sub-classes of face tasks: (1) Visuospatial Attention and Visuomotor Coordination to Faces, (2) Perception and Recognition of Faces, (3) Social Processing and Episodic Recall of Faces, and (4) Face Naming and Lexical Retrieval. Importantly, the methodological objectivity of our approach comes from the task groupings, which were derived from the modeled activation patterns and not from the metadata descriptors. Currently, there is no formal classification schema for mental tasks in the face perception literature; therefore, the present results demonstrating a robust four-part grouping are a new finding within this domain. More broadly, this work also demonstrates how data mining techniques can facilitate terminological refinement, thereby supporting continued development and expansion of neuroinformatics resources and tools.
Distributed Networks for Neural Representation of Faces
When perceiving faces, the standard prediction assumes activation of the fusiform face area (Sergent et al., 1992; Haxby et al., 1994; Kanwisher et al., 1997). However, our approach was to move beyond this single node to an expanded focus on multiple, distributed functional networks of regions that are differentially engaged by face task requirements (Ishai et al., 2005). Observed convergence in Cluster 1 across dorsal anterior cingulate and orbital frontoinsular cortices suggests a strong role in salience processing (Seeley et al., 2007) to detect and evaluate facial stimuli (Menon and Uddin, 2010; De Martino et al., 2009) in terms of external relevance to one’s self (Ramasubbu et al., 2011) and anticipated outcomes (Nahum et al., 2011), resulting in the mediation of cognitive-affective interactions (Luo et al., 2014). Facial processing of salient features includes not only analysis of a presented face, but also analysis of the emotional expression, gaze, and visuospatial motion, particularly speech-related lip movements (Bruce and Young, 1986). In addition to regions associated with the salience network, Cluster 1 included convergence in sensorimotor and premotor areas, driven by tasks associated with facial imitation and movement execution; lateral prefrontal cortex, explained by an association with cognitively demanding tasks (e.g., facial n-back task; Bzdok et al., 2012; Luo et al., 2014); and the superior temporal sulcus, which has been linked to assessment of gaze (Hoffman and Haxby, 2000; Grosbras et al., 2005), perceiving speech and non-speech mouth movements (Calvert et al., 1997; Puce et al., 1998; Rolls, 2007), and voice discrimination (Belin et al., 2000; Shah et al., 2001). Overall, Cluster 1 presented as the most heterogeneous grouping of tasks and appeared to represent a conflation across attention (Fox et al., 2005) and visuomotor responses to faces. We interpret the latter as extending somewhat beyond the neural substrates of face perception per se to involve task demands in which the visual face stimulus is a cue to execute a task requiring a visuomotor (e.g., lip-reading) or cognitive response (e.g., n-back).
In contrast to Cluster 1, Clusters 2, 3, and 4 all presented as moderately homogeneous experimental groupings. Cluster 2 corresponded to the canonical face perception network, most notably including activation of the bilateral fusiform face area in the lateral fusiform gyrus (Sergent et al., 1992; Haxby et al., 1994; 1999; Clark et al., 1996; Kanwisher et al., 1997; McCarthy et al., 1997; Halgren et al., 1999; Ishai et al., 1999; Hoffman and Haxby, 2000). Cluster 2 was associated with visual analysis of faces, and included known face-responsive regions in visual extrastriate cortex (beyond the fusiform face area) in the lateral inferior occipital gyri and the superior temporal sulcus (Halgren et al., 1999; Haxby et al., 1999; Hoffman and Haxby, 2000; Kanwisher et al., 1997; Puce et al., 1998). Cluster 3 strongly corresponded to tasks involving biographical episodic memory retrieval and social processing, giving rise to recruitment of the default mode network, including medial prefrontal, precuneus, posterior cingulate cortex, and amygdala (Spreng et al., 2009; Martinelli et al., 2013; Bzdok et al., 2012). Notably, it has previously been shown in a large-scale meta-analysis that regions of the default mode network exhibit increased activation in the context of certain cognitive tasks, such as those involved during social cognition or autobiographical memory (Laird et al., 2009). The distributed network revealed by this cluster has been associated with recognition of familiar faces, specifically famous faces (Leveroni et al., 2000; Gorno Tempini et al, 1998), faces personally known to the participants (Shah et al., 2001), and faces of one’s own children (Ramasubbu et al., 2007). Cluster 3 was also complemented by the striatum, which is known to play a role during social evaluation and decision-making (Kampe et al., 2001; Simon et al., 2014), particularly for valuation-based decisions (Ho et al., 2012). Cluster 4 included the least heterogeneous grouping and was primarily dominated by experiments involving face naming. Recollection of semantic knowledge of famous faces is known to recruit middle temporal cortex, especially the anterior middle temporal gyrus (Gorno Tempini et al., 1998; Brambati et al., 2010). Cluster 4 demonstrated correspondence to lexical knowledge and retrieval, relying on temporal pole, inferotemporal cortex, and middle temporal gyrus (Damasio et al., 1996; Price et al., 2005).
Although the clustering analysis was designed to identify dissociable co-activation patterns, we observed several nodes that were common across clusters. Clusters 2 and 3 revealed common recruitment of the temporoparietal junction, strengthening support for its role linking competing networks for external and internal information processing (Bzdok et al., 2013; Krall et al., In Press). Clusters 1 and 4 revealed convergence in Broca’s area, likely due to common recruitment across lip reading (Paulesu et al., 2003) and lexical retrieval (Damasio et al., 1996). Clusters 1 and 2 both recruited the DLPFC, which aligns with evidence indicating its involvement with perceptual decision-making (Druzgal and D’Esposito, 2001; Heekeren et al., 2006; Cieslik et al., 2013). Clusters 1 and 3 demonstrated overlap in the left posterior insula (Menon and Uddin, 2010). The anterior and posterior insula are known to have different functional and connectional profiles (Taylor et al., 2009; Kurth et al., 2010; Deen et al., 2011; Cauda et al., 2011; 2012); current evidence suggests that the anterior and posterior insula may be recruited during salience processing, whereas the posterior insula and posterior cingulate/precuneus during default mode processing. Thus, the present results suggest that the autonomic arousal role of the posterior insula (Craig, 2002; 2009; Taylor et al., 2009) may involve evaluation of environmental awareness during both salience processing and default mode processing. Lastly, the amygdala was common to Clusters 1, 2, and 3, and the high convergence of this region across face tasks suggests involvement in processing above and beyond emotional expressions (Breiter et al., 1996; Morris et al., 1996; Phillips et al., 1998; Hariri et al., 2000; Bzdok et al., 2011; Shi et al., 2013). Although the superior temporal sulcus was observed across multiple clusters, no topological overlap was observed. Notably, no region was observed across all four clusters.
An Integrated Model of Face Perception
A human’s ability to perceive, recognize, and respond appropriately to faces requires a highly developed range of complex perceptual, cognitive, and emotional processes (Bruce and Young, 1986; Burton et al., 1990), necessitating recruitment across a widely distributed neural network. A previous ALE meta-analysis of explicit and implicit emotional processing of faces identified convergence in visual, limbic, temporoparietal, prefrontal, and subcortical areas, independent of emotional valence (Fusar-Poli et al., 2009). Their face processing network demonstrated strong correspondence to the collective networks observed in the present study, but did not differentiate between varying processing components supporting face perception. In contrast, the hierarchical classification scheme proposed here bears strong similarities to the model of distributed neural systems first proposed by Haxby et al. (2002) and updated by Gobbini and Haxby (2007). This face perception model includes a core system for the visual analysis of faces in the inferior occipital gyrus, lateral fusiform gyrus, and posterior superior temporal sulcus. Also included is an extended system for personal knowledge of faces (i.e., representation of one’s relationship with the presented person, biographical information, and theory of mind processing) in the medial prefrontal, anterior temporal, and posterior cingulate cortices and temporoparietal junction, as well as for emotional response to faces in the amygdala, insula, and striatum. A recent study examined hierarchical clustering of functional connectivity patterns during execution of a face perception task. The identified nodes in their network-level analyses closely matched the brain regions derived from the present BrainMap data, as did the network structure, which differentiated between the temporo-occipital, medial fronto-parietal, and lateral fronto-parietal sub-networks (Zhen et al., 2013). This correspondence is notable, given that their proposed model of systems for facial identification, semantic retrieval, and expression analysis was limited to perception of novel faces with neutral expressions.
With respect to an integrated model of face perception, our results support the neural framework of a core plus extended systems. Here, Cluster 2 represents the core system for visual analysis of faces, while Cluster 3 corresponds to the extended system for personal knowledge, with Cluster 4 representing related lexical retrieval of face names. However, although affective processing is clearly a major component of the face perception model, a separate extended system for emotion was not observed in the present study. Rather, neural substrates underlying emotional responses were found to extend across multiple clusters. Clusters 1, 2, and 3 included varying convergence of activation in the amygdala, insula, and other limbic areas relevant to analysis of the emotional content of faces (Ishai et al., 2005; Gobbini and Haxby, 2007; Schulz et al., 2009; Bzdok et al., 2012). This result is not surprising given that many of the tasks involved visual presentation of emotional faces, and indeed, the Cytoscape representations of BrainMap fixed text terms (Figure 5) demonstrated correspondence between emotional terms and the first three clusters. Thus, we attribute the lack of an observed separate system for emotional responses to both the unique nature of our meta-analytic approach and the resultant coupling of emotional face presentation across numerous tasks. Moreover, while some research has focused on isolating regionally specific emotional states (e.g., sadness, happiness, anger; Fusar-Poli et al., 2009), we observed no major trends across clusters driven by different emotions, although we cannot rule out subtle emotion-dependent modulations of activation (Breiter et al., 1996) or deactivation (Sreenivas et al., 2012) since by nature coordinate-based meta-analysis results do not permit detailed analysis of the BOLD time series.
Beyond these original components of the Gobbini and Haxby model (Gobbini and Haxby, 2007), our results suggest an additional extended system related to attentional processing to determine the salience of presented faces, as indicated by Cluster 1. Overall, we propose an amendment of the Gobbini and Haxby (2007) model of face perception that includes a core visual system, and three extended systems for personal knowledge, emotion, and salience. Critically, we note that core and extended systems rely on the principle of functional integration in that no system operates independently but instead demonstrates varying degrees of relative recruitment strength based on changing task demands. What we have shown is that different systems in the collective network demonstrate functional specialization, with each performing a distinct aspect of processing and responding to face stimuli. We conclude that any given task implemented in the scanner, with its unique combination of stimulus, response, and instructions, may preferentially recruit across these networks, depending on whether processes associated with visual analysis, salience, personal knowledge, or emotion are actively engaged.
Methodological Issues and Limitations
There are several factors that potentially limit the results of the current study. With respect to the clustering method, a range of parameters exist that must be selected prior to analysis during any exploratory data mining approach (Pedrycz, 2005), which can somewhat limit any resultant conclusion. Hierarchical clustering involves selection of both a distance measure and a linkage algorithm; our results relied on clustering using the Pearson’s correlation as the distance measure and the average linkage algorithm. During our preliminary analysis, we evaluated several other distances (e.g., Spearman’s correlation, Hamming, Jaccard, Euclidean, Manhattan) and linkages (e.g., average, complete, single, and weighted) for comparative purposes. Across these, we determined that the Pearson’s and Spearman’s correlations provided reasonable distances and found precedence for their use (Laird et al., 2011b; Liu et al., 2012; Keilholz et al., 2010). In the case of the Spearman’s correlation, a ranked-value approach is used to calculate correlation coefficients and inherently provides more weight to those voxels shared between modeled activation images. Conversely, the Pearson’s approach maximizes the difference between spatial patterns in modeled activation images. While the results across these two distance metrics were largely similar, the Spearman’s correlation resulted in two additional clusters (subsets of Clusters 1 and 3). These additional sub-clusters did not yield dissimilar activation patterns from their parent networks, but rather included many of the same topological features. Furthermore, evaluation of the significant metadata indicated that many of the significant metadata terms were shared. Together, this suggests that no valuable information was gained by choosing the Spearman’s correlation over the Pearson’s correlation; thus, the Pearson’s approach was selected. Similarly, results utilizing different linkage algorithms were examined. The single and complete linkages yielded strongly cascading dendrograms, with little informational value. The average linkage was ultimately selected because of its high cophenetic correlation coefficient (high degree of similarity between cophenetic and pairwise distances) and corresponding clustering structure relative to the other three methods.
Selection of a clustering solution is another analytic stage requiring optimal parameterization and in some cases necessitates utilization of multiple information criteria (Kelly et al., 2010; Chang et al., 2012; Clos et al., 2013). Here, our ultimate goal was to identify a subset of classes for taxonomic and ontological purposes. Thus, we were predisposed towards simple solutions yielding 3–6 clusters, as opposed to solutions yielding more than 10 clusters, as this would have been a considerable number from a semantic representation perspective. Thus, our approach in using experimental separation density and cophenetic distances was more simplistic than what has been implemented in prior studies, but yielded robust results of the dimension we intended to target. However, we note that further decomposition into an ensuing level of classification is possible by additional investigation of the dendrogram structure to yield increased granularity and precision when defining cognitive paradigms.
Ontological Expansion
This study was motivated by a need for new strategies for developing a paradigm classification schema. Although ontological development is often characterized as a somewhat esoteric branch of biomedical research, the fundamental rationale behind this field is to develop improved methods for how scientific work is reported, discussed, and mined. In their seminal work, Bruce and Young (1986) stated their goal was to develop “a set of terms for understanding and discussing for how we recognize familiar faces, and the relationship between recognition and other aspects of face processing”. Here, our goal was to advance this ontological emphasis a step further and enhance the formal schema delineating variations of face processing tasks. The Cognitive Paradigm Ontology (CogPO) is a domain ontology of cognitive paradigms utilized in functional neuroimaging experiments (Turner and Laird, 2012). CogPO was originally developed using paradigm terms from the BrainMap taxonomy, but has since been expanded to include other paradigms, such as those also represented by the Cognitive Atlas (Poldrack et al., 2011). Although CogPO terms have been useful in providing functional interpretation of intrinsic connectivity networks (Laird et al., 2011b) and in automated multi-label annotation and classification of neuroimaging experiments (Turner et al., 2013), some of the included paradigm classes are fairly coarse and require decomposition into sub-classes. We observed that functional interpretation of the clusters in the present study was limited when utilizing existing BrainMap terms already represented in CogPO. To obtain a higher degree of clarity, manual review of experiments allowed the derivation of more salient terms and enhanced our overall results. Importantly, we note that the results presented here add depth and granularity to the CogPO ontology, as well as to the BrainMap taxonomy. However, this approach represents a semi-automated, not fully automated approach. While hierarchical clustering provided an objective and efficient means to aggregate experimental results into distinct groups, manual review required a moderate amount of labor. Future work will involve evaluation of text mining algorithms to develop a more automated approach for identifying and extracting key terms to enable functional decoding of experimental groupings.
Conclusions
We investigated the feasibility of an objective and evidence-based approach for identification of paradigm sub-classes used across the functional neuroimaging literature in the domain of face perception. The aim of our study was to highlight the variability in tasks and classify them into distinct groupings based on modeled activation patterns rather than task descriptions. We concluded four subclasses of face tasks: (1) Visuospatial Attention and Visuomotor Coordination to Faces, (2) Perception and Recognition of Faces, (3) Social Processing and Episodic Recall of Faces, and (4) Face Naming and Lexical Retrieval. Interpretation of these results supports an amendment of the distributed model of face perception proposed by Gobbini and Haxby (2007) to include a core system for visual analysis and extended systems for personal information, emotion, and salience processing. More broadly, our results demonstrate that large-scale meta-analysis of the BrainMap database allows theoretical mental models to be tested by probing the range of behavioral manipulations across tasks. In this way, neuroimaging meta-analysis and data mining are able to establish a link between theory and experimentalism to a degree that is more powerful than what can be accomplished with results achieved in a single empirical study. Our results demonstrate that the range of tasks involving presentation of human faces is complex, and the underlying neural architecture that collectively supports the execution of these tasks is similarly broad and diverse.
Supplementary Material
Acknowledgments
This study was supported by awards from the National Institute of Mental Health (R01-MH084812, R01-MH074457, and R56-MH097870) and the National Institute of Drug Abuse (K01-DA037819).
Footnotes
Publisher's Disclaimer: This is a PDF file of an unedited manuscript that has been accepted for publication. As a service to our customers we are providing this early version of the manuscript. The manuscript will undergo copyediting, typesetting, and review of the resulting proof before it is published in its final citable form. Please note that during the production process errors may be discovered which could affect the content, and all legal disclaimers that apply to the journal pertain.
References
- Belin P, Zatorre RJ, Lafaille P, Ahad P, Pike B. Voice-selective areas in human auditory cortex. Nature. 2000;403:309–312. doi: 10.1038/35002078. [DOI] [PubMed] [Google Scholar]
- Brain Research through Advancing Innovative Neurotechnologies (BRAIN) Working Group. BRAIN 2025: A Scientific Vision. Report to the Advisory Committee to the Director, NIH. 2014 Jun 4; http://www.nih.gov/science/brain/2025/BRAIN2025.pdf.
- Brambati SM, Benoit S, Monetta L, Belleville S, Joubert S. The role of the left anterior temporal lobe in the semantic processing of famous faces. Neuroimage. 2010;53:674–681. doi: 10.1016/j.neuroimage.2010.06.045. [DOI] [PubMed] [Google Scholar]
- Breiter HC, Etcoff NL, Whalen PJ, Kennedy WA, Rauch SL. Response and habituation of the human amygdala during visual processing of facial express. Neuron. 1996;17:875–887. doi: 10.1016/s0896-6273(00)80219-6. [DOI] [PubMed] [Google Scholar]
- Brett M, Christoff K, Cusack R, Lancaster J. Using the Talairach atlas with the MNI template. Neuroimage. 2001;13:S85. [Google Scholar]
- Bruce V, Young A. Understanding face recognition. Br J Psychol. 1986;77:305–327. doi: 10.1111/j.2044-8295.1986.tb02199.x. [DOI] [PubMed] [Google Scholar]
- Burton AM, Bruce V, Johnston RA. Understanding face recognition with an interactive activation model. Br J Psychol. 1990;81:361–380. doi: 10.1111/j.2044-8295.1990.tb02367.x. [DOI] [PubMed] [Google Scholar]
- Bzdok D, Langer R, Caspers S, Kurth F, Habel U, Zilles K, Laird A, Eickhoff SB. ALE meta-analysis on facial judgements of trustworthiness and attractiveness. Brain Struct Funct. 2011;215:209–223. doi: 10.1007/s00429-010-0287-4. [DOI] [PMC free article] [PubMed] [Google Scholar]
- Bzdok D, Langner R, Hoffstaedter F, Turetsky BI, Zilles K, Eickhoff SB. The modular neuroarchitecture of social judgements on faces. Cereb Cortex. 2012;22:951–961. doi: 10.1093/cercor/bhr166. [DOI] [PMC free article] [PubMed] [Google Scholar]
- Bzdok D, Langner R, Schilbach L, Jakobs O, Roski C, Caspers S, Laird AR, Fox PT, Zilles K, Eickhoff SB. Characterization of the temporo-parietal junction by combining data-driven parcellation, complementary connectivity analyses, and functional decoding. Neuroimage. 2013;81:381–392. doi: 10.1016/j.neuroimage.2013.05.046. [DOI] [PMC free article] [PubMed] [Google Scholar]
- Calvert GA, Bullmore ET, Brammer MJ, Campbell R, Williams SCR, McGuire PK, Woodruff PWR, Iversen SD, David AS. Activation of auditory cortex during silent lipreading. Science. 1997;276:593–596. doi: 10.1126/science.276.5312.593. [DOI] [PubMed] [Google Scholar]
- Cauda F, D’Agata F, Sacco K, Duca S, Geminiani G, Vercelli A. Functional connectivity of the insula in the resting brain. Neuroimage. 2011;55:8–23. doi: 10.1016/j.neuroimage.2010.11.049. [DOI] [PubMed] [Google Scholar]
- Cauda F, Costa T, Torta DME, Sacco K, D’Agata F, Duca S, Geminiani G, Fox PT, Vercelli A. Meta-analytic clustering of the insular cortex: Characterizing the meta-analytic connectivity of the insula when involved in active tasks. Neuroimage. 2012;62:343–355. doi: 10.1016/j.neuroimage.2012.04.012. [DOI] [PMC free article] [PubMed] [Google Scholar]
- Chang LJ, Yarkoni T, Khaw MW, Sanfey AG. Decoding the role of the insula in human cognition: Functional parcellation and large-scale reverse inference. Cereb Cortex. 2012;23:739–749. doi: 10.1093/cercor/bhs065. [DOI] [PMC free article] [PubMed] [Google Scholar]
- Cieslik EC, Zilles K, Caspers S, Roski C, Kellerman TS, Jakobs O, Langer R, Laird AR, Fox PT, Eickhoff SB. Is there “one” DLPFC in cognitive action control? Evidence for heterogeneity from co-activation-based parcellation. Cereb Cortex. 2013;23:2677–2698. doi: 10.1093/cercor/bhs256. [DOI] [PMC free article] [PubMed] [Google Scholar]
- Clark VP, Keil K, Maisog JM, Courtney S, Ungerleider LG, Haxby JV. Functional magnetic resonance imaging of human visual cortex during face matching: A comparison with positron emission tomography. Neuroimage. 1996;4:1–15. doi: 10.1006/nimg.1996.0025. [DOI] [PubMed] [Google Scholar]
- Clos M, Amunts K, Laird AR, Fox PT, Eickhoff SB. Tackling the multifunctional nature of Broca’s region meta-analytically: Co-activation-based parcellation of area 44. Neuroimage. 2013;83:174–188. doi: 10.1016/j.neuroimage.2013.06.041. [DOI] [PMC free article] [PubMed] [Google Scholar]
- Collins DL, Neelin P, Peters TM, Evans AC. Automatic 3D intersubject registration of MR volumetric data in standardized Talairach space. J Comput Assist Tomogr. 1994;18:192–205. [PubMed] [Google Scholar]
- Craig AD. How do you feel? Interoception: The sense of the physiological condition of the body. Nat Rev Neurosci. 2002;3:655–666. doi: 10.1038/nrn894. [DOI] [PubMed] [Google Scholar]
- Craig AD. How do you feel – now? The anterior insula and human awareness. Nat Rev Neurosci. 2009;10:59–70. doi: 10.1038/nrn2555. [DOI] [PubMed] [Google Scholar]
- Damasio H, Grabowski TJ, Tranel D, Hichwa RD, Damasio AR. A neural basis for lexical retrieval. Nature. 1996;380:499–505. doi: 10.1038/380499a0. [DOI] [PubMed] [Google Scholar]
- Deen B, Pitskel NB, Pelphrey KA. Three systems of insular functional connectivity identified with cluster analysis. Cereb Cortex. 2011;21:1498–1506. doi: 10.1093/cercor/bhq186. [DOI] [PMC free article] [PubMed] [Google Scholar]
- De Martino B, Kalisch R, Rees G, Dolan RJ. Enhanced processing of threat stimuli under limited attentional resources. Cereb Cortex. 2009;19:127–133. doi: 10.1093/cercor/bhn062. [DOI] [PMC free article] [PubMed] [Google Scholar]
- Druzgal TJ, D’Esposito M. A neural network reflecting decisions about human faces. Neuron. 2001;32:947–955. doi: 10.1016/s0896-6273(01)00519-0. [DOI] [PubMed] [Google Scholar]
- Eickhoff SB, Laird AR, Grefkes C, Wang LE, Zilles K, Fox PT. Coordinate-based activation likelihood estimation meta-analysis of neuroimaging data: A random-effects approach based on empirical estimates of spatial uncertainty. Hum Brain Mapp. 2009;30:2907–2926. doi: 10.1002/hbm.20718. [DOI] [PMC free article] [PubMed] [Google Scholar]
- Eickhoff SB, Bzdok D, Laird AR, Kurth F, Fox PT. Activation likelihood estimation revisited. Neuroimage. 2012;59:2349–2361. doi: 10.1016/j.neuroimage.2011.09.017. [DOI] [PMC free article] [PubMed] [Google Scholar]
- Evans AC, Collins DL, Mills SR, Brown ED, Kelly RL, Peters TM. 3D statistical neuroanatomical models from 305 MRI volumes. Proceedings of IEEE-Nuclear Science Symposium and Medical Imaging Conference 1813–1817; 1993. [Google Scholar]
- Fox MD, Snyder AZ, Vincent JL, Corbetta M, Van Essen DC, Raichle ME. The human brain is intrinsically organized into dynamic, anticorrelated functional networks. Proc Natl Acad Sci USA. 2005;102:9673–9678. doi: 10.1073/pnas.0504136102. [DOI] [PMC free article] [PubMed] [Google Scholar]
- Fox PT, Lancaster JL. Mapping context and content: The BrainMap model. Nature Rev Neurosci. 2002;3:319–321. doi: 10.1038/nrn789. [DOI] [PubMed] [Google Scholar]
- Fox PT, Laird AR, Fox SP, Fox PM, Uecker AM, Crank M, Koenig SF, Lancaster JL. BrainMap taxonomy of experimental design: Description and evaluation. Hum Brain Mapp. 2005;25:185–198. doi: 10.1002/hbm.20141. [DOI] [PMC free article] [PubMed] [Google Scholar]
- Fusar-Poli P, Placentino A, Carletti F, Landi P, Allen P, Surguladze S, Benedetti F, Abbamonte M, Gasparotti R, Barale F, Perez J, McGuire P, Politi P. Functional atlas of emotional faces processing: a voxel-based meta-analysis of 105 functional magnetic resonance imaging studies. J Psychiatry Neurosci. 2009;34:418–432. [PMC free article] [PubMed] [Google Scholar]
- Gobbini MI, Haxby JV. Neural systems for recognition of familiar faces. Neuropsychologia. 2007;45:32–41. doi: 10.1016/j.neuropsychologia.2006.04.015. [DOI] [PubMed] [Google Scholar]
- Gorno Tempini ML, Price CJ, Josephs O, Vandenberghe R, Cappa SF, Kapur N, Frackowiak RSJ. The neural systems sustaining face and proper-name processing. Brain. 1998;121:2103–2118. doi: 10.1093/brain/121.11.2103. [DOI] [PubMed] [Google Scholar]
- Grosbras MH, Laird AR, Paus T. Cortical regions involved in eye movements, shifts of attention, and gaze perception. Hum Brain Mapp. 2005;25:140–154. doi: 10.1002/hbm.20145. [DOI] [PMC free article] [PubMed] [Google Scholar]
- Halgren E, Dale AM, Sereno MI, Tootell RBH, Marinkovic K, Rosen BR. Location of human face-selective cortex with respect to retinotopic areas. Hum Brain Mapp. 1999;7:29–37. doi: 10.1002/(SICI)1097-0193(1999)7:1<29::AID-HBM3>3.0.CO;2-R. [DOI] [PMC free article] [PubMed] [Google Scholar]
- Hariri AR, Bookheimer SY, Mazziotta JC. Modulating emotional responses: Effects of a neocortical network on the limbic system. Neuroreport. 2000;11:43–48. doi: 10.1097/00001756-200001170-00009. [DOI] [PubMed] [Google Scholar]
- Haxby JV, Horwitz B, Ungerleider LG, Maisog JM, Pietrini P, Grady CL. The functional organization of human extrastriate cortex: A PET-rCBF study of selective attention to faces and locations. J Neurosci. 1994;14:6336–6353. doi: 10.1523/JNEUROSCI.14-11-06336.1994. [DOI] [PMC free article] [PubMed] [Google Scholar]
- Haxby JV, Ungerleider LG, Clark VP, Schouten JL, Hoffman EA, Martin A. The effect of face inversion on activity in human neural systems for face and object perception. Neuron. 1999;22:189–199. doi: 10.1016/s0896-6273(00)80690-x. [DOI] [PubMed] [Google Scholar]
- Haxby JV, Hoffman EA, Gobbini MI. Human neural systems for face recognition and social communication. Biol Psychiatry. 2002;51:59–67. doi: 10.1016/s0006-3223(01)01330-0. [DOI] [PubMed] [Google Scholar]
- Heekeren HR, Marrett S, Ruff DA, Bandettini PA, Ungerleider LG. Involvement of human left dorsolateral prefrontal cortex in perceptual decision making is independent of response modality. Proc Natl Acad Sci USA. 2006;103:10023–10028. doi: 10.1073/pnas.0603949103. [DOI] [PMC free article] [PubMed] [Google Scholar]
- Ho SS, Gonzalez RD, Abelson JL, Liberzon I. Neurocircuits underlying cognition-emotion interaction in a social decision making context. Neuroimage. 2012;63:843–857. doi: 10.1016/j.neuroimage.2012.07.017. [DOI] [PubMed] [Google Scholar]
- Hoffman EA, Haxby JV. Distinct representations of eye gaze and neural identify in the distributed human neural system for face perception. Nature Neurosci. 2000;3:80–84. doi: 10.1038/71152. [DOI] [PubMed] [Google Scholar]
- Insel T, Cuthbert B, Garvey M, Heinssen R, Pine DS, Quinn K, Sanislow C, Wang P. Research domain criteria (RDoC): toward a new classification framework for research on mental disorders. Am J Psychiatry. 2010;167:748–751. doi: 10.1176/appi.ajp.2010.09091379. [DOI] [PubMed] [Google Scholar]
- Ishai A, Ungerleider LG, Martin A, Schouten JL, Haxby JV. Distributed representation of objects in the human ventral visual pathway. Proc Natl Acad Sci USA. 1999;96:9379–9384. doi: 10.1073/pnas.96.16.9379. [DOI] [PMC free article] [PubMed] [Google Scholar]
- Ishai A, Schmidt CF, Boesiger P. Face perception is mediated by a distributed cortical network. Brain Res Bull. 2005;67:87–93. doi: 10.1016/j.brainresbull.2005.05.027. [DOI] [PubMed] [Google Scholar]
- Kampe KK, Frith CD, Dolan RJ, Frith U. Reward value of attractiveness and gaze. Nature. 2001;413:589. doi: 10.1038/35098149. [DOI] [PubMed] [Google Scholar]
- Kanwisher N, McDermott J, Chun MM. The fusiform face area: A model in human extrastriate cortex specialized for face perception. J Neurosci. 1997;17:4302–4311. doi: 10.1523/JNEUROSCI.17-11-04302.1997. [DOI] [PMC free article] [PubMed] [Google Scholar]
- Keilholz SD, Magnuson M, Thompson G. Evaluation of data-driven network analysis approaches for functional connectivity MRI. Brain Struct Funct. 2010;215:129–140. doi: 10.1007/s00429-010-0276-7. [DOI] [PubMed] [Google Scholar]
- Kelly C, Uddin LQ, Shehzad Z, Margulies DS, Castellanos FX, Milham MP, Petrides M. Broca’s region: Linking human brain functional connectivity data and non- human primate tracing anatomy studies. Eur J Neurosci. 2010;32:383–398. doi: 10.1111/j.1460-9568.2010.07279.x. [DOI] [PMC free article] [PubMed] [Google Scholar]
- Krall SC, Rottschy C, Oberwelland E, Bzdok D, Fox PT, Eickhoff SB, Fink GR, Konrad K. The role of the right temporoparietal junction in attention and social interaction as revealed by ALE meta-analysis. Brain Struct Funct. doi: 10.1007/s00429-014-0803-z. In Press. [DOI] [PMC free article] [PubMed] [Google Scholar]
- Kurth F, Zilles K, Fox PT, Laird AR, Eickhoff SB. A link between the systems: Functional differentiation and integration within the human insula revealed by meta-analysis. Brain Struct Funct. 2010;214:519–534. doi: 10.1007/s00429-010-0255-z. [DOI] [PMC free article] [PubMed] [Google Scholar]
- Laird AR, Lancaster JL, Fox PT. BrainMap: The social evolution of a functional neuroimaging database. Neuroinformatics. 2005a;3:65–78. doi: 10.1385/ni:3:1:065. [DOI] [PubMed] [Google Scholar]
- Laird AR, Fox M, Price CJ, Glahn DC, Uecker AM, Lancaster JL, Turkeltaub PE, Kochunov P, Fox PT. ALE meta-analysis: Controlling the false discovery rate and performing statistical contrasts. Hum Brain Mapp. 2005b;25:155–164. doi: 10.1002/hbm.20136. [DOI] [PMC free article] [PubMed] [Google Scholar]
- Laird AR, Eickhoff SB, Li K, Robin DA, Glahn DC, Fox PT. Investigating the functional heterogeneity of the default mode network using coordinate-based meta-analytic modeling. J Neurosci. 2009;29:14496–14505. doi: 10.1523/JNEUROSCI.4004-09.2009. [DOI] [PMC free article] [PubMed] [Google Scholar]
- Laird AR, Robinson JL, McMillan KM, Tordesillas-Gutierrez D, Moran ST, Ray KL, Franklin C, Glahn DC, Fox PT, Lancaster JL. Comparison of the disparity between Talairach and MNI coordinates in functional neuroimaging data: Validation of the Lancaster transform. Neuroimage. 2010;51:677–683. doi: 10.1016/j.neuroimage.2010.02.048. [DOI] [PMC free article] [PubMed] [Google Scholar]
- Laird AR, Eickhoff SB, Fox PM, Uecker AM, Ray KL, Saenz JJ, McKay DR, Bzdok D, Laird RW, Robinson JL, Turner JA, Turkeltaub PE, Lancaster JL, Fox PT. The BrainMap strategy for standardization, sharing, and meta-analysis of neuroimaging data. BMC Res Notes. 2011a;4:349. doi: 10.1186/1756-0500-4-349. [DOI] [PMC free article] [PubMed] [Google Scholar]
- Laird AR, Fox PM, Eickhoff SB, Turner JA, Ray KL, McKay DR, Glahn DC, Beckmann CF, Smith SM, Fox PT. Behavioral interpretations of intrinsic connectivity networks. J Cogn Neurosci. 2011b;23:4022–37. doi: 10.1162/jocn_a_00077. [DOI] [PMC free article] [PubMed] [Google Scholar]
- Lancaster JL, Tordesillas-Gutiérrez D, Martinez M, Salinas F, Evans A, Zilles K, Mazziotta JC, Fox PT. Bias between MNI and Talairach coordinates analyzed using the ICBM-152 brain template. Hum Brain Mapp. 2007;28:1194–1205. doi: 10.1002/hbm.20345. [DOI] [PMC free article] [PubMed] [Google Scholar]
- Leveroni CL, Seidenberg M, Mayer AR, Mead LA, Binder JR, Rao SM. Neural systems underlying the recognition of familiar and newly learned faces. J Neurosci. 2000;20:878–886. doi: 10.1523/JNEUROSCI.20-02-00878.2000. [DOI] [PMC free article] [PubMed] [Google Scholar]
- Liu X, Zhu XH, Qiu P, Chen W. A correlation-matrix-based hierarchical clustering method for functional connectivity analysis. J Neurosci Methods. 2012;211:94–102. doi: 10.1016/j.jneumeth.2012.08.016. [DOI] [PMC free article] [PubMed] [Google Scholar]
- Luo Y, Qin S, Fernandez G, Zhang Y, Klumpers F, Li H. Emotion perception and executive control interact in the salience network during emotionally charged working memory. Hum Brain Mapp. 2014;35:5606–5616. doi: 10.1002/hbm.22573. [DOI] [PMC free article] [PubMed] [Google Scholar]
- Markram H. The human brain project. Sci Am. 2012;306:50–55. doi: 10.1038/scientificamerican0612-50. [DOI] [PubMed] [Google Scholar]
- Martinelli P, Sperduti M, Piolino P. Neural substrates of the self-memory system: New insights from a meta-analysis. Hum Brain Mapp. 2013;34:1515–1529. doi: 10.1002/hbm.22008. [DOI] [PMC free article] [PubMed] [Google Scholar]
- McCarthy G, Puce A, Gore JC, Allison T. Face-specific processing in the human fusiform gyrus. J Cogn Neurosci. 1997;9:605–610. doi: 10.1162/jocn.1997.9.5.605. [DOI] [PubMed] [Google Scholar]
- Menon V, Uddin LQ. Saliency, switching, attention, and control: A network model of insula function. Brain Struct Funct. 2010;214:655–667. doi: 10.1007/s00429-010-0262-0. [DOI] [PMC free article] [PubMed] [Google Scholar]
- Morris JS, Frith CD, Perrett DI, Rowland D, Young AW, Calder AJ, Dolan RJ. A differential neural response in the human amygdala to fearful and happy facial expressions. Nature. 1996;383:812–815. doi: 10.1038/383812a0. [DOI] [PubMed] [Google Scholar]
- Nahum L, Simon SR, Sander D, Lazeyras F, Schnider A. Neural response to the behaviorally relevant absence of anticipated outcomes and the presentation of potentially harmful stimuli: A human fMRI study. Cortex. 2011;47:191–201. doi: 10.1016/j.cortex.2009.11.007. [DOI] [PubMed] [Google Scholar]
- Nickl-Jockschat T, Rottschy C, Thommes J, Schneider F, Laird AR, Fox PT, Eickhoff SB. Neural networks related to dysfunctional face processing in autism spectrum disorder. Brain Struct Funct. doi: 10.1007/s00429-014-0791-z. In Press. [DOI] [PMC free article] [PubMed] [Google Scholar]
- Paulesu E, Perani D, Biasi V, Silani G, Borghese NA, De Giovanni U, Sensolo S, Fazio F. A functional-anatomical model for lipreading. J Neurophysiol. 2003;90:2005–2013. doi: 10.1152/jn.00926.2002. [DOI] [PubMed] [Google Scholar]
- Pedrycz W. Knowledge-based clustering: From data to information granules. John Wiley; Hoboken, NJ: 2005. [Google Scholar]
- Phillips ML, Young AW, Scott SK, Calder AJ, Andrew C, Giampietro V, Williams SCR, Bullmore ET, Brammer M, Gray JA. Neural responses to facial and vocal expressions of fear and disgust. Proc R Soc Lond B. 1998;265:1809–1817. doi: 10.1098/rspb.1998.0506. [DOI] [PMC free article] [PubMed] [Google Scholar]
- Poldrack RA. Can cognitive processes be inferred from neuroimaging data? Trends Cogn Sci. 2006;10:59–63. doi: 10.1016/j.tics.2005.12.004. [DOI] [PubMed] [Google Scholar]
- Poldrack RA, Kittur A, Kalar D, Miller E, Seppa C, Gil Y, Parker DS, Sabb FW, Bilder RM. The Cognitive Atlas: Toward a knowledge foundation for cognitive neuroscience. Front Neuroinform. 2011;5:17. doi: 10.3389/fninf.2011.00017. [DOI] [PMC free article] [PubMed] [Google Scholar]
- Price CJ, Devlin JT, Moore CJ, Morton C, Laird AR. Meta-analyses of object naming: Effect of baseline. Hum Brain Mapp. 2005;25:70–82. doi: 10.1002/hbm.20132. [DOI] [PMC free article] [PubMed] [Google Scholar]
- Puce A, Allison T, Bentin S, Gore JC, McCarthy G. Temporal cortex activation in humans viewing eye and mouth movements. J Neurosci. 1998;18:2188–2199. doi: 10.1523/JNEUROSCI.18-06-02188.1998. [DOI] [PMC free article] [PubMed] [Google Scholar]
- Raichle ME, MacLeod AM, Snyder AZ, Powers WJ, Gusnard DA, Shulman GL. A default mode of brain function. Proc Natl Acad Sci USA. 2001;98:676–682. doi: 10.1073/pnas.98.2.676. [DOI] [PMC free article] [PubMed] [Google Scholar]
- Ramasubbu R, Masalovich S, Peltier S, Holtzheimer PI, Heim C, Mayberg HS. Neural representation of maternal face processing: A functional magnetic resonance imaging study. Can J Psychiatry. 2007;52:726–734. doi: 10.1177/070674370705201107. [DOI] [PubMed] [Google Scholar]
- Ramasubbu R, Masalovich S, Gaxiola I, Peltier S, Hotzheimer PE, Heim C, Goodyear B, MacQueen G, Mayberg HS. Differential neural activity and connectivity for processing one’s own face: A preliminary report. Psych Res. 2011;194:130–140. doi: 10.1016/j.pscychresns.2011.07.002. [DOI] [PMC free article] [PubMed] [Google Scholar]
- Rolls ET. The representation of information about faces in the temporal and frontal lobes. Neuropsychologia. 2007;45:124–143. doi: 10.1016/j.neuropsychologia.2006.04.019. [DOI] [PubMed] [Google Scholar]
- Schulz KP, Clerkin SM, Halperin JM, Newcorn JH, Tang CY, Fan J. Dissociable neural effects of stimulus valence and preceding context during the inhibition of responses to emotional faces. Hum Brain Mapp. 2009;30:2821–2833. doi: 10.1002/hbm.20706. [DOI] [PMC free article] [PubMed] [Google Scholar]
- Seeley WW, Menon V, Schatzberg AF, Keller J, Glover GH, Kenna H, Reiss AL, Greicius MD. Dissociable intrinsic connectivity networks for salience processing and executive control. J Neurosci. 2007;27:2349–2356. doi: 10.1523/JNEUROSCI.5587-06.2007. [DOI] [PMC free article] [PubMed] [Google Scholar]
- Sergent J, Ohta S, MacDonald B. Functional neuroanatomy of face and object processing: A positron emission tomography study. Brain. 1992;115:15–36. doi: 10.1093/brain/115.1.15. [DOI] [PubMed] [Google Scholar]
- Shannon P, Markiel A, Ozier O, Baliga NS, Wang JT, Ramage D, Amin N, Schwikowski B, Ideker T. Cytoscape: A software environment for integrated models of biomolecular interaction networks. Genome Res. 2003;13:2498–2504. doi: 10.1101/gr.1239303. [DOI] [PMC free article] [PubMed] [Google Scholar]
- Shah NJ, Marshall JC, Zafiris O, Schwab A, Zilles K, Markowitsch HJ, Fink GR. The neural correlates of person familiarity: A functional magnetic resonance imaging study with clinical implications. Brain. 2001;124:804–815. doi: 10.1093/brain/124.4.804. [DOI] [PubMed] [Google Scholar]
- Shi H, Wang X, Yao S. Comparison of activation patterns between masking and inattention tasks: A coordinate-based meta-analysis of implicit emotional face processing. Front Hum Neurosci. 2013;7:459. doi: 10.3389/fnhum.2013.00459. [DOI] [PMC free article] [PubMed] [Google Scholar]
- Simon D, Becker MPI, Mothes-Lasch M, Miltner WHR, Straube T. Effects of social context on feedback-related activity in the human ventral striatum. Neuroimage. 2014;99:1–6. doi: 10.1016/j.neuroimage.2014.05.071. [DOI] [PubMed] [Google Scholar]
- Spreng RN, Mar RA, Kim ASN. The common neural basis of autobiographical memory, prospection, navigation, theory of mind, and the default mode: A quantitative meta-analysis. J Cogn Neurosci. 2009;21:489–510. doi: 10.1162/jocn.2008.21029. [DOI] [PubMed] [Google Scholar]
- Sreenivas S, Boehm SG, Linden DEJ. Emotional faces and the default mode network. Neurosci Lett. 2012;506:229–234. doi: 10.1016/j.neulet.2011.11.012. [DOI] [PubMed] [Google Scholar]
- Talairach J, Tournoux P. Co-planar stereotaxic atlas of the human brain. Thieme Medical Publishers; New York: 1988. [Google Scholar]
- Taylor KS, Seminowicz DA, Davis KD. Two systems of resting state connectivity between the insula and cingulate cortex. Hum Brain Mapp. 2009;30:2731–2745. doi: 10.1002/hbm.20705. [DOI] [PMC free article] [PubMed] [Google Scholar]
- Toga AW, Clark KA, Thompson PM, Shattuck DW, Van Horn JD. Mapping the human connectome. Neurosurgery. 2012;71:1–5. doi: 10.1227/NEU.0b013e318258e9ff. [DOI] [PMC free article] [PubMed] [Google Scholar]
- Turkeltaub PE, Eden GF, Jones KM, Zeffiro TA. Meta-analysis of the functional neuroanatomy of single-word reading: Method and validation. Neuroimage. 2002;16:765–80. doi: 10.1006/nimg.2002.1131. [DOI] [PubMed] [Google Scholar]
- Turkeltaub PE, Eickhoff SB, Laird AR, Fox PM, Wiener M, Fox PT. Minimizing within-experiment and within-group effects in activation likelihood estimation meta-analyses. Hum Brain Mapp. 2012;33:1–13. doi: 10.1002/hbm.21186. [DOI] [PMC free article] [PubMed] [Google Scholar]
- Turner JA, Laird AR. The Cognitive Paradigm Ontology: Design and application. Neuroinformatics. 2012;10:57–66. doi: 10.1007/s12021-011-9126-x. [DOI] [PMC free article] [PubMed] [Google Scholar]
- Turner MD, Chakrabarti C, Jones TB, Xu JF, Fox PT, Luger GF, Laird AR, Turner JA. Automated annotation of functional neuroimaging experiments via multi-label classification. Front Neurosci: Brain Imag Methods. 2013;7:240. doi: 10.3389/fnins.2013.00240. [DOI] [PMC free article] [PubMed] [Google Scholar]
- Van Essen DC, Smith SM, Barch DM, Behrens TEJ, Yacoub E, Ugurbil K for the WU-Minn HCP Consortium. The WU-Minn Human Connectome Project: An overview. NeuroImage. 2013;80:62–79. doi: 10.1016/j.neuroimage.2013.05.041. [DOI] [PMC free article] [PubMed] [Google Scholar]
- Woo CW, Krishnan A, Wager TD. Cluster-extent based thresholding in fMRI analyses: Pitfalls and recommendations. Neuroimage. 2014;91:412–4129. doi: 10.1016/j.neuroimage.2013.12.058. [DOI] [PMC free article] [PubMed] [Google Scholar]
- Yarkoni T, Poldrack RA, Nichols TE, Van Essen DC, Wager TD. Large-scale automated synthesis of human functional neuroimaging data. Nat Methods. 2011;8:665–670. doi: 10.1038/nmeth.1635. [DOI] [PMC free article] [PubMed] [Google Scholar]
- Zhen Z, Fang H, Liu J. The hierarchical brain network for face recognition. PLoS ONE. 2013;8:e59886. doi: 10.1371/journal.pone.0059886. [DOI] [PMC free article] [PubMed] [Google Scholar]
Associated Data
This section collects any data citations, data availability statements, or supplementary materials included in this article.