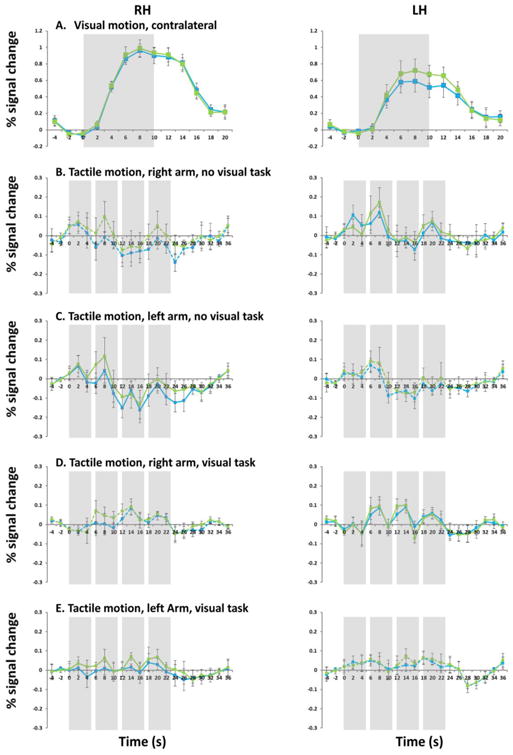
Figure 4.

fMRI time course in percent signal change within MT and MST for contralateral visual motion stimulus (A), tactile motion stimulus without a visual task (B: right arm; C: left arm), tactile motion stimulus with a visual task (D. right arm; E: left arm). Note that scale on the y-axis was changed for all tactile conditions. Leftward panels show time course data in right MT and MST, and rightward panels show time course data in left MT and MST. MT is shown in blue and MST is shown in green. Solid lines show contralateral stimulation, and dashed lines show ipsilateral stimulation. Shading represents the period of visual/tactile stimulation (10s block for visual stimulation, 24s block for tactile stimulation consisting of 4 5-s brushes).
