

Abstract
Objectives
To compare complex quantitative magnetic resonance imaging (MRI) with MR spectroscopy (MRS) for quantification of hepatic steatosis (HS) and determine clinically significant MRI-based thresholds of HS in female youths.
Methods
This prospective, cross-sectional study was conducted in 132 healthy females (11–22 years, mean 13.3 ± 2). Proton density fat-fraction (PDFF) was measured using complex quantitative MRI and MRS. Body mass index (BMI), fasting labs [glucose, insulin, alanine aminotransferase (ALT), and other metabolic markers] were obtained. Outcomes were measured using regression analysis, Spearman-rank correlation, and receiver operator characteristics (ROC) analysis. HS was defined as MRI-PDFF >5.6 %.
Results
HS was detected by MRI-PDFF in 15 % of all subjects. Linear regression demonstrated excellent correlation and agreement [r2 = 0.96, slope = 0.97 (95 %CI: 0.94–1.00), intercept = 0.78 % (95 %CI: 0.58–0.98 %)] between MRI-PDFF and MRS-PDFF. MRI-PDFF had a sensitivity of 100 % (95 %CI: 0.79–1.00), specificity of 96.6 % (95 %CI: 0.91–0.99), and a kappa index of 87 % (95 %CI: 0.75-0.99) for identifying HS. In overweight subjects with HS, MRI-PDFF correlated with ALT (r = 0.84, p < 0.0001) and insulin (r = 0.833, p < 0.001), but not with BMI or WC. ROC analysis ascertained an optimal MRI-PDFF threshold of 3.5 % for predicting metabolic syndrome (sensitivity = 76 %, specificity = 83 %).
Conclusion
Complex quantitative MRI demonstrates strong correlation and agreement with MRS to quantify hepatic triglyceride content in adolescent girls and young women. A low PDFF threshold is predictive of metabolic syndrome in this population.
Keywords: Magnetic resonance imaging, Magnetic resonance spectroscopy, Pediatrics, Obesity, Fatty liver
Introduction
Nonalcoholic fatty liver disease (NAFLD) comprises a continuum from isolated hepatic steatosis (HS) to steatohepatitis (NASH), through bridging fibrosis and eventually cirrhosis, and is emerging as the leading cause of hepatic failure in the Western world [1, 2]. The prevalence of NAFLD may be as high as 25 % of overweight adolescent girls and up to 38 % of all overweight children [1, 3, 4]. Insulin resistance (IR) and metabolic syndrome are strongly associated with NAFLD and contribute to development of NASH [5, 6] by facilitating intrahepatocellular accumulation of triglycerides and fatty acids [7, 8]. Accumulation of fatty acids causes oxidative stress and activation of stellate cells, which can lead to hepatocellular injury [9].
Early diagnosis is important because prognosis is improved when NAFLD is identified before progression to NASH [1, 10]. Unfortunately, identification of isolated steatosis in children is difficult and up to 68 % of children and adolescents with NAFLD already have NASH at diagnosis [4, 11]. While elevations in liver transaminases are often used to screen for NAFLD, multiple studies in children have shown that alanine aminotransferase (ALT) correlates poorly or not at all with early steatosis [1, 3, 7, 12, 13]. Given the insensitivity of ALT as a marker of NAFLD, it is likely that NAFLD in children and adolescents is under-diagnosed, particularly in the early stages [14].
A number of imaging techniques have been used to detect and quantify HS. Ultrasound (US) is commonly used, but sensitivity is poor when histological steatosis grading is <30 % [15]. Computed tomography (CT) is more specific than US, but it also performs poorly at lower degrees of steatosis [16] and requires ionizing radiation.
Quantitative MR spectroscopy (MRS) is widely considered to be the non-invasive reference standard to quantify liver fat and correlates strongly with steatosis measured by biopsy [17, 18]. In recent adult studies, emerging confounder-corrected quantitative MRI methods for estimating hepatic triglyceride concentration demonstrated equivalent accuracy to single-voxel spectroscopy MRS with the added advantage of providing high spatial resolution over the entire liver [19–22]. Both MRS and quantitative MRI methods estimate the proton density fat-fraction (PDFF), which is a fundamental property of tissue that measures hepatic triglyceride concentration [23]. Although studies in adults are promising, there are a paucity of data on the use of quantitative MRI to measure hepatic PDFF in healthy populations of children and adolescents [24].
The purpose of this work was to perform a prospective comparison of a complex confounder-corrected chemical shift-encoded quantitative MR imaging method with MR spectroscopy for quantification of HS in adolescent girls. A secondary goal of this work was to determine the clinically significant PDFF threshold of HS in this population.
Materials and methods
Study design and subjects
This Health Insurance Portability and Accountability Act-compliant study was approved by our institutional review board. Study subjects comprised females who responded to a general invitation to participate in this study that was distributed to our general and endocrine paediatric clinics and a local middle school. After informed written consent and assent were obtained, an MRI safety screen, a brief survey of personal and family medical history, medication use, and self-identified race and ethnicity (per National Institutes of Health race and ethnicity criteria for subjects in clinical research) were collected. Study entrance criteria included female sex and age between 11 and 22 years. Exclusion criteria included a history of chronic disease that affected hepatic or renal function including: Type 1 or Type 2 diabetes mellitus, known liver disease or other chronic illness, treatment with medications including oral contraceptives, lipid-lowering or glucose metabolism altering agents, or vitamin E supplements greater than 100 IU daily, pregnancy, or excess alcohol consumption defined as greater than an average of 1.5 drinks per day, and standard contraindications to MRI (metallic implants, claustrophobia, etc.). We enrolled 136 subjects, and 132 subjects successfully completed both MRI and MRS measures. It should be noted that data acquired from the complete group of subjects were previously reported in a study which proposed a risk assessment model for early detection of HS using common anthropometric and metabolic markers [25]. The only overlapping data are patient characteristics, and comparison of MRI and MRS was not evaluated in the previous manuscript.
Height was measured using a stadiometer and recorded to the nearest 0.5 cm. Waist circumference (WC) was measured twice just above the iliac crests with Graham-Field® cloth woven measuring tape, and the average was recorded to the nearest 1 mm. Weight was measured without shoes in light clothes on a beam balance platform scale to the nearest 0.1 kg. Body mass index (BMI) was then calculated. Self-assessment of Tanner staging for breast and pubic hair was also performed [26].
Laboratory
Fasting blood samples were obtained within 30 days of MRI and analyzed at the University Wisconsin Laboratory for lipids [total cholesterol, high-density lipoprotein (HDL), low density lipoprotein (LDL)-calculated, and triglycerides], AST, ALT, glucose, and insulin. Glucose was determined by hexokinase method, insulin by chemiluminescent immunoassay. ALT determined by NADH with Pyridoxoal-5 phosphate assay. Total cholesterol and triglycerides determined by enzymatic assay, and HDL with a direct homogeneous assay. At the time of this study, the normal reference ranges of ALT assays at the university lab was less than or equal to 65 U/L. The homeostasis model of assessment of insulin resistance (HOMA-IR) was calculated as [fasting glucose (mg/dL) × fasting insulin (μU/mL)/405]; [27]. The presence of metabolic syndrome was identified using two different sets of criteria. The first, Met-IFG, refers to the presence of at least three of the five following criteria: fasting blood glucose ≥100 mg/dL, blood pressure >90th percentile for age/height/sex [28], waist circumference >90th percentile for age/sex [29], HDL <40 mg/dl, triglycerides >150 mg/dL [30]. The second, Met-IR, substitutes HOMA-IR ≥ 4.0, for impaired fasting glucose [31].
Quantitative MRI-PDFF measurements
Imaging was performed using a clinical 3 T system (MR750, GE Healthcare, Waukesha, WI, USA) with a 32-channel phased array body coil (Neocoil, Pewaukee WI, USA). Volumetric imaging of the liver was performed using an investigational version of a 3D multi-echo complex-based chemical shift-encoded water-fat separation method, similar to that previously reported at 1.5 T [21, 22], to generate PDFF maps over the entire liver. Specific image acquisition parameters included: field-of-view = 44 × 40 cm, first echo time (TE)/repetition time (TR) = 1.2/8.6 ms, echo spacing = 2.0 ms, echo-train length = 6 (two shots of three echoes), BW = ±111 kHz, flip angle = 3° to minimize T1 bias, 8 mm slices, 32 slices, and 256 × 160 matrix. An autocalibrated 2D parallel imaging method [32] with an effective acceleration factor of 2.86 was used to reduce imaging time to a 23-s breath-hold.
Separated water-only and fat-only images, as well as MRI-PDFF maps [23] were automatically generated using an online reconstruction method that addresses or corrects for all known confounders of fat quantification. These include: spectral modelling of fat [33, 34], eddy currents [35], T1 bias [36], T2* decay [33], and noise-related bias [36]. Because all known confounders have been addressed, the resulting MRI-PDFF maps provide an accurate and fundamental measure of the triglyceride concentration in tissue [23].
MRI-PDFF was measured in two ways. First, MRI-PFF was measured from PDFF maps by using a 2.0 × 2.0-cm two ROI (167 pixels) co-localized with the MR spectroscopy voxel and identical in size (in-plane) to the MR spectroscopy voxel. Co-localization was performed by using the coordinates of the MR spectroscopy voxel recorded in the header of the MR spectroscopy data from a single imaging slice that was closest to the centre of the MR spectroscopy voxel. The ROI was centred at the same anterior-posterior and/or left-right in-plane coordinates as the MR spectroscopy voxel. MRI-PDFF was also measured by placing a single region of interest (ROI) in each of the nine Couinaud segments of the liver. The largest circular ROI that could be placed while avoiding large vessels or bile ducts was used. The final estimate of MRI-PDFF was determined from the average of these values [21]. HS was defined as a hepatic MRS PDFF >5.6 % [37].
Quantitative MRS-PDFF measurements
Single-voxel MRS was performed to serve as the reference for PDFF, using a single-voxel STEAM (stimulated echo acquisition mode) acquisition without water suppression [38]. A 2.0 × 2.0 × 2.0 cm3 voxel was placed in the posterior segment of the right hepatic lobe (segment VI or VII) in an area that avoided the lung base, large vessels, bile ducts, or obvious abnormalities (e.g., mass). After a single pre-acquisition excitation, five single-average spectra with a repetition time TR of 3500 ms to avoid T1-weighting, were acquired consecutively at progressively longer echo times of 10, 15, 20, 25, and 30 ms for a total breath-hold time of 21 s. Mixing time was 5 ms, receiver bandwidth was ±2.5 kHz with 2048 readout points. All MRS spectra were analyzed using the AMARES method under jMRUI, as previously described [21, 22]. Correction for T2-decay was performed for both the water and fat peaks, providing a T2-corrected estimate of MRS-PDFF.
Statistical analysis
Subject characteristics and metabolic markers were summarized using means and standard deviations or frequencies and percentages. The comparison of ALT and metabolic markers between subjects with HS and subjects without HS was performed using a two-sample t-test. Regression analysis was conducted to evaluate the association between MRI-PDFF and MRS-PDFF measurements. Since the distribution of PDFF was skewed at lower PDFF values, all MRI and MRS-PDFF values were log-transformed when conducting the regression analysis. Furthermore, to quantify the level of reproducibility between MRI and MRS-PDFF measurements, the intra-class correlation (ICC) coefficient was calculated using a one-way random effects model. The bootstrap method was used to calculate the 95 % confidence interval of the ICC. The reproducibility between MRI and MRS-PDFF measurements was displayed in graphical format using a Bland-Altman plot [39]. Sensitivity and specificity of MRI-PDFF was evaluated using MRS-PDFF as the reference with commonly used threshold of 5.6 % [37]. Non-parametric Spearman's rank correlation analysis was conducted to examine the association between MRI-PDFF and metabolic measures. To evaluate the clinical utility of MRI-PDFF and its relationship with markers of metabolic syndrome, a receiver operating characteristics (ROC) curve analysis was also conducted. The predictive power of MRI-PDFF for identifying subjects with metabolic syndrome was quantified by calculating the area under the curve (AUC) of the ROC curve. The Youden method was used to determine optimal thresholds for predicting metabolic syndrome. Statistical analysis was conducted using SAS software (SAS Institute Inc., Cary, NC, USA) version 9.3. All p-values are two-sided, and p < 0.05 was used to determine statistical significance.
Results
Subjects and anthropometric markers
Characteristics of the subjects are presented in Table 1. Using the diagnostic criteria for HS of MRI-PDFF >5.6 % [37], HS was detected in 15 % (20/132) of all subjects, in 25 % of overweight subjects (18/71 of those with BMI >85th percentile), and in two subjects who were not overweight. Median MRI-PDFF in subjects with HS was 9.8 % (mean 13.5, SD 9.3). There were no significant differences in mean age, BMI, or waist circumference between overweight subjects with and without HS. All subjects were pubertal with self-assessed breast Tanner stage [26] of 2 or greater, and the average self-assessed breast Tanner stage [26] was not statistically different for overweight subjects with HS (4.5, SD 0.9) and overweight subjects without HS (4.3, SD 1.0); p-value 0.58.
Table 1. The formating of the headings for the table seems off. The heading should be line and “n=XX” on the second line. this is not consistient throughout the table.
Subject characteristics in those with and without hepatic steatosis (HS)a
| All subjects n = 132 | All subjects without HS n = 112 | All subjects with HS n = 20 | P value | Overweight subjects without HS n = 53 | Overweight subjects with HS n = 18 | ||
|---|---|---|---|---|---|---|---|
| Age(years) | 13.3(2.0) | 13.2(1.9) | 13.7(2.5) | 0.35 | 13.6 (2.3) | 13.8 (2.6) | |
| Race | AA | 40 (30.3) | 38 (33.9) | 2 (10) | 0.02* | 25 (47.2) | 2 (11.1) |
| AS | 8 (6.1) | 5 (4.5) | 3 (15) | 1 (1.9) | 2 (11.1) | ||
| W | 84 (63.6) | 69 (61.6) | 15 (75) | 27 (50.9) | 14 (77.8) | ||
| Ethnicity | H | 34 (25.8) | 24 (21.4) | 10 (50.0) | 0.007 | 13 (24.5) | 9 (50.0) |
| NH | 98 (74.2) | 88 (78.6) | 10 (50.0) | 40 (75.5) | 9 (50.0) | ||
| BMI (kg/m2) | 24.9 (7.2) | 23.8 (6.8) | 31.0 (6.8) | <0.001 | 29.3 (5.8) | 31.9 (6.4) | |
| WC (cm) | 82.3 (19.3) | 79.6 (19) | 96.5 (17) | <0.001 | 94.8 (12.8) | 98.6 (16.7) |
Abbreviations: AA, African American. AS, Asian. W, white. H, Hispanic. NH, Non-Hisp BMI, body mass index. WC, waist circumference.
The data are mean (SD) or number (percent)
Post-hoc testing using Bonferroni correction. Between group comparisons were not significant.
Posthoc testing using Bonferroni corrections. Unable to perform between group comparison for AS vs. W or AS vs. AA due to small numbers. Other between group comparisons were not significant.
Measurement of MRI-PDFF
Representative MRI-PDFF maps and the corresponding MR spectra for three subjects with low, medium, and high PDFF are shown in Fig. 1. Subjective agreement between MRI-PDFF with MRS-PDFF is noted in these examples. Linear regression analysis to compare MRI-PDFF with MRS-PDFF (Fig. 2) demonstrated excellent correlation and agreement with an r2 of 0.96, a slope parameter estimate of 0.97 (95 % CI: 0.94–1.00) and an intercept of 0.78 % (95 % CI: 0.58–0.98 %) when MRI-PDFF was measured as the average of ROIs obtained in all nine Couinaud segments of the liver, and an r2 of 0.97, a slope parameter estimate of 1.04 (95 % CI: 1.01–1.07) and an intercept of 0.84 % (95 % CI: 0.64–1.03 %) when MRI-PDFF was measured co-localized with the MRS voxel. Since the distribution of PDFF was skewed at lower PDFF values, all MRI and MRS-PDFF values were also log-transformed for regression analysis and continued to show strong correlation (Fig. 3) with r2 = 0.75 when MRI-PDFF was measured as the average of ROIs obtained in all nine Couinaud segments of the liver and r2 = 0.73 when MRI-PDFF was measured co-localized at the MRS-voxel. For the remainder of our analysis, we will use the MRI-PDFF measured as an average of the nine Couinaud liver segments, as this method was superior to the co-localized measurement on log-transformation and the majority of our subjects had PDFF values at the lower end of the scale. ICC reproducibility analysis between MRI-PDFF and MRS PDFF found an ICC = 0.74 (95 % CI: 0.65–0.81), indicating an excellent level of reproducibility between the two measurements [40]. Furthermore, the Bland-Altman plot (Fig. 4) between the PDFF measures confirms the excellent level of reproducibility between the PDFF measures with an estimated bias of 0.8 % (95 % CI: 0.52–0.88 %) for the MRI-PDFF measurements when compared to the MRS-PDFF reference standard.
Fig. 1.
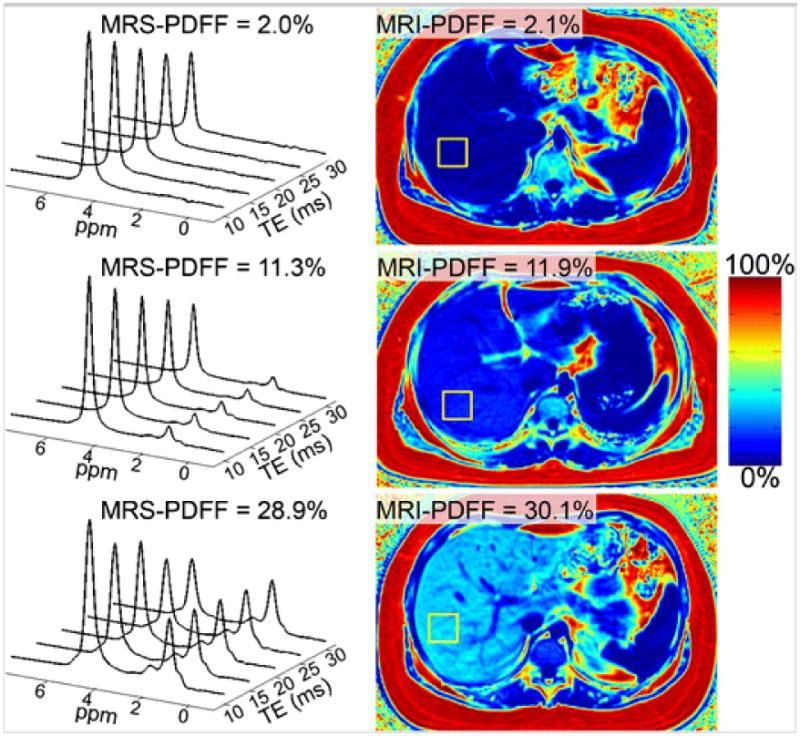
Representative examples of MRI-PDFF maps and T2-corrected MRS in three subjects, with low, medium, and high concentrations of fat.
Fig. 2.
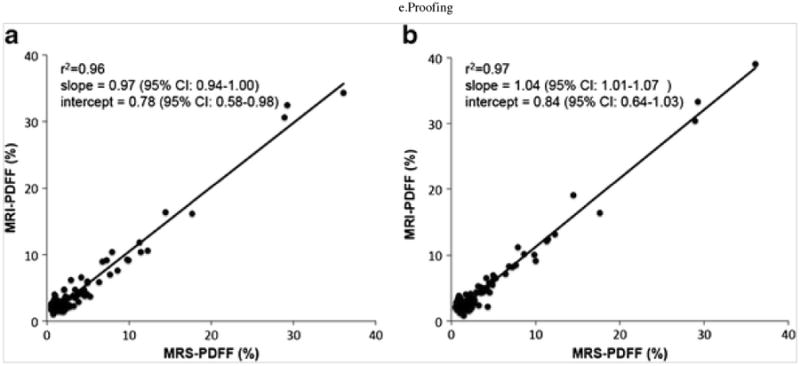
Scatterplots shown of MRI-PDFF plotted against MRS-PDFF in all 132 subjects; (a) MRI-PDFF measured as the average value of ROIs obtained in the nine Couinaud segments of the liver and (b) MRI-PDFF measured from ROIs that were co-localized with the MR spectroscopy voxel. Linear regression analysis with both plots demonstrated excellent correlation and agreement.
Fig. 3.
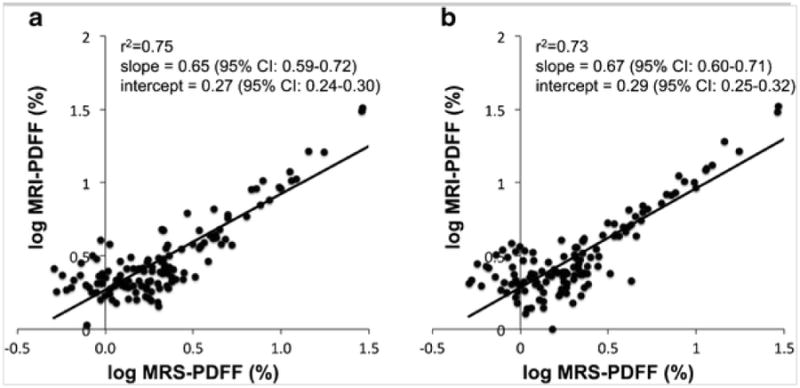
Scatterplots of MRI-PDFF plotted against MRS-PDFF on a logarithmic scale were performed because clustering was observed at lower PDFF values (Fig. 2). (a) MRI-PDFF measured as the average value of ROIs obtained in the nine Couinaud segments of the liver and (b) MRI-PDFF measured from ROIs that were co-localized with the MR spectroscopy voxel. Although excellent logarithmic correlation was observed, a small positive bias appears to be present at low PDFF values.
Fig. 4.
Bland-Altman plot between MRI- and MRS-PDFF measurements. The centre dotted line represents the estimated bias of the MRI-PDFF when compared to MRS-PDFF. The upper and lower dotted lines represent the 95 % confidence limits of the mean difference.
To evaluate the clinical utility of MRI to diagnose HS (i.e. PDFF >5.6 %), we calculated the sensitivity and specificity of MRI-PDF to determine HS using MRS-PDFF as the reference. MRI-PDFF diagnosis of HS had a sensitivity of 100 % (95 % CI: 0.79–1.00), a specificity of 96.6 % (95 % CI: 0.91–0.99), and a kappa index of 87 % (95 % CI: 0.75–0.99), which represents an excellent level of agreement [40].
MR-PDFF and metabolic markers of HS
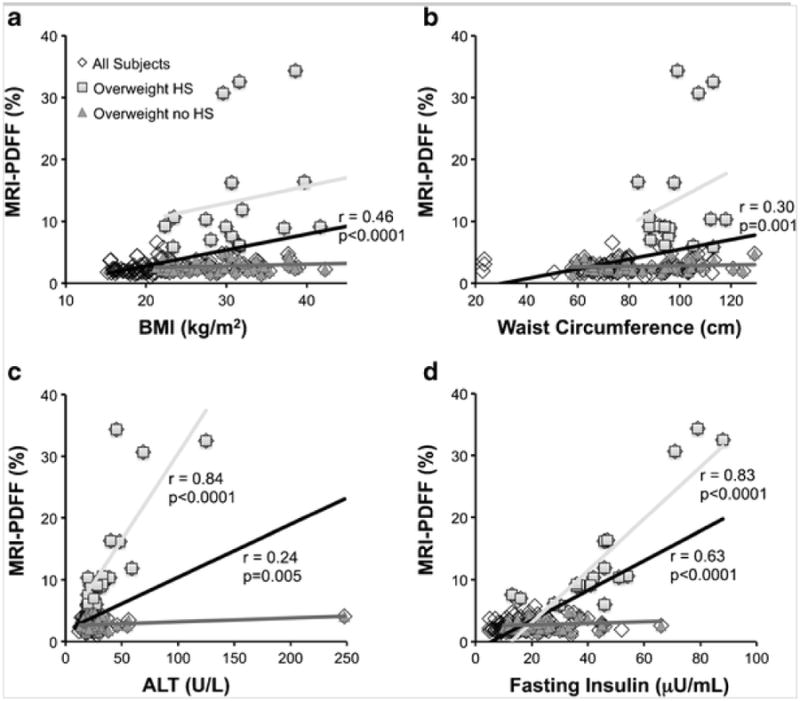
Figure 5 shows the associations between MRI-PDFF and common metabolic indicators in all subjects, overweight subjects with HS, and overweight subjects without HS. As shown in Fig. 5a, b, MRI-PDFF had a moderately strong correlation with both BMI (r = 0.46, p < 0.0001) and WC (r = 0.30, p < 0.001) in all subjects. However, in a sub-analysis of overweight subjects, MRI-PDFF did not correlate with either BMI or WC.
Fig. 5.

Linear correlation of MRI-PDFF with common metabolic indicators was analyzed for three groups: all subjects (black linear regression line), overweight subjects (BMI >85th percentile) with hepatic steatosis (HS) (light gray linear regression line), and overweight subjects without HS (medium gray linear regression line). MRI-PDFF correlated with both BMI (a) and waist circumference (b) in all subjects, but neither correlated with MRI-PDFF in a sub-analysis of overweight subjects with and without HS. MRI-PDFF correlated strongly with ALT (c) and fasting insulin (d) in all subjects and in overweight subjects with HS, but not in overweight subjects without HS.
As shown in Fig. 5c, MRI-PDFF correlated moderately with ALT in all subjects (r = 0.24, p = 0.005). Sub-analysis of overweight subjects showed that MRI-PDFF correlated strongly with ALT in those with HS (r = 0.84, p < 0.0001), but not in those without HS.
Similarly, Fig. 5d shows a moderately strong correlation between MRI-PDFF and fasting insulin levels in all subjects (r = 0.63, p < 0.001). Sub-analysis of overweight subjects showed a strong correlation of MRI-PDFF with fasting insulin in those with HS (r = 0.83, p < 0.001), but no correlation in those without HS.
Additional sub-analysis of overweight subjects with and without HS is shown in Table 2. Fasting glucose, fasting insulin, HOMA-IR, triglycerides, and Met-IR were significantly higher for those overweight subjects with HS (p < 0.02). However, ALT was not significantly different between these two groups. In addition, mean ALT for subjects with HS was 39 U/L (SD 25.6 U/L), which was within the laboratory reference range (<65 U/L) in 16/18 of the subjects with HS.
Table 2. Comparison of metabolic markers of hepatic steatosis in overweight subjectsa.
| No HS n = 53 | HS n = 18 | P value | |
|---|---|---|---|
| ALT | 27.7 (32.2) | 39 (25.6) | 0.139 |
| Fasting Glucose | 84.6 (6.8) | 90.7 (9.5) | 0.020 |
| Fasting Insulin | 24.6 (11.5) | 44.8 (19.5) | <0.001 |
| Homa-IR | 5.1 (2.6) | 10.2 (4.7) | <0.001 |
| HgAlc | 5.4 (0.4) | 5.6 (0.3) | 0.206 |
| Total cholesterol | 147.4 (24.9) | 160.7 (27) | 0.080 |
| Triglycerides | 91.4 (39.9) | 156.7 (75.5) | 0.002 |
| HDL | 44.6 (10.1) | 40.8 (9.4) | 0.161 |
| LDL | 84.5 (24.3) | 88.6 (21.8) | 0.506 |
| Met-IFG | 7 (13.2) | 5 (27.8) | 0.172 |
| Met-IR | 16 (30.2) | 13 (72.2) | 0.002 |
Abbreviations: HOMAIR, Homeostasis model of assessment-insulin resistance; HgA1c, Hemoglobin A1c; HDL, High-density lipoprotein; LDL, Low-density lipoprotein; Met-IFG, metabolic syndromeimpaired fasting glucose; Met-IR, metabolic syndrome-insulin resistance.
Data are mean (SD) or number (percent)
Analysis of a metabolically significant MRI-PDFF threshold
ROC analysis was performed to evaluate the relationship between MRI-PDFF and clinical markers of metabolic syndrome. MRI-PDFF was found to be a good predictor of metabolic syndrome based on Met-IFG criteria with an AUC of 0.81 (95 % CI: 0.67–0.95)] and Met-IR criteria with an AUC 0.81 (95 % CI: 0.67–0.95)]. The optimal MRI-PDFF threshold, based on the Youden method, for predicting metabolic syndrome using Met-IFG criteria was 3.5 %, with a sensitivity of 83 % (95 % CI: 55–95 %) and a specificity of 7 5 % (95 % CI: 67–83 %). Analogously, the optimal threshold for predicting metabolic syndrome using Met-IR criteria was 3.0 % with a sensitivity of 80 % (95 % CI: 63–90 %) and specificity of 81 % (95 % CI: 71–86 %).
Discussion
In this group of adolescent girls and young women, complex confounder-corrected chemical shift-encoded quantitative MRI accurately quantified hepatic steatosis, using MRS as the reference. Thus, this study extends findings of quantitative MRI-based methods in adult studies [21, 22] to younger subjects and demonstrates the feasibility and potential clinical utility for use in a paediatric population.
With regard to clinical relevance, MRI-PDFF proved to be a highly sensitive and specific predictor of HS and therefore may be a potential aid in early detection of NAFLD. MRI-PDFF thresholds of 3.0 % and 3.5 % were predictive of metabolic syndrome using two commonly accepted criteria incorporating fasting glucose and HOMA-IR. Importantly, these thresholds are lower than the commonly used threshold of 5.6 % to define HS in adults [37]. This value was based upon the 95th percentile of MRS-derived hepatic triglyceride content in adult subjects with no risk factors for HS, and these data were not correlated with metabolic disease markers. Data from our study suggest that a lower threshold for hepatic PDFF may be clinically relevant as an indicator of emerging metabolic syndrome, in children and adolescents.
Although anthropometric markers (BMI and WC) were predictive of MRI-PDFF in the entire group, they did not correlate significantly with MRI-PDFF in overweight subjects with or without HS. This implies that BMI and WC are not useful discriminators of HS risk for adolescents and young women. In this population, overweight subjects with HS showed adverse metabolic effects, including significantly elevated fasting glucose, fasting insulin, HOMA-IR, triglycerides, and rates of metabolic syndrome compared to similar weight children without HS. This observation strengthens previous findings that hepatic triglyceride content is associated with higher rates of dyslipidemia and insulin resistance in adolescents [41–44].
Interestingly, levels of ALT, a marker of hepatocellular injury, did not significantly differ between overweight subjects with and without HS. Further, 90 % (18/20) of all subjects with HS and 89 % (16/18) of overweight subjects with HS had an ALT within the laboratory reference range (normal <65 U/L). Based on data reported in the Screening ALT for Elevation in Today's Youth (SAFETY) study [45], Schwimmer et al. recommended using an ALT threshold of 22.1 U/L to improve sensitivity for detection of NAFLD. When applied to our subjects, this threshold identified 80 % (16/20) of all subjects with HS and 78 % (14/18) of overweight subjects with HS. However, this ALT threshold is less specific, as 42 % (22/53) of overweight subjects without HS also had an ALT ≥22.1 U/L. ALT is limited as a predictor of HS in this population. However, in the sub-group of overweight subjects who were identified as having HS, as defined by an MRS-PDFF > 5.6 %, MRI-PDFF correlated strongly with ALT. This suggests that increasing liver fat content may be associated with hepatocellular injury in these subjects.
In a previous study, we also found ALT to be a poor predictor of HS risk and developed a clinically feasible risk assessment model using fasting insulin, total cholesterol, waist circumference, and ethnicity to improve early identification of hepatic steatosis in adolescents [25]. The combination of clinical risk assessment with diagnostic imaging (e.g. ultrasound, CT, or MRI) in the evaluation of liver disease may allow for early detection of disease. In particular, MRI-PDFF may be a useful means to establish the presence of HS, while ALT may be a useful marker of hepatocellular injury once HS has been identified. Further, the low MRI-PDFF threshold identified by our ROC analysis, suggests that quantitative MRI, which is more accurate than ultrasound and CT at low fat concentrations, may be useful as part of the clinical evaluation of early HS in this population.
A unique contribution of this study is the simultaneous acquisition of both imaging and serum metabolic markers in a large, relatively healthy paediatric population. A limitation is that only female subjects were enrolled. Given the significance of pubertal progression on development of IR and NAFLD, the choice to limit enrolment to girls was intentionally designed to limit variability in stages of puberty in the age range of the study group. Several studies, including the SAFETY study, suggest that gender-specific guidelines are necessary to increase sensitivity for early detection of NAFLD [45]. Consequently, future studies of male and female adolescents that include determination of Tanner stage by clinician exam are needed.
Another limitation of this study is that liver biopsy was not performed. However, the aim of this study was to evaluate the prevalence of HS and its relationship to metabolic markers in a large, generally healthy population, in whom liver biopsy was impractical. Other studies evaluating quantitative MRI-based methods have primarily focused on adult populations with known or suspected liver disease. One paediatric study included percutaneous biopsy [24] in subjects with known liver disease, but did not assess the relationship of serum markers of metabolic syndrome with MRI-PDFF.
While there was close agreement between complex quantitative MRI and MRS in this study, there was considerable variability in the lower PDFF range (0–5 %). This may reflect the fact that prior technical development, optimization, and validation of these methods have all been performed over a wide PDFF range, in contrast to the relatively low PDFF levels observed in this population. A small positive bias in low PDFF values was best observed in the logarithmic regression. Therefore, further technical development is needed to reduce the variability at low PDFF values. A reduction in PDFF variability will likely improve the accuracy and precision of quantitative MRI near clinically relevant PDFF thresholds, such as those identified by this study.
In conclusion, this study demonstrated excellent correlation and agreement of confounder-corrected chemical shift-encoded MRI with MRS to measure hepatic steatosis healthy of adolescent girls and young women, and identified an MRI-PDFF threshold that is predictive of metabolic syndrome in this group.
Key points.
Confounder-corrected quantitative MRI (ccqMRI) effectively measures hepatic triglyceride content in adolescent girls.
MRS and ccqMRI strongly correlate in liver proton density fat-fraction (PDFF) detection.
A PDFF threshold of 3.5 % may be predictive of paediatric metabolic syndrome.
Acknowledgments
The scientific guarantor of this publication is Scott Reeder, MD, PhD. The authors of this manuscript declare no relationships with any companies, whose products or services may be related to the subject matter of the article. The authors wish to acknowledge the support of the National Institutes of Health (K24DK102595, R01DK083380, R01DK088925, R01DK100651, K12HD055894, T32DK07758604, UL1TR00427), the Genentech Center for Clinical Research, and the Endocrine Fellows Foundation, as well GE Healthcare, who provides research support to the University of Wisconsin. Jen Eickhoff, PhD kindly provided statistical advice for this manuscript. Dr. Eickhoff has significant statistical expertise and is one of the authors of this paper. Institutional review board approval was obtained. Written informed consent was obtained from all subjects (patients) in this study. Some study subjects or cohorts have been previously reported in the Journal of Pediatrics. It should be noted that data acquired from the complete group of subjects was previously reported in a manuscript that proposed a risk assessment model for early detection of HS using common anthropometric and metabolic markers. The only overlapping data are patient characteristics. Methodology: case-control study, performed at one institution.
Abbreviations
- ALT
Alanine aminotransferase
- AUC
Area under the curve
- BMI
Body mass index
- CT
Computed tomography
- HDL
High-density lipoprotein
- HOMA-IR
Homeostasis model of assessment-insulin resistance
- HS
Hepatic steatosis
- ICC
Intra-class correlation
- LDL
Low density lipoprotein
- IR
Insulin resistance
- Met-IFG
Metabolic syndrome-impaired fasting glucose criteria
- Met-IR
Metabolic syndrome-insulin resistance criteria
- MRI
Magnetic resonance imaging
- MRS
Magnetic resonance spectroscopy
- NAFLD
Nonalcoholic fatty liver disease
- NASH
Nonalcoholic Steatohepatitis
- PDFF
proton densisity fat-fraction
- ROC
receiver operator characteristics
- TE
Echo time
- TR
echo repetition
- US
Ultrasound
- WC
Waist circumference
- WI
Wisconsin
References
- 1.Feldstein AE, Charatcharoenwitthaya P, Treeprasertsuk S, Benson JT, Enders FB, Angulo P. The natural history of non-alcoholic fatty liver disease in children: a follow-up study for up to 20 years. Gut. 2009;58:1538–1544. doi: 10.1136/gut.2008.171280. [DOI] [PMC free article] [PubMed] [Google Scholar]
- 2.Clark JM. The Epidemiology of Nonalcoholic Fatty Liver Disease in Adults. J Clin Gastroenterol Nonalcoholic Steatohepatitis. 2006;40(Supplement):S5–S10. doi: 10.1097/01.mcg.0000168638.84840.ff. [DOI] [PubMed] [Google Scholar]
- 3.Loomba R, Sirlin CB, Schwimmer JB, Lavine JE. Advances in pediatric nonalcoholic fatty liver disease. Hepatology. 2009;50:1282–1293. doi: 10.1002/hep.23119. [DOI] [PMC free article] [PubMed] [Google Scholar]
- 4.Denzer C, Thiere D, Muche R, et al. Gender-specific prevalences of fatty liver in obese children and adolescents: roles of body fat distribution, sex steroids, and insulin resistance. J Clin Endocrinol Metab. 2009;94:3872–3881. doi: 10.1210/jc.2009-1125. [DOI] [PubMed] [Google Scholar]
- 5.Ko JS, Yoon JM, Yang HR, et al. Clinical and histological features of nonalcoholic fatty liver disease in children. Dig Dis Sci. 2009;54:2225–2230. doi: 10.1007/s10620-009-0949-3. [DOI] [PubMed] [Google Scholar]
- 6.Targher G, Day CP, Bonora E. Risk of cardiovascular disease in patients with nonalcoholic fatty liver disease. N Engl J Med. 2010;363:1341–1350. doi: 10.1056/NEJMra0912063. [DOI] [PubMed] [Google Scholar]
- 7.Schwimmer JB, Deutsch R, Rauch JB, Behling C, Newbury R, Lavine JE. Obesity, insulin resistance, and other clinicopathological correlates of pediatric nonalcoholic fatty liver disease. J Pediatr. 2003;143:500–505. doi: 10.1067/S0022-3476(03)00325-1. [DOI] [PubMed] [Google Scholar]
- 8.Utzschneider KM, Kahn SE. Review: the role of insulin resistance in nonalcoholic fatty liver disease. J Clin Endocrinol Metab. 2006;91:4753–4761. doi: 10.1210/jc.2006-0587. [DOI] [PubMed] [Google Scholar]
- 9.Farrell GC, Larter CZ. Nonalcoholic fatty liver disease: from steatosis to cirrhosis. Hepatology. 2006;43:S99–S112. doi: 10.1002/hep.20973. [DOI] [PubMed] [Google Scholar]
- 10.Ong JP, Younossi ZM. Epidemiology and natural history of NAFLD and NASH. Clin Liver Dis. 2007;11:1–16. vii. doi: 10.1016/j.cld.2007.02.009. [DOI] [PubMed] [Google Scholar]
- 11.Schwimmer JB, Behling C, Newbury R, et al. Histopathology of pediatric nonalcoholic fatty liver disease. Hepatology. 2005;42:641–649. doi: 10.1002/hep.20842. [DOI] [PubMed] [Google Scholar]
- 12.Manco M, Alisi A, Nobili V. Risk of severe liver disease in NAFLD with normal ALT levels: a pediatric report. Hepatology. 2008;48:2087–2088. doi: 10.1002/hep.22631. author reply 2088. [DOI] [PubMed] [Google Scholar]
- 13.Fraser A, Longnecker MP, Lawlor DA. Prevalence of elevated alanine aminotransferase among US adolescents and associated factors: NHANES 1999-2004. Gastroenterology. 2007;133:1814–1820. doi: 10.1053/j.gastro.2007.08.077. [DOI] [PMC free article] [PubMed] [Google Scholar]
- 14.Mofrad P, Contos MJ, Haque M, et al. Clinical and histologic spectrum of nonalcoholic fatty liver disease associated with normal ALT values. Hepatology. 2003;37:1286–1292. doi: 10.1053/jhep.2003.50229. [DOI] [PubMed] [Google Scholar]
- 15.Schwimmer JB. Definitive diagnosis and assessment of risk for nonalcoholic fatty liver disease in children and adolescents. Semin Liver Dis. 2007;27:312–318. doi: 10.1055/s-2007-985075. [DOI] [PubMed] [Google Scholar]
- 16.Fabbrini E, Conte C, Magkos F. Methods for assessing intrahepatic fat content and steatosis. Curr Opin Clin Nutr Metab Care. 2009;12:474–481. doi: 10.1097/MCO.0b013e32832eb587. [DOI] [PubMed] [Google Scholar]
- 17.Thomsen C, Becker U, Winkler K, Christoffersen P, Jensen M, Henriksen O. Quantification of liver fat using magnetic resonance spectroscopy. Magn Reson Imaging. 1994;12:487–495. doi: 10.1016/0730-725x(94)92543-7. [DOI] [PubMed] [Google Scholar]
- 18.Wong WF, Northrup SR, Herrick RC, Glombicki AP, Wood RP, Morrisett JD. Quantitation of lipid in biological tissue by chemical shift magnetic resonance imaging. Magn Reson Med. 1994;32:440–446. doi: 10.1002/mrm.1910320403. [DOI] [PubMed] [Google Scholar]
- 19.Yokoo T, Bydder M, Hamilton G, et al. Nonalcoholic fatty liver disease: diagnostic and fat-grading accuracy of low-flip-angle multiecho gradient-recalled-echo MR imaging at 1.5 T. Radiology. 2009;251:67–76. doi: 10.1148/radiol.2511080666. [DOI] [PMC free article] [PubMed] [Google Scholar]
- 20.Yokoo T, Shiehmorteza M, Hamilton G, et al. Estimation of hepatic proton-density fat fraction by using MR imaging at 3.0 T. Radiology. 2011;258:749–759. doi: 10.1148/radiol.10100659. [DOI] [PMC free article] [PubMed] [Google Scholar]
- 21.Hines CD, Frydrychowicz A, Hamilton G, et al. T(1) independent, T(2) (*) corrected chemical shift based fat-water separation with multi-peak fat spectral modeling is an accurate and precise measure of hepatic steatosis. J Magn Reson Imaging. 2011;33:873–881. doi: 10.1002/jmri.22514. [DOI] [PMC free article] [PubMed] [Google Scholar]
- 22.Meisamy S, Hines CD, Hamilton G, et al. Quantification of hepatic steatosis with T1-independent, T2-corrected MR imaging with spectral modeling of fat: blinded comparison with MR spectroscopy. Radiology. 2011;258:767–775. doi: 10.1148/radiol.10100708. [DOI] [PMC free article] [PubMed] [Google Scholar]
- 23.Reeder SB, Hu HH, Sirlin CB. Proton density fat-fraction: a standardized mr-based biomarker of tissue fat concentration. J Magn Reson Imaging. 2012 doi: 10.1002/jmri.23741. [DOI] [PMC free article] [PubMed] [Google Scholar]
- 24.Tang A, Tan J, Sun M, et al. Nonalcoholic Fatty Liver. MR Imaging of Liver Proton Density Fat Fraction to Assess Hepatic Steatosis. Radiology, Disease. 2013 doi: 10.1148/radiol.12120896. [DOI] [PMC free article] [PubMed] [Google Scholar]
- 25.Rehm JL, Connor EL, Wolfgram PM, Eickhoff JC, Reeder SB, Allen DB. Predicting Hepatic Steatosis in a Racially and Ethnically Diverse Cohort of Adolescent Girls. J Pediatr. 2014 doi: 10.1016/j.jpeds.2014.04.019. [DOI] [PMC free article] [PubMed] [Google Scholar]
- 26.Taylor SJ, Whincup PH, Hindmarsh PC, Lampe F, Odoki K, Cook DG. Performance of a new pubertal self-assessment questionnaire: a preliminary study. Paediatr Perinat Epidemiol. 2001;15:88–94. doi: 10.1046/j.1365-3016.2001.00317.x. [DOI] [PubMed] [Google Scholar]
- 27.Keskin M, Kurtoglu S, Kendirci M, Atabek ME, Yazici C. Homeostasis model assessment is more reliable than the fasting glucose/insulin ratio and quantitative insulin sensitivity check index for assessing insulin resistance among obese children and adolescents. Pediatrics. 2005;115:e500–e503. doi: 10.1542/peds.2004-1921. [DOI] [PubMed] [Google Scholar]
- 28.The fourth report on the diagnosis, evaluation, and treatment of high blood pressure in children and adolescents. Pediatrics. 2004;114:555–576. [PubMed] [Google Scholar]
- 29.Fernandez JR, Redden DT, Pietrobelli A, Allison DB. Waist circumference percentiles in nationally representative samples of African-sAmerican, European-American, and Mexican-American children and adolescents. J Pediatr. 2004;145:439–444. doi: 10.1016/j.jpeds.2004.06.044. [DOI] [PubMed] [Google Scholar]
- 30.Cook S, Weitzman M, Auinger P, Nguyen M, Dietz WH. Prevalence of a metabolic syndrome phenotype in adolescents: findings from the third National Health and Nutrition Examination Survey, 1988-1994. Arch Pediatr Adolesc Med. 2003;157:821–827. doi: 10.1001/archpedi.157.8.821. [DOI] [PubMed] [Google Scholar]
- 31.Calcaterra V, Klersy C, Muratori T, et al. Prevalence of metabolic syndrome (MS) in children and adolescents with varying degrees of obesity. Clin Endocrinol. 2008;68:868–872. doi: 10.1111/j.1365-2265.2007.03115.x. [DOI] [PubMed] [Google Scholar]
- 32.Brau AC, Beatty PJ, Skare S, Bammer R. Comparison of reconstruction accuracy and efficiency among autocalibrating data-driven parallel imaging methods. Magn Reson Med. 2008;59:382–395. doi: 10.1002/mrm.21481. [DOI] [PMC free article] [PubMed] [Google Scholar]
- 33.Yu H, Shimakawa A, McKenzie CA, Brodsky E, Brittain JH, Reeder SB. Multiecho water-fat separation and simultaneous R2* estimation with multifrequency fat spectrum modeling. Magn Reson Med. 2008;60:1122–1134. doi: 10.1002/mrm.21737. [DOI] [PMC free article] [PubMed] [Google Scholar]
- 34.Bydder M, Yokoo T, Hamilton G, et al. Relaxation effects in the quantification of fat using gradient echo imaging. Magn Reson Imaging. 2008;26:347–359. doi: 10.1016/j.mri.2007.08.012. [DOI] [PMC free article] [PubMed] [Google Scholar]
- 35.Yu H, Shimakawa A, Hines CD, et al. Combination of complex-based and magnitude-based multiecho water-fat separation for accurate quantification of fat-fraction. Magn Reson Med. 2011;66:199–206. doi: 10.1002/mrm.22840. [DOI] [PMC free article] [PubMed] [Google Scholar]
- 36.Liu CY, McKenzie CA, Yu H, Brittain JH, Reeder SB. Fat quantification with IDEAL gradient echo imaging: correction of bias from T(1) and noise. Magn Reson Med. 2007;58:354–364. doi: 10.1002/mrm.21301. [DOI] [PubMed] [Google Scholar]
- 37.Szczepaniak LS, Nurenberg P, Leonard D, et al. Magnetic resonance spectroscopy to measure hepatic triglyceride content: prevalence of hepatic steatosis in the general population. Am J Physiol Endocrinol Metab. 2005;288:E462–E468. doi: 10.1152/ajpendo.00064.2004. [DOI] [PubMed] [Google Scholar]
- 38.Hamilton G, Middleton MS, Bydder M, et al. Effect of PRESS and STEAM sequences on magnetic resonance spectroscopic liver fat quantification. J Magn Reson Imaging. 2009;30:145–152. doi: 10.1002/jmri.21809. [DOI] [PMC free article] [PubMed] [Google Scholar]
- 39.Bland JM, Altman DG. Statistical methods for assessing agreement between two methods of clinical measurement. Lancet. 1986;1:307–310. [PubMed] [Google Scholar]
- 40.Landis JR, Koch GG. The measurement of observer agreement for categorical data. Biometrics. 1977;33:159–174. [PubMed] [Google Scholar]
- 41.Linder K, Springer F, Machann J, et al. Relationships of body composition and liver fat content with insulin resistance in obesity-matched adolescents and adults. Obesity (Silver Spring) 2014;22:1325–1331. doi: 10.1002/oby.20685. [DOI] [PubMed] [Google Scholar]
- 42.Schwimmer JB, Pardee PE, Lavine JE, Blumkin AK, Cook S. Cardiovascular risk factors and the metabolic syndrome in pediatric nonalcoholic fatty liver disease. Circulation. 2008;118:277–283. doi: 10.1161/CIRCULATIONAHA.107.739920. [DOI] [PMC free article] [PubMed] [Google Scholar]
- 43.Alderete TL, Toledo-Corral CM, Desai P, Weigensberg MJ, Goran MI. Liver fat has a stronger association with risk factors for type 2 diabetes in african-american compared with Hispanic adolescents. J Clin Endocrinol Metab. 2013;98:3748–3754. doi: 10.1210/jc.2013-1138. [DOI] [PMC free article] [PubMed] [Google Scholar]
- 44.Pacifico L, Nobili V, Anania C, Verdecchia P, Chiesa C. Pediatric nonalcoholic fatty liver disease, metabolic syndrome and cardiovascular risk. World J Gastroenterol. 2011;17:3082–3091. doi: 10.3748/wjg.v17.i26.3082. [DOI] [PMC free article] [PubMed] [Google Scholar]
- 45.Schwimmer JB, Dunn W, Norman GJ, et al. SAFETY study: alanine aminotransferase cutoff values are set too high for reliable detection of pediatric chronic liver disease. Gastroenterology. 2010;138:1357–1364. 1364.e1351–1352. doi: 10.1053/j.gastro.2009.12.052. [DOI] [PMC free article] [PubMed] [Google Scholar]