

Abstract
Genetically encoded voltage indicators (GEVIs) can report cellular electrophysiology with high resolution in space and time. Two-photon (2P) fluorescence has been explored as a means to image voltage in tissue. Here, we used the 2P electronic excited-state lifetime to probe absolute membrane voltage in a manner that is insensitive to the protein expression level, illumination intensity, or photon detection efficiency. First, we tested several GEVIs for 2P brightness, response speed, and voltage sensitivity. ASAP1 and a previously described citrine-Arch electrochromic Förster resonance energy transfer sensor (dubbed CAESR) showed the best characteristics. We then characterized the voltage-dependent lifetime of ASAP1, CAESR, and ArcLight under voltage-clamp conditions. ASAP1 and CAESR showed voltage-dependent lifetimes, whereas ArcLight did not. These results establish 2P fluorescence lifetime imaging as a viable means of measuring absolute membrane voltage. We discuss the prospects and improvements necessary for applications in tissue.
Introduction
Neuroscientists have long sought a robust tool for optical imaging of membrane voltage in vivo (1–4). With such a tool, one could probe synaptic weights by observing subthreshold potentials in postsynaptic cells. One could also infer rules governing circuit-level function from high time-resolution maps of spiking activity in many cells. The key to achieving this goal is a good optical readout of voltage.
Thanks to recent advances in optogenetics, investigators have made significant progress toward achieving this goal. Genetically encoded voltage indicators (GEVIs) based on ArcLight (5,6), ASAP1 (7), rhodopsin derivatives (8–10), VSFP Butterfly (11), and electrochromic Förster resonance energy transfer (eFRET) (12,13) scaffolds show adequate combinations of sensitivity and speed to report action potentials in cultured neurons. Near-infrared, archaerhodopsin-derived QuasAr constructs can be paired with a blue-shifted channelrhodopsin to enable all-optical electrophysiology in vitro and in superficial cells in brain slices (8).
Optical recordings of neuronal activity in vivo have primarily relied on genetically encoded Ca2+ indicators. In small and transparent organisms such as the zebrafish (14) and C. elegans (15,16), optical sectioning is often performed by means of one-photon (1P) techniques, including light-sheet (14), structured illumination (17), confocal (16), and light-field (18) microscopies. Simultaneous voltage and Ca2+ imaging was recently demonstrated in the zebrafish heart, but the measurements obtained relied on the periodicity of the heartbeat for signal averaging (19). For larger brains that are highly scattering, two-photon (2P) approaches are preferred. In comparison with 1P excitation, 2P excitation provides better depth penetration, lower background autofluorescence, and less tissue damage (1,20,21). Recently, 2P Ca2+ imaging via GCaMP3 or GCAMP6 was paired with optical stimulation of a red-shifted channelrhodopsin (22,23) for all-optical interrogation of circuit function in vivo. 2P voltage imaging with organic voltage-sensitive dyes has been practiced for several years (1,2). 2P voltage imaging was recently combined with simultaneous 2P calcium imaging (24), and small 2P signals were obtained in vivo with the GEVI VSFP-Butterfly 1.2 (11).
Most fluorescence voltage measurements report relative changes in voltage. Accurately calibrated, or absolute, measurements of membrane voltage are confounded by variations in expression level, background autofluorescence, and signal decay by photobleaching, as well as instrument-specific variations in illumination intensity and collection efficiency. Two-wavelength ratiometric measurements help somewhat, but still require accurately calibrated illumination sources and are hindered by differential rates of photobleaching between the reporter and the reference. We previously explored the possibility of encoding absolute membrane voltage into the millisecond-timescale nonequilibrium dynamics of a rhodopsin photocycle (25), but this measurement required a complex multi-wavelength optical setup.
2P fluorescence offers the prospect of monitoring absolute voltage through the effect of voltage on electronic excited-state lifetime. The delay between absorption of the pulsed excitation photons and re-emission of the fluorescence photon depends only on the electronic structure of the fluorophore and its interactions with its local environment, including voltage. Lifetime is thus insensitive to the sources of variation that confound measurements of intensity. If voltage affects the lifetime, 2P fluorescence lifetime imaging (2P-FLIM) could provide a readout of the absolute voltage. 1P- and 2P-FLIM are routinely used for quantitative measurements, often in combination with genetically encoded sensors based on FRET (21,26–29). To our knowledge, this technique has not previously been applied to measure absolute membrane voltage.
To benchmark the field and to determine the most promising directions for future efforts, we compared the 2P photophysical and voltage-sensing attributes of the most widely used GEVIs and tested them for absolute voltage reporting.
Materials and Methods
Microscopy and electrophysiology
For a detailed description of the materials and methods used in this work, see Supporting Materials and Methods in the Supporting Material. Briefly, we built an inverted beam-scanning 2P fluorescence microscope optimized for excitation at wavelengths between 950 and 1300 nm, and for detection of fluorescence at wavelengths shorter than 775 nm (Fig. 1A). Illumination was provided by a pulsed, 120 fs laser, tunable between 680 and 1300 nm at an 80 MHz repetition rate. Fluorescence was detected on a photomultiplier tube (PMT) in photon-counting mode. Single photoelectron pulses were digitized and detected using a computer-controlled data acquisition system. Simultaneously, fluorescence lifetime measurements were performed with the use of a time-correlated single-photon-counting (TCSPC) unit.
Figure 1.

Voltage imaging with 2P fluorescence. (A) A beam-scanning 2P microscope. Laser pulses with a duration of ∼120 fs and tunable wavelength between 950 and 1300 nm were directed into the back aperture of a 60× 1.2 NA water immersion objective via scanning mirrors. Fluorescence at wavelengths shorter than 775 nm was detected by imaging the objective back aperture onto a PMT in a cooled housing. (B) Top: single frame from a movie acquired in raster-scan mode of a HEK cell expressing ASAP1 (Movie S1). Middle: applied membrane voltage, 0.2 Hz step function. Bottom: raw whole-frame fluorescence, sampled at 6 Hz. (C) Top: image of a HEK cell expressing ASAP1, with the contour scan superimposed in red (Movie S2). Middle: applied membrane voltage, 5 Hz step function, 1 Hz ramp function. Bottom: raw fluorescence integrated over the contour, sampled at 500 Hz. Scale bars, 10 μm. To see this figure in color, go online.
We coupled a patch-clamp amplifier to the setup to obtain electrophysiological and optical measurements simultaneously. The electrophysiology and optical measurements were synchronized via custom software written in LabView and MATLAB (The MathWorks, Natick, MA).
Cell culture
Experiments were performed in HEK293T cells and in cultured rat hippocampal neurons. HEK cells were grown and transfected according to standard protocols (8,30). P0 hippocampal neurons were cultured in neurobasal-based medium on preestablished glial monolayers as described previously (8,31–33) and transfected according to the calcium phosphate transfection protocol (34). All animal experiments were approved by the Harvard Institutional Animal Care and Use Committee.
Results
2P voltage imaging
We acquired 2P fluorescence images of HEK cells expressing ASAP1 and simultaneously varied the membrane voltage via a patch pipette (Fig. 1B; Movie S1). In initial experiments, we used raster-scan imaging of a rectangular field of view. Fluorescence values were integrated over each frame. At a 6 Hz frame rate, the voltage-equivalent fluorescence noise was 10 mV for a cell expressing ASAP1.
Several factors conspire to limit the time resolution of 2P voltage imaging. To acquire adequate photon counts, one must be able to ensure sufficient integration time at the signal-generating pixels. At faster frame rates, photon shot noise degrades the signal/noise ratio (SNR). Increasing the illumination intensity helps with shot noise but leads to increased photodamage and photobleaching. As a practical matter, frame rates can also be limited by either maximum galvo acceleration or maximum laser power.
Raster scanning is inefficient for voltage imaging because the laser spot spends most of its time either outside or inside the cell, while voltage-dependent fluorescence comes predominantly from the cell membrane (Fig. S1). For a cell with a diameter of 10 μm, imaged in an equatorial plane with a pixel size of 600 nm diameter, the ratio of the number of voltage-insensitive intracellular pixels to voltage-sensitive membrane pixels is ∼330:1. Thus, one can achieve a large gain in signal by keeping the laser on the cell membrane.
To minimize photobleaching, the measurement should be distributed over as many reporter molecules as possible. Thus, it is better to scan the laser around the membrane than to park it at a single spot. Similar principles are well established in the context of 2P optogenetic stimulation, with resonant scanners most commonly tracing a line, spiral, or circle (23,35), or acousto-optic deflectors tracing an arbitrary pattern (36). To maximize the amount of membrane protein interrogated, we adopted a contour-scanning approach (Fig. 1C; Movie S2). The galvos were programmed to trace a cell membrane at a 500 Hz repetition rate. In a HEK cell expressing ASAP1, fluorescence traces reported membrane voltage with a voltage-equivalent noise of 17 mV in a 2 ms integration bin on a single-trial basis, which is a far better performance than was achieved in the raster-scan mode.
Signal-generating pixels are illuminated with a higher duty cycle in contour-scan mode than in raster-scan mode. Thus, the increased time resolution of contour-scan mode comes at the cost of an increased photobleaching rate. In raster-scan mode the photobleaching lifetime (time to 50% of initial intensity) of ASAP1 was tbleach = 30 s, whereas in contour-scan mode the photobleaching lifetime was tbleach = 1 s. For a fixed laser intensity, the photobleaching rate is inversely proportional to the number of diffraction-limited spots in the scan. In raster-scan mode there were ∼2.5 × 10⁴ spots in the image, whereas in contour-scan mode there were only ∼100 spots in the contour.
Probe comparison: intensiometric voltage imaging
We compared the 2P voltage-sensing properties of several GEVIs: ArcLight A242 (5), QuasAr1-mOrange (8), QuasAr2-eGFP (8), ASAP1 (7), and a citrine-QuasAr2 eFRET construct that we dubbed citrine-Arch eFRET sensor (CAESR) (12) (Fig. 2; Table 1).
Figure 2.

Comparison of GEVIs for 2P voltage detection. (A–E) Raster-scanned 2P images of HEK cells expressing (A) ArcLight A242, (B) CAESR, (C) QuasAr1, (D) QuasAr2, and (E) ASAP1. For ArcLight, CAESR, and ASAP1, the image is of the fluorescence of the probe itself, excited with the wavelength that is also used for the voltage-sensitive measurements. For the QuasAr constructs, the image is of a bright fluorescent protein (QuasAr1: mOrange λexc = 1080 nm, QuasAr2: eGFP, λexc = 950 nm) fused to the QuasAr construct to facilitate cell selection. Scale bars, 10 μm. (F–J) ΔF/F in 2P excitation of (F) ArcLight A242, (G) CAESR, (H) QuasAr1, (I) QuasAr2, and (J) ASAP1. (K) Comparison of brightness between the tested GEVIs. (L and M) Fluorescence as a function of membrane voltage for (L) QuasAr2 and (M) ASAP1, recorded for voltages increasing and decreasing with time. The fluorescence shows some hysteresis depending on the direction of the voltage sweep. To see this figure in color, go online.
Table 1.
Photophysical Properties of Common GEVIs for 2P Voltage Imaging
| Construct | λexc (nm) | λem (nm) | ΔF/F per 100 mVa | Brightness (counts/ms)b | Fractional Shot Noise in 1 msc | Response Time (ms)d | tbleach (s)e |
|---|---|---|---|---|---|---|---|
| ArcLight A242 | 950 | <775 | 0.08 | 20 | 0.2 | 50 (100) | 50 |
| CAESR | 968 | <775 | 0.03 | 175 | 0.08 | 5 (5) | 3 |
| QuasAr1 | 1200 | 660–775 | 0.04 ± 0.01 (n = 8) | 13 ± 10 | 0.3 | 2∗ (0.05) | 25 |
| QuasAr2 | 1200 | 660–775 | 0.08 ± 0.02 (n = 5) | 6 ± 3 | 0.4 | 10∗ (1) | 25 |
| ASAP1 | 950 | <775 | 0.23 ± 0.03 (n = 6) | 80 ± 40 | 0.1 | 2∗ (1) | 1 |
Voltage sensitivity, ΔF/F per 100 mV, was calculated by normalizing to the average of F(100 mV) and F(−100 mV) (Figs. 2 and S2).
Brightness depends on many experimental details and was determined from the average photon counts in a user-defined region of interest comprising the membrane of a highly expressing cell that was healthy enough to sustain a whole-cell patch-clamp recording.
Shot noise calculated from 1/√(counts/ms). The shot-noise limit determines the value of ΔF/F that can be detected in a 1 ms interval with an SNR of 1.
Response time (10–90%) of sensors to steps in voltage from −100 to 100 mV. Numbers in parentheses represent 1P literature values (12). Precise numerical agreement is not expected because the literature values were measured for steps between different voltages. In cases marked by an asterisk, the 2P response time was faster than the integration time, and the number given here is the integration time.
Photobleaching lifetimes are specific to the experimental conditions, so only relative values are meaningful. Photobleaching rates are further influenced by multiexponential decay, nonlinear dependence on excitation power, and ultrafast pulse-induced photophysics. The values given are for the experiments plotted in Fig. 2.
In each case, the cell was first imaged via raster scanning. For the QuasAr constructs, cells expressing protein were identified by imaging the bright fluorescent protein linked to the QuasAr (Fig. S3). The fluorescence of the plasma membrane was then recorded under contour scanning along a manually defined path around the cell. Fig. 2 shows the average fluorescence responses for steps in membrane voltage between ±100 mV. The sensitivities and response times of the reporters are given in Table 1. ASAP1 and QuasAr2 showed the best combination of voltage sensitivity and response speed, so these reporters were subjected to ramps in membrane voltage to evaluate their linearity (Fig. 2).
The apparent brightness of a reporter is sensitive to many experimental details, including the expression level, illumination intensity, choice of emission filters, and spectral response of the detector. Fig. 2K and Table 1 show the brightness values measured in our setup. Each measurement was performed with a time-average excitation power of ∼4 mW.
Photobleaching is sensitive in a nonlinear manner to details of illumination conditions that are likely to differ between setups. Furthermore, most of the sensors did not show simple single-exponential decays. The method we used to estimate photostability is described in Supporting Materials and Methods. ASAP1 started out 50-fold brighter than QuasAr2, but ASAP1 photobleached 25-fold faster to half its starting brightness (Fig. S4).
The mOrange-QuasAr2 eFRET probe showed voltage-sensitive fluorescence under 1P, but not 2P, illumination (Fig. S5). In contrast, 2P illumination of CAESR at 968 nm led to a gradual increase in voltage-sensitive fluorescence (Fig. S6). These observations illustrate that the 1P and 2P behaviors of GEVIs can be dramatically different, likely due to the complex photophysics of microbial rhodopsins. One should exercise caution in extrapolating from one measurement modality to the other.
2P imaging of action potentials
Expression levels, protein folding, and membrane trafficking can differ between neurons and HEK cells. Therefore, we expressed the two best-performing GEVIs, ASAP1 and QuasAr2, in neurons to test the possibility of detecting 2P action potentials.
We imaged neurons via wide-field single-photon epifluorescence to find cells with good protein expression (Fig. 3A), and used differential interference contrast (DIC) to assess the health of the cell membrane (Fig. 3A). Highly expressing and healthy neurons were then imaged in 2P excitation (Fig. 3A). Using whole-cell current-clamp electrophysiology, we injected current pulses to induce action potentials. Simultaneously, we scanned the laser focus along the membrane in contour-scan mode and recorded the resulting 2P fluorescence. Action potentials were not detectable with QuasAr2. ASAP1 reported action potentials at the single-trial level with an SNR of 1. Averaging three temporally registered action potentials made the AP clearly resolvable in the photon trace (Fig. 3B). From the marginal SNR in vitro, we deemed the ASAP1 signal unlikely to be robustly useful in vivo for detecting neuronal action potentials. Modest improvements in the brightness or voltage sensitivity of this construct could change that assessment.
Figure 3.

Detecting neuronal action potentials with 2P excitation. (A) Top: rat hippocampal neuron expressing ASAP1, imaged in 1P fluorescence to assess the protein expression level. Middle: cell imaged in DIC to assess cell health. The culture dish was then transferred to the 2P microscope. Bottom: cell imaged in 2P fluorescence. (B) 2P fluorescence versus time during action potentials elicited by current injection from a patch pipette. The perimeter of the soma was imaged in contour-scan mode and the fluorescence was recorded at 500 Hz. Red, voltage recording; gray, individual fluorescence recordings with an SNR of 1; black, average of three consecutive optical recordings. To see this figure in color, go online.
Lifetime
The ability of a GEVI to report voltage through the excited-state lifetime depends on the physical mechanism of voltage sensing. Voltage can affect fluorescence by acting in either the ground state (e.g., by changing the ground-state absorption spectrum) or the electronic excited state (e.g., by changing the branching ratio between fluorescence and nonradiative decay). In the former scenario, voltage will not affect lifetime, whereas in the latter it will.
When voltage affects the rate of nonradiative decay, the excited-state lifetime is
where kfl is the fluorescence emission rate and knr(V) is the nonradiative decay rate. The fluorescence quantum yield (QY), proportional to steady-state fluorescence, is
Thus, in the case of voltage-dependent excited-state dynamics, one would expect the steady-state fluorescence and excited-state lifetime to have the same functional dependence on voltage. From steady-state fluorescence alone, one cannot determine a priori whether a GEVI will show a voltage-dependent excited-state lifetime.
We used TCSPC to probe the electronic excited-state lifetime. This measurement is independent of the number of probe molecules that are still active. Due to the severity of photobleaching in 2P measurements, lifetime is an attractive alternative to intensity measurements.
We constructed a TCSPC system to measure the delay between the excitation pulse and the emitted photons (Fig. 4 A). Briefly, a reference pulse synchronized with the laser excitation is detected by a fast photodiode. A photon emitted by the probe is detected on a PMT operated in single-photon Geiger mode. A fast start-stop timer records the time delay between these two events. A histogram of these time delays gives a distribution (Fig. 4B) that can be fitted to an exponential decay to obtain the excited-state lifetime.
Figure 4.

Apparatus for measuring 2P fluorescence lifetime. (A) Lifetime is detected via TCSPC. Two synchronized femtosecond pulses are emitted by the laser: one is detected on a fast photodiode and the other excites a fluorescent protein whose emission is detected on a PMT. The difference in arrival time between the reference and fluorescence is the lifetime for this excitation. (B) Histograms of the arrival times can be fitted to obtain the mean excited-state lifetime. The instrument response function is 600 ps.
Probe comparison: absolute voltage detection through lifetime imaging
The excited-state lifetime of QuasAr2 was shorter than the instrument response function of 0.6 ns, and thus could not be accurately measured (Fig. 4B). The lifetimes of the other probes were observable and distinguishable. At a membrane voltage of 0 V, the lifetimes of ASAP1, ArcLight A242, and CAESR were 1.8 ns, 2.5 ns, and 2.7 ns, respectively. These values are not corrected for the instrument response time.
We measured the voltage-dependent lifetimes of ArcLight A242, ASAP1, and CAESR. We anticipated that CAESR would have a voltage-dependent lifetime due to its hypothesized mechanism of action (a voltage-dependent change in the rhodopsin absorption spectrum leads to voltage-dependent nonradiative quenching of the citrine fluorescence (12)). For the other two constructs, we did not know what to expect.
We expressed the constructs in HEK cells and used whole-cell voltage clamp to apply the voltage trace shown in Fig. 5A (top) while simultaneously monitoring the fluorescence and excited-state lifetime. The steady-state fluorescence of CAESR reported the voltage steps superimposed on a photobleaching baseline (Fig. 5A, middle). The lifetime of CAESR was insensitive to photobleaching, illustrating the potential use of lifetime for absolute voltage measurements (Fig. 5A, bottom).
Figure 5.

The 2P fluorescence lifetime encodes the absolute voltage. (A) Membrane voltage of a HEK cell expressing CAESR was modulated in 1 s intervals. The fluorescence intensity varied with voltage on top of a rapidly bleaching baseline. The fluorescence lifetime reports changes in voltage without drift in the average value. (B) The lifetime of CAESR can be calibrated to an absolute value of membrane voltage and reported voltage with a sensitivity of Δτ = −0.09 ns per 100 mV. The noise-equivalent voltage was 20 mV in a 1 s bandwidth. (C) The ASAP1 fluorescence lifetime reported absolute voltage with a sensitivity of Δτ = −0.14 ns per 100 mV between ±70 mV, but saturated toward the edges. The noise-equivalent voltage was 30 mV in a 1 s bandwidth. (D) The fluorescence lifetime of ArcLight A242 did not show a discernible dependence on voltage. To see this figure in color, go online.
The fluorescence lifetime of CAESR reported voltage with good linearity and a sensitivity of Δτ = −0.09 ns per 100 mV (Fig. 5B) between ±100 mV. ASAP1 also showed a voltage-dependent lifetime, with Δτ = −0.14 ns per 100 mV (Fig. 5C) between ±70 mV, but saturated at the extremes. The lifetime of ArcLight A242 (Fig. 5D) did not show a detectable dependence on membrane voltage. These observations imply that in ASAP1, voltage acts in the electronic excited state, but in ArcLight A242, it acts in the electronic ground state. A recently introduced voltage-sensitive dye, VF2.1.Cl (37), also showed a voltage-dependent 2P excited-state lifetime, with τ(0 mV) = 3.16 ns and Δτ = 0.11 ns per 100 mV, consistent with the proposed mechanism of voltage-dependent quenching of the electronic excited state.
In lifetime measurements with CAESR, the voltage-equivalent noise was 20 mV in a 1 s bandwidth. Thus, a brighter or more sensitive reporter is needed for high-time-resolution measurements, e.g., of neuronal or cardiac action potentials. Existing reporters offer adequate sensitivity to measure resting potential or slow modulatory changes. We propose the name 2P absolute contrast lifetime image voltage sensing (2PAC LIVS) for this technique.
Discussion
2P voltage imaging offers the possibility of recording electrical activity in tissue, as well as measuring absolute membrane voltage via its effect on the excited-state lifetime. However, at present, both applications have limited sensitivity and are confounded by photobleaching. The sensitivity of 2PAC LIVS is only 20 mV in a 1 s bandwidth. Thus, this technique might be appropriate for measuring slow variations in resting voltage, but it is not appropriate for measuring fast dynamics. Here, we consider the prospects for improving both the molecular reporters and the instrumentation.
2P voltage imaging places severe demands on the brightness and photostability of the molecular reporters. Fig. 6 compares the signal sources for Ca2+ imaging and voltage imaging, in both 1P and 2P imaging modalities. 2P voltage imaging acquires signal from ∼100-fold fewer molecules and requires an ∼100-fold higher time resolution compared with 2P Ca2+ imaging (Supporting Materials and Methods). Thus, to achieve a similar SNR, 2P voltage imaging requires an excitation rate per molecule, Γ, that is ∼104-fold higher than that required for 2P Ca2+ imaging. Photobleaching rates grow as Γα, with the exponent α ≥ 1 (38,39). Thus, even if the brightness, signal amplitude, and photostability were similar between the voltage and Ca2+ reporters, achieving 2P voltage imaging with the same SNR as 2P Ca2+ imaging would lead to an ∼104-fold faster photobleaching rate.
Figure 6.
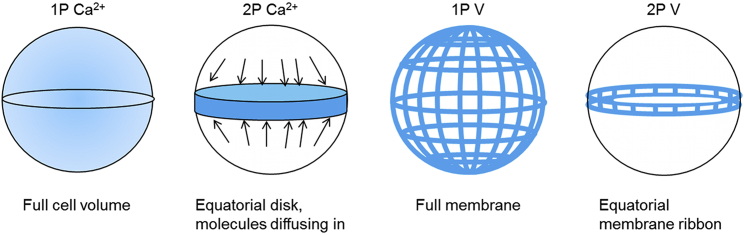
Comparison of the number and location of probes that contributed to calcium and voltage detection in 1P and 2P excitation. For a given signal rate (photons/s), the rate of photobleaching is inversely proportional to the number of reporter molecules that contribute to this signal. In 1P epifluorescence Ca2+ imaging, the signal comes from the 3D bulk of the cell. In 2P Ca2+ imaging, the signal comes from molecules within a single focal plane. However, relatively fast cytoplasmic diffusion replenishes photobleached molecules, leading to an effective sampling volume close to the 3D bulk. In 1P epifluorescence voltage imaging, voltage-dependent signals can come from the whole-cell membrane. In 2P voltage imaging, only molecules at the equator contribute signal. Diffusion of GEVIs in the lipid membrane is too slow to replace photobleached molecules on an experimentally relevant timescale. For equal count rates of signal-bearing photons, 2P voltage imaging will experience a higher photobleaching rate than 2P Ca2+ imaging.To see this figure in color, go online.
Considering the limited scope for improvements in the photostability and brightness of GFP-based reporters, we conclude that progress toward achieving 2P voltage imaging with these probes must rely on improvements in voltage sensitivity and speed. For example, the response time of ASAP1 leads to modest low-pass filtering of neuronal action potentials. An increased speed of response would enhance the ASAP1 signal for action potential detection. Another route would be to develop probes with scaffolds that are not based on GFP or its homologs. QuasAr2, for instance, has sufficient photostability and sensitivity, but is not bright enough for 2P detection of neuronal action potentials.
Improvements in optics could facilitate 2P voltage imaging by enabling near-simultaneous sampling of a larger portion of the cell membrane. To increase the number of molecules that contribute to the signal, one should increase the area of the membrane that contributes. A simple strategy may be to decrease the numerical aperture of the excitation beam, thereby increasing the Rayleigh length and the length of the 2P excitation spot. Around the cellular equator, a longer spot would sample molecules at a greater range of latitudes. The attendant increase in beam width would necessitate an increase in laser power.
In principle, one could further decrease the photobleaching rate while maintaining the signal by scanning the laser in a 3D trajectory over the cell membrane. This approach is technically challenging because one must first map the cell surface with high resolution and then scan rapidly while simultaneously rapidly modulating the focal plane. However, rapid 3D scanning 2P systems have been developed to address this issue (36,40).
Neither the molecular nor the instrumentation routes toward 2P voltage imaging or FLIM are exceedingly promising, particularly if one seeks to apply these techniques in tissue or in vivo. Practical voltage imaging in tissue will likely require alternative imaging schemes such as light-sheet or 1P structured illumination (41–43), photoacoustic or photothermal imaging (44,45), and light-gated voltage integrators (46).
Conclusions
We have shown the potential of 2P detection of membrane voltage in two modalities: detection of relative changes in the fluorescence intensity and detection of absolute voltage in the fluorescence lifetime. Although the 2P fluorescence brightness of the current generation of GEVIs is too low to allow recordings of single-trial action potentials, measurements obtained with a slower time resolution are feasible. Detection of the fluorescence lifetime provides a measure of absolute voltage that is not biased by photobleaching.
Author Contributions
D.B. and A.E.C. designed research. D.B. performed research. D.B. and A.E.C. wrote the manuscript. All of the authors contributed analytic tools and analyzed data.
Acknowledgments
We thank Guiping Wang, Hohjai Lee, Vaibhav Joshi, and Katherine Williams for technical assistance. We also thank Peng Zou for the CAESR plasmid, Michael Z. Lin for ASAP1, Vincent Pieribone for ArcLight, and Evan Miller for samples of VF2.1.Cl.
This work was supported by a Presidential Early Career Award for Scientists and Engineers (N00014-11-1-0549), National Institutes of Health grants R01EB012498-02 and DP2OD007428, the Gordon and Betty Moore Foundation, and the Howard Hughes Medical Institute. D.B. received a Rubicon grant from the Netherlands Organization for Scientific Research.
Editor: Hagan Bayley.
Footnotes
Supporting Materials and Methods, Supporting Discussion, six figures, and two movies are available at http://www.biophysj.org/biophysj/supplemental/S0006-3495(15)00773-0.
Supporting Material
The membrane voltage was stepped according to the function depicted in Fig. 1. Frames were recorded at 6 Hz.
The membrane voltage was modulated according to the function depicted in Fig. 1. The time-dependent voltage signal is overlaid on a static raster-scan image of the cell. The first few cycles were omitted from the movie due to rapid initial photobleaching.
References
- 1.Fisher J.A., Barchi J.R., Salzberg B.M. Two-photon excitation of potentiometric probes enables optical recording of action potentials from mammalian nerve terminals in situ. J. Neurophysiol. 2008;99:1545–1553. doi: 10.1152/jn.00929.2007. [DOI] [PubMed] [Google Scholar]
- 2.Acker C.D., Yan P., Loew L.M. Single-voxel recording of voltage transients in dendritic spines. Biophys. J. 2011;101:L11–L13. doi: 10.1016/j.bpj.2011.06.021. [DOI] [PMC free article] [PubMed] [Google Scholar]
- 3.Cohen L.B., Salzberg B.M., Wang C.H. Changes in axon fluorescence during activity: molecular probes of membrane potential. J. Membr. Biol. 1974;19:1–36. doi: 10.1007/BF01869968. [DOI] [PubMed] [Google Scholar]
- 4.Salzberg B.M., Grinvald A., Ross W.N. Optical recording of neuronal activity in an invertebrate central nervous system: simultaneous monitoring of several neurons. J. Neurophysiol. 1977;40:1281–1291. doi: 10.1152/jn.1977.40.6.1281. [DOI] [PubMed] [Google Scholar]
- 5.Jin L., Han Z., Pieribone V.A. Single action potentials and subthreshold electrical events imaged in neurons with a fluorescent protein voltage probe. Neuron. 2012;75:779–785. doi: 10.1016/j.neuron.2012.06.040. [DOI] [PMC free article] [PubMed] [Google Scholar]
- 6.Piao H.H., Rajakumar D., Baker B.J. Combinatorial mutagenesis of the voltage-sensing domain enables the optical resolution of action potentials firing at 60 Hz by a genetically encoded fluorescent sensor of membrane potential. J. Neurosci. 2015;35:372–385. doi: 10.1523/JNEUROSCI.3008-14.2015. [DOI] [PMC free article] [PubMed] [Google Scholar]
- 7.St-Pierre F., Marshall J.D., Lin M.Z. High-fidelity optical reporting of neuronal electrical activity with an ultrafast fluorescent voltage sensor. Nat. Neurosci. 2014;17:884–889. doi: 10.1038/nn.3709. [DOI] [PMC free article] [PubMed] [Google Scholar]
- 8.Hochbaum D.R., Zhao Y., Cohen A.E. All-optical electrophysiology in mammalian neurons using engineered microbial rhodopsins. Nat. Methods. 2014;11:825–833. doi: 10.1038/nmeth.3000. [DOI] [PMC free article] [PubMed] [Google Scholar]
- 9.Flytzanis N.C., Bedbrook C.N., Gradinaru V. Archaerhodopsin variants with enhanced voltage-sensitive fluorescence in mammalian and Caenorhabditis elegans neurons. Nat. Commun. 2014;5:4894. doi: 10.1038/ncomms5894. [DOI] [PMC free article] [PubMed] [Google Scholar]
- 10.Gong Y., Li J.Z., Schnitzer M.J. Enhanced archaerhodopsin fluorescent protein voltage indicators. PLoS One. 2013;8:e66959. doi: 10.1371/journal.pone.0066959. [DOI] [PMC free article] [PubMed] [Google Scholar]
- 11.Akemann W., Sasaki M., Knöpfel T. Two-photon voltage imaging using a genetically encoded voltage indicator. Sci. Rep. 2013;3:2231. doi: 10.1038/srep02231. [DOI] [PMC free article] [PubMed] [Google Scholar]
- 12.Zou P., Zhao Y., Cohen A.E. Bright and fast multicoloured voltage reporters via electrochromic FRET. Nat. Commun. 2014;5:4625. doi: 10.1038/ncomms5625. [DOI] [PMC free article] [PubMed] [Google Scholar]
- 13.Gong Y., Wagner M.J., Schnitzer M.J. Imaging neural spiking in brain tissue using FRET-opsin protein voltage sensors. Nat. Commun. 2014;5:3674. doi: 10.1038/ncomms4674. [DOI] [PMC free article] [PubMed] [Google Scholar]
- 14.Ahrens M.B., Orger M.B., Keller P.J. Whole-brain functional imaging at cellular resolution using light-sheet microscopy. Nat. Methods. 2013;10:413–420. doi: 10.1038/nmeth.2434. [DOI] [PubMed] [Google Scholar]
- 15.Guo Z.V., Hart A.C., Ramanathan S. Optical interrogation of neural circuits in Caenorhabditis elegans. Nat. Methods. 2009;6:891–896. doi: 10.1038/nmeth.1397. [DOI] [PMC free article] [PubMed] [Google Scholar]
- 16.Leifer A.M., Fang-Yen C., Samuel A.D.T. Optogenetic manipulation of neural activity in freely moving Caenorhabditis elegans. Nat. Methods. 2011;8:147–152. doi: 10.1038/nmeth.1554. [DOI] [PMC free article] [PubMed] [Google Scholar]
- 17.York A.G., Parekh S.H., Shroff H. Resolution doubling in live, multicellular organisms via multifocal structured illumination microscopy. Nat. Methods. 2012;9:749–754. doi: 10.1038/nmeth.2025. [DOI] [PMC free article] [PubMed] [Google Scholar]
- 18.Prevedel R., Yoon Y.G., Vaziri A. Simultaneous whole-animal 3D imaging of neuronal activity using light-field microscopy. Nat. Methods. 2014;11:727–730. doi: 10.1038/nmeth.2964. [DOI] [PMC free article] [PubMed] [Google Scholar]
- 19.Hou J.H., Kralj J.M., Cohen A.E. Simultaneous mapping of membrane voltage and calcium in zebrafish heart in vivo reveals chamber-specific developmental transitions in ionic currents. Front. Physiol. 2014;5:344. doi: 10.3389/fphys.2014.00344. [DOI] [PMC free article] [PubMed] [Google Scholar]
- 20.Denk W., Strickler J.H., Webb W.W. Two-photon laser scanning fluorescence microscopy. Science. 1990;248:73–76. doi: 10.1126/science.2321027. [DOI] [PubMed] [Google Scholar]
- 21.Svoboda K., Yasuda R. Principles of two-photon excitation microscopy and its applications to neuroscience. Neuron. 2006;50:823–839. doi: 10.1016/j.neuron.2006.05.019. [DOI] [PubMed] [Google Scholar]
- 22.Rickgauer J.P., Deisseroth K., Tank D.W. Simultaneous cellular-resolution optical perturbation and imaging of place cell firing fields. Nat. Neurosci. 2014;17:1816–1824. doi: 10.1038/nn.3866. [DOI] [PMC free article] [PubMed] [Google Scholar]
- 23.Packer A.M., Russell L.E., Häusser M. Simultaneous all-optical manipulation and recording of neural circuit activity with cellular resolution in vivo. Nat. Methods. 2015;12:140–146. doi: 10.1038/nmeth.3217. [DOI] [PMC free article] [PubMed] [Google Scholar]
- 24.Crocini C., Coppini R., Sacconi L. Defects in T-tubular electrical activity underlie local alterations of calcium release in heart failure. Proc. Natl. Acad. Sci. USA. 2014;111:15196–15201. doi: 10.1073/pnas.1411557111. [DOI] [PMC free article] [PubMed] [Google Scholar]
- 25.Hou J.H., Venkatachalam V., Cohen A.E. Temporal dynamics of microbial rhodopsin fluorescence reports absolute membrane voltage. Biophys. J. 2014;106:639–648. doi: 10.1016/j.bpj.2013.11.4493. [DOI] [PMC free article] [PubMed] [Google Scholar]
- 26.Yasuda R., Harvey C.D., Svoboda K. Supersensitive Ras activation in dendrites and spines revealed by two-photon fluorescence lifetime imaging. Nat. Neurosci. 2006;9:283–291. doi: 10.1038/nn1635. [DOI] [PubMed] [Google Scholar]
- 27.Coda S., Thompson A.J., Dunsby C. Fluorescence lifetime spectroscopy of tissue autofluorescence in normal and diseased colon measured ex vivo using a fiber-optic probe. Biomed. Opt. Express. 2014;5:515–538. doi: 10.1364/BOE.5.000515. [DOI] [PMC free article] [PubMed] [Google Scholar]
- 28.Robinson T., Valluri P., de Mello A.J. Analysis of DNA binding and nucleotide flipping kinetics using two-color two-photon fluorescence lifetime imaging microscopy. Anal. Chem. 2014;86:10732–10740. doi: 10.1021/ac502732s. [DOI] [PubMed] [Google Scholar]
- 29.Ebrecht R., Don Paul C., Wouters F.S. Fluorescence lifetime imaging microscopy in the medical sciences. Protoplasma. 2014;251:293–305. doi: 10.1007/s00709-013-0598-4. [DOI] [PubMed] [Google Scholar]
- 30.Kralj J.M., Douglass A.D., Cohen A.E. Optical recording of action potentials in mammalian neurons using a microbial rhodopsin. Nat. Methods. 2012;9:90–95. doi: 10.1038/nmeth.1782. [DOI] [PMC free article] [PubMed] [Google Scholar]
- 31.McCarthy K.D., de Vellis J. Preparation of separate astroglial and oligodendroglial cell cultures from rat cerebral tissue. J. Cell Biol. 1980;85:890–902. doi: 10.1083/jcb.85.3.890. [DOI] [PMC free article] [PubMed] [Google Scholar]
- 32.Goslin K. MIT Press; Cambridge, MA: 1998. Culturing Nerve Cells. [Google Scholar]
- 33.Chen G., Harata N.C., Tsien R.W. Paired-pulse depression of unitary quantal amplitude at single hippocampal synapses. Proc. Natl. Acad. Sci. USA. 2004;101:1063–1068. doi: 10.1073/pnas.0307149101. [DOI] [PMC free article] [PubMed] [Google Scholar]
- 34.Jiang M., Chen G. High Ca2+-phosphate transfection efficiency in low-density neuronal cultures. Nat. Protoc. 2006;1:695–700. doi: 10.1038/nprot.2006.86. [DOI] [PubMed] [Google Scholar]
- 35.Rickgauer J.P., Tank D.W. Two-photon excitation of channelrhodopsin-2 at saturation. Proc. Natl. Acad. Sci. USA. 2009;106:15025–15030. doi: 10.1073/pnas.0907084106. [DOI] [PMC free article] [PubMed] [Google Scholar]
- 36.Duemani Reddy G., Kelleher K., Saggau P. Three-dimensional random access multiphoton microscopy for functional imaging of neuronal activity. Nat. Neurosci. 2008;11:713–720. doi: 10.1038/nn.2116. [DOI] [PMC free article] [PubMed] [Google Scholar]
- 37.Miller E.W., Lin J.Y., Tsien R.Y. Optically monitoring voltage in neurons by photo-induced electron transfer through molecular wires. Proc. Natl. Acad. Sci. USA. 2012;109:2114–2119. doi: 10.1073/pnas.1120694109. [DOI] [PMC free article] [PubMed] [Google Scholar]
- 38.Patterson G.H., Piston D.W. Photobleaching in two-photon excitation microscopy. Biophys. J. 2000;78:2159–2162. doi: 10.1016/S0006-3495(00)76762-2. [DOI] [PMC free article] [PubMed] [Google Scholar]
- 39.Chen T.S., Zeng S.Q., Zhou W. High-order photobleaching of green fluorescent protein inside live cells in two-photon excitation microscopy. Biochem. Biophys. Res. Commun. 2002;291:1272–1275. doi: 10.1006/bbrc.2002.6587. [DOI] [PubMed] [Google Scholar]
- 40.Katona G., Szalay G., Rózsa B. Fast two-photon in vivo imaging with three-dimensional random-access scanning in large tissue volumes. Nat. Methods. 2012;9:201–208. doi: 10.1038/nmeth.1851. [DOI] [PubMed] [Google Scholar]
- 41.Voie A.H., Burns D.H., Spelman F.A. Orthogonal-plane fluorescence optical sectioning: three-dimensional imaging of macroscopic biological specimens. J. Microsc. 1993;170:229–236. doi: 10.1111/j.1365-2818.1993.tb03346.x. [DOI] [PubMed] [Google Scholar]
- 42.Mertz J. Optical sectioning microscopy with planar or structured illumination. Nat. Methods. 2011;8:811–819. doi: 10.1038/nmeth.1709. [DOI] [PubMed] [Google Scholar]
- 43.Müller C.B., Enderlein J. Image scanning microscopy. Phys. Rev. Lett. 2010;104:198101. doi: 10.1103/PhysRevLett.104.198101. [DOI] [PubMed] [Google Scholar]
- 44.Wang X., Pang Y., Wang L.V. Noninvasive laser-induced photoacoustic tomography for structural and functional in vivo imaging of the brain. Nat. Biotechnol. 2003;21:803–806. doi: 10.1038/nbt839. [DOI] [PubMed] [Google Scholar]
- 45.Boyer D., Tamarat P., Orrit M. Photothermal imaging of nanometer-sized metal particles among scatterers. Science. 2002;297:1160–1163. doi: 10.1126/science.1073765. [DOI] [PubMed] [Google Scholar]
- 46.Venkatachalam V., Brinks D., Cohen A.E. Flash memory: photochemical imprinting of neuronal action potentials onto a microbial rhodopsin. J. Am. Chem. Soc. 2014;136:2529–2537. doi: 10.1021/ja411338t. [DOI] [PMC free article] [PubMed] [Google Scholar]
Associated Data
This section collects any data citations, data availability statements, or supplementary materials included in this article.
Supplementary Materials
The membrane voltage was stepped according to the function depicted in Fig. 1. Frames were recorded at 6 Hz.
The membrane voltage was modulated according to the function depicted in Fig. 1. The time-dependent voltage signal is overlaid on a static raster-scan image of the cell. The first few cycles were omitted from the movie due to rapid initial photobleaching.