
Fig. 2.
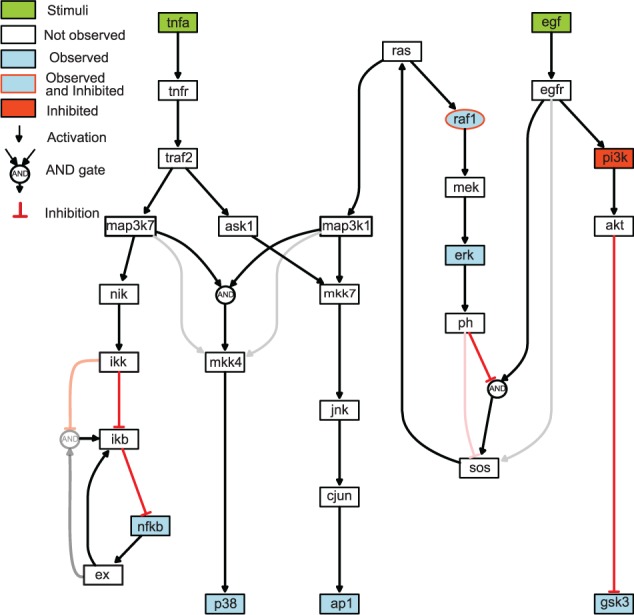
Case study 1 (synthetic signaling pathway): Hypergraph showing every possible logic gate consistent with the prior knowledge network. Strong red and dark hyperedges correspond to gates present in the original model used to generate the in silico data while grey and light red hyperedges show links not present in this model