Abstract
G protein-coupled receptors (GPCRs) are integral membrane proteins involved in cellular signaling and constitute major drug targets. Despite their importance, the relationship between structure and function of these receptors is not well understood. In this study, the role of extracellular disulfide bonds on the trafficking and ligand-binding activity of the human A2A adenosine receptor was examined. To this end, cysteine-to-alanine mutations were conducted to replace individual and both cysteines in three disulfide bonds present in the first two extracellular loops. Although none of the disulfide bonds were essential for the formation of plasma membrane-localized active GPCR, loss of the disulfide bonds led to changes in the distribution of the receptor within the cell and changes in the ligand-binding affinity. These results indicate that in contrast to many class A GPCRs, the extracellular disulfide bonds of the A2A receptor are not essential, but can modulate the ligand-binding activity, by either changing the conformation of the extracellular loops or perturbing the interactions of the transmembrane domains.
Keywords: G protein-coupled receptor, Hausdorff ratio, Extracellular loop, Agonist, Conformational stability
1. Introduction
G protein-coupled receptors (GPCRs) are heptahelical, integral membrane proteins involved in signal transduction. Because of their location at the plasma membrane and their importance in cellular signaling, GPCRs constitute major drug targets. Approximately 36% of drugs on the market are known to interact with GPCRs [1]. The adenosine receptors (A1, A3, A2B and A2A) are members of the family A GPCRs, and are ubiquitously expressed throughout the human body. This subfamily is one of the main targets for the treatment of neurodegenerative diseases, diabetes, cancer and heart disease [2].
The adenosine receptors (ARs) maintain a sequence homology of approximately 40%, with the highest sequence identity between A2A and A2B (46%), and A1 and A3 (46%) [3]. Despite the high sequence homology, the ARs have distinct affinities for various ligands and couple to different G proteins, whose activation regulates different membrane and intracellular proteins (e.g. adenylyl cyclase, Ca2+ channels, K+ channels, and phospholipase C) [4]. Out of the four ARs, only the A2A receptor (A2AR) expresses at high levels in heterologous systems [5] and has been extensively studied in biophysical and structural studies [6–13].
The crystal structure of A2AR identified three disulfide bonds between extracellular loop 1 (ECL1) and ECL2 of the receptor [10]. It is speculated that this extensive disulfide bond network forms a rigid structure exposing the ligand-binding pocket [10]. One of the three disulfide bonds is highly conserved among many class A GPCRs [3,10, 14], and numerous studies indicate that this disulfide bond is critical for the structural stability, expression, and function of GPCRs [14,15]. Mutations to the conserved cysteines have shown that this covalent linkage between ECL1 and ECL2 is critical for maintaining the high-affinity ligand-binding conformation of the thyrotropin-releasing hormone receptor [16], rhodopsin [17,18], µ opioid receptor [19], β2 adrenergic receptor [20,21], and A1 adenosine receptor [22], to name a few. For some GPCRs, mutating the extracellular cysteines also resulted in lower protein expression levels or reduced/abolished trafficking of the receptor to the plasma membrane. For example, mutations to the conserved cysteines in µ opioid receptor reduced the number of receptors present at the plasma membrane compared to the wild type [19]. In contrast, mutations of the cysteines in ECL1 or ECL2 of the A1 adenosine receptor resulted in a loss of receptors at the cell surface [22]. In the aforementioned examples, the conserved disulfide bond is the only covalent link between ECL1 and ECL2, and disruption of this link likely affected the topology of the ECLs and thus the ligand-binding affinity.
Previously, the role of the disulfide bonds in the A2A adenosine receptor has been investigated using reducing agents. Dithiothreitol (DTT) treated A2AR displayed reduced activity compared to the wild type A2AR [6,23]. In this study, we used a mutational approach to evaluate the role of the disulfide bond network of the human A2AR for contributing to the ligand-binding capability and the exceptional expression levels that have been previously described [7,24,25]. To this end, systematic mutations of the cysteines were conducted, revealing that the conserved disulfide bond was not essential for the trafficking and ligand-binding activity of this receptor. On the contrary, mutations to the cysteines in the ECLs of the A2AR resulted in a range of ligand-binding affinities and trafficking patterns.
2. Results
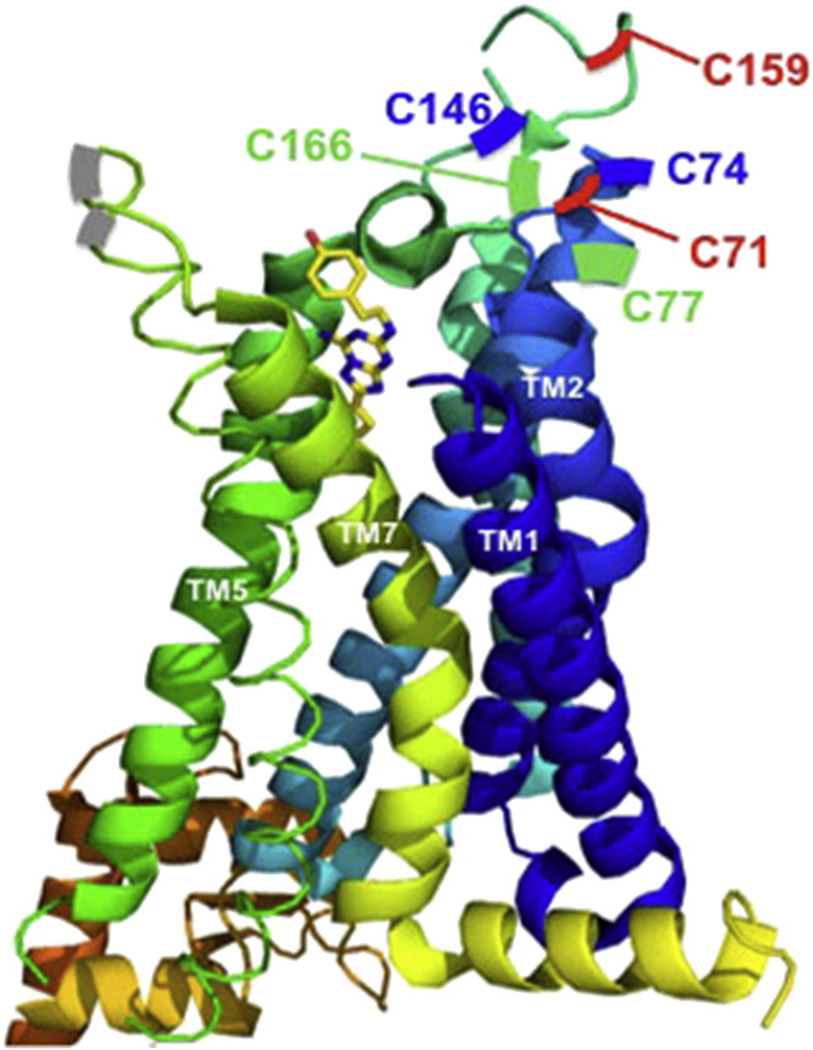
Disulfide bonds have been shown to have a critical role in protein stability, trafficking and function for many GPCRs [14–21]. To characterize the role of the specific disulfide bonds in A2AR, we created Cys-to-Ala mutations in the three disulfide bonds that join ECL1 and ECL2 (Fig. 1). Six single Cys-to-Ala and three double Cys-to-Ala constructs were created as outlined in Table 1.
Fig. 1.
Crystal structure of A2AR bound to an antagonist, ZM 241385 [10]. The cysteines that form the disulfide bonds are color coded in green, red and blue. Adapted using PyMOL (The PyMOL Molecular Graphics System, Version 1.3 Schrödinger, LLC), Protein Data Bank identification code 3EML. (For interpretation of the references to colors in this figure legend, the reader is referred to the web version of this article.)
Table 1.
List of the Cys-to-Ala constructs created to test the role of the disulfide bonds in the A2A adenosine receptor.
| Cysteine-to-alanine constructs | ||
|---|---|---|
| Single Cys-to-Ala constructs | Double Cys-to-Ala constructs | |
| ECL1 | ECL2 | ECL1 and ECL2 |
| C71A | C146A | C71A–C159A |
| C74A | C159A | C74A–C146A |
| C77A | C166A | C77A–C166A |
2.1. Trafficking patterns and fluorescent-ligand binding of A2AR wild type and Cys-to-Ala variants
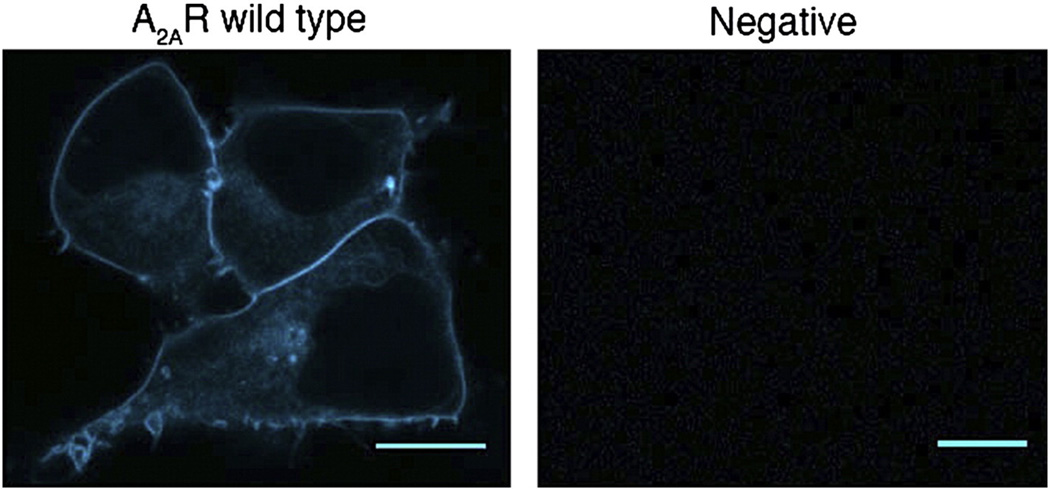
The constructs listed in Table 1 were transfected and expressed in HEK-293 cells as described in the Materials and methods section to test how the Cys-to-Ala mutations affected the trafficking of the receptor and ligand-binding activity. Trafficking refers to the receptor movement within the cell, including insertion of new receptors into the plasma membrane, internalization, recycling, and sorting of internalized receptors to lysosomes for degradation [26]. For these studies, the A2AR constructs were C-terminally tagged with the cyan fluorescent protein (CFP), and trafficking to the plasma membrane was analyzed by CFP fluorescence detection at the periphery of the cell via confocal microscopy. Fig. 2 displays the typical trafficking pattern of the wild type (WT) A2AR; a strong halo is seen at the periphery of the cell, indicating that the receptor trafficked well to the plasma membrane.
Fig. 2.
Trafficking pattern of WT A2AR and negative control. HEK-293 cells transiently transfected with wild type A2A–CFP (left) and with an empty plasmid as a negative control (right). Scale bars, 10 µm.
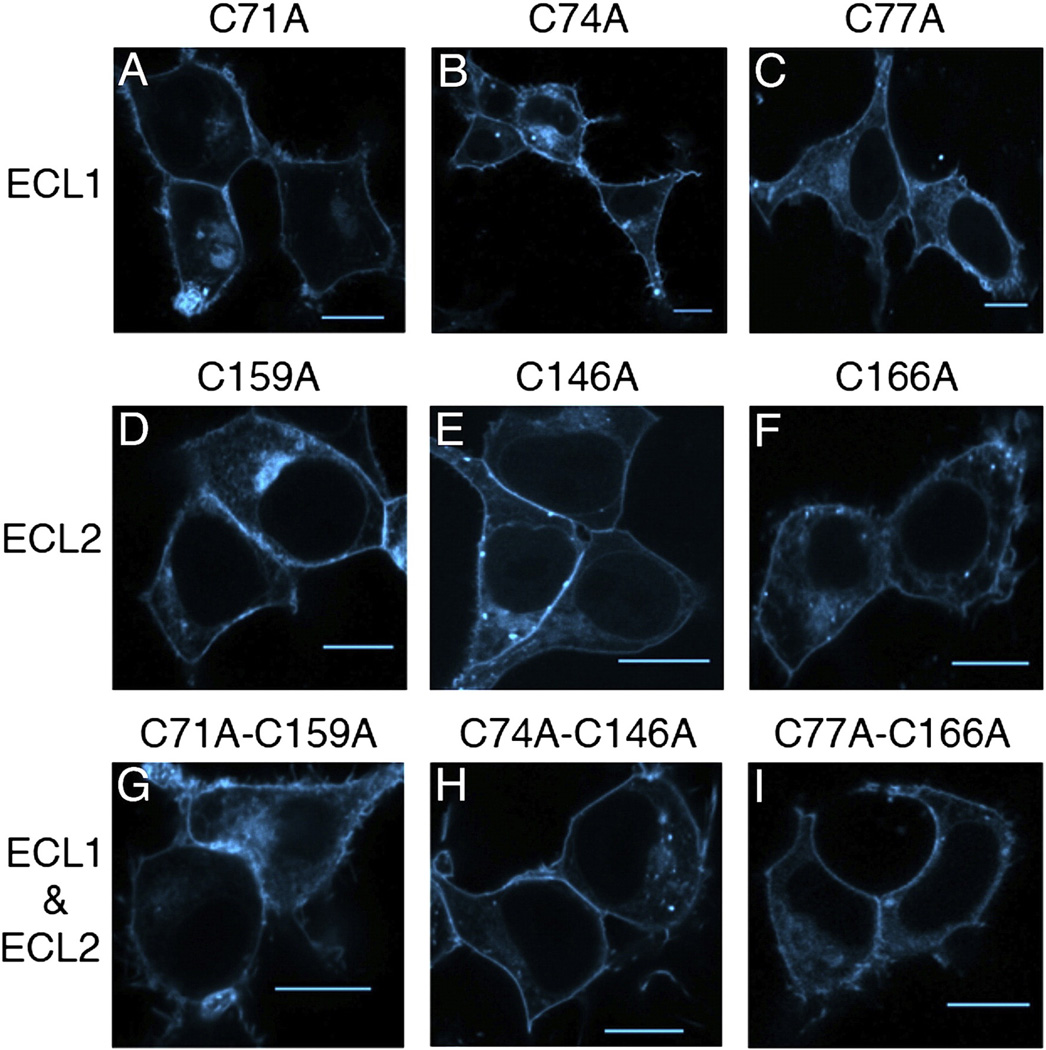
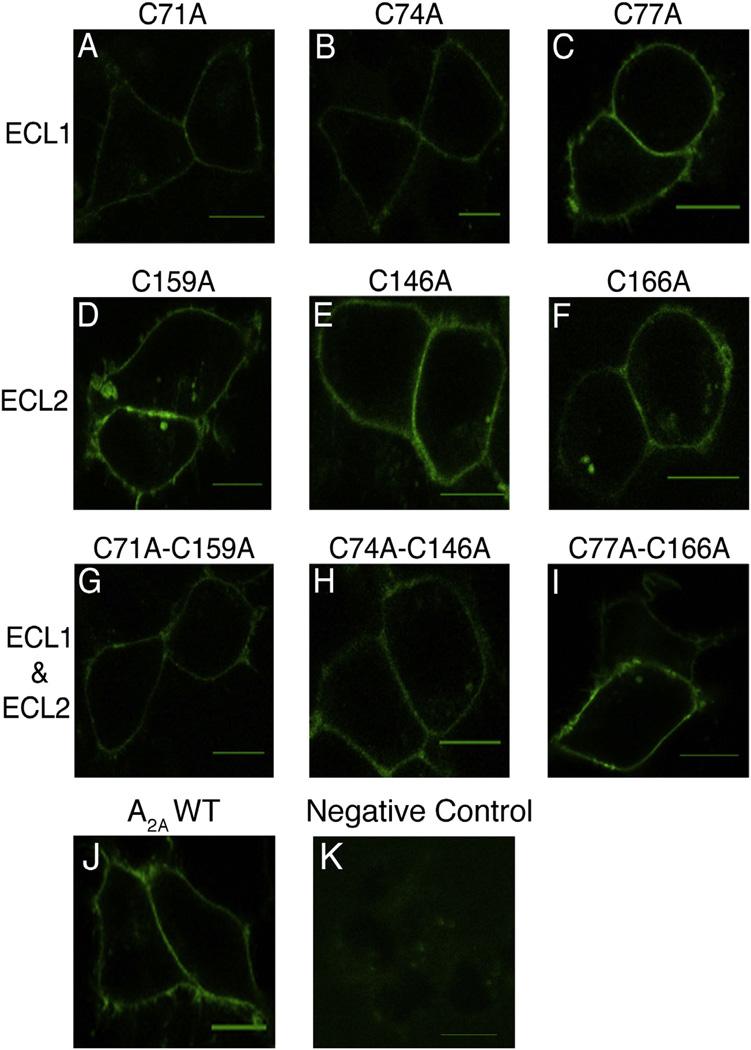
The typical expression patterns of all the Cys-to-Ala variants are displayed in Fig. 3. From these images, it appears that all A2AR variants trafficked to the plasma membrane. However, it is also evident that the internally-localized receptor population differs between the variants and the WT A2AR.
Fig. 3.
Trafficking patterns of A2AR Cys-to-Ala variants. HEK-293 cells transiently transfected with A2AR-CFP constructs. A–C) A2AR variants with mutations in the cysteines in ECL1. D–F) Variants with mutations in the cysteines in ECL2. G–I) Variants with mutations in the cysteines in ECL1 and ECL2 that correspond to the disulfide bonds. Scale bars, 10 µm.
From these images, it is not clear whether receptors present within the cell are retained in the endoplasmic reticulum (ER), in lysosomes for degradation, or are en route to the plasma membrane. However, as our focus was on proper localization of active receptor to the plasma membrane, we used the following methods to characterize the distribution of the receptors between the plasma membrane versus ER, and the activity of the receptor once it reached the cell surface:
Comparison of the distribution of the A2AR variants at the plasma membrane and at the ER using plasma membrane and ER dyes
Fluorescent–ligand (FITC-APEC) binding to further test if the receptor was at the plasma membrane and in its active form
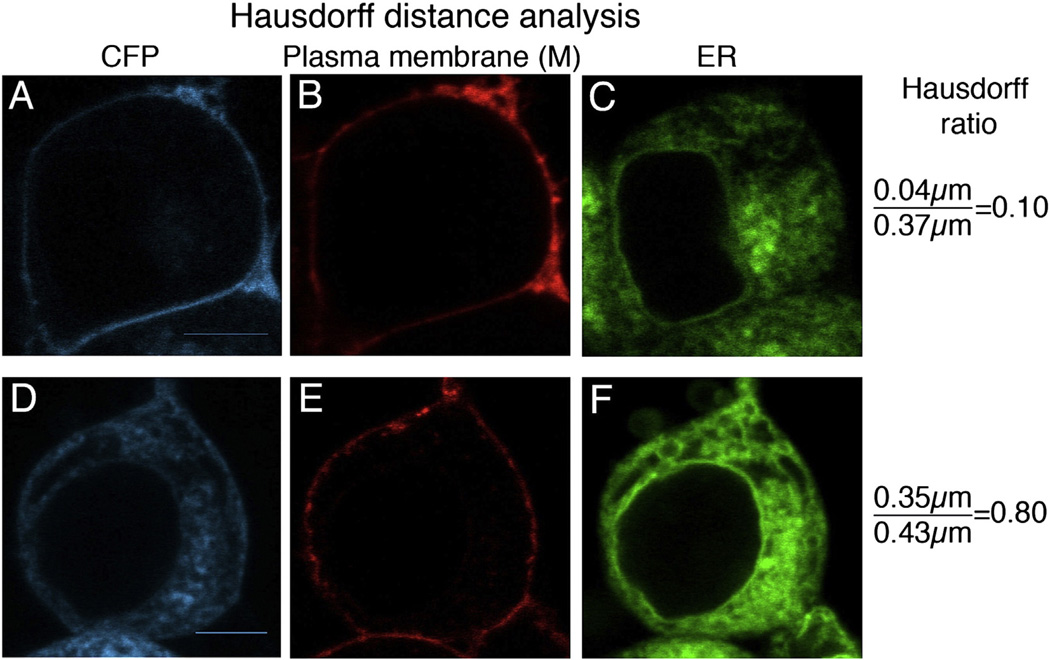
Cells were stained with plasma membrane (M) and ER dyes to compare localization of A2AR WT and the A2AR variants. At least twenty images for each A2A variant were analyzed using the Hausdorff ratio (HR), which is defined as the directed Hausdorff distance between the CFP tagged receptor and the plasma membrane divided by the directed Hausdorff distance between the ER and the plasma membrane, as described in the Materials and methods section. When this ratio is low (<0.5), it indicates that the receptor was localized primarily at the plasma membrane. Ratios close to one indicate that there was a higher ER-localized receptor population. Fig. 4 displays two examples of disparate receptor trafficking; the top image represents a cell where most of the receptor trafficked to the plasma membrane, and the bottom image represents a cell with higher levels of ER localized receptor. This difference can be seen by the clear outline of CFP at the cell periphery in Fig. 4A compared to the diffuse CFP fluorescence throughout the ER network in Fig. 4D. Comparison of the CFP fluorescence (Fig. 4A and 4D) to that of the plasma membrane dye (Fig. 4B or 4E, respectively) versus that of the fluorescence of the ER dye (Fig. 4C and 4F) to that of the membrane dye confirms this analysis. Quantitatively, these observations are reflected in the Hausdorff ratios of 0.1 for the variant that trafficked mostly to the plasma membrane, and 0.8 for the variant with higher levels of ER-localized receptor.
Fig. 4.
Analysis of receptor distribution within the plasma membrane and ER for two disparate examples. To quantify the receptor distribution within the cell, HEK-293 cells were transiently transfected with A2AR–CFP constructs. Cells were stained using WGA plasma membrane dye (pseudocolored in red; B and E) and with ER tracker dye (pseudocolored in green; C and F). Images A–C are representative of a variant that trafficked to the plasma membrane, C74A–C146A; images D–F are representative of a variant that displayed a high ER localized receptor population, C146A. The Hausdorff distance ratios were determined as described in the Materials and methods section, and are shown to the right of the images. Scale bars, 10 µm. (For interpretation of the references to color in this figure, the reader is referred to the web version of this article.)
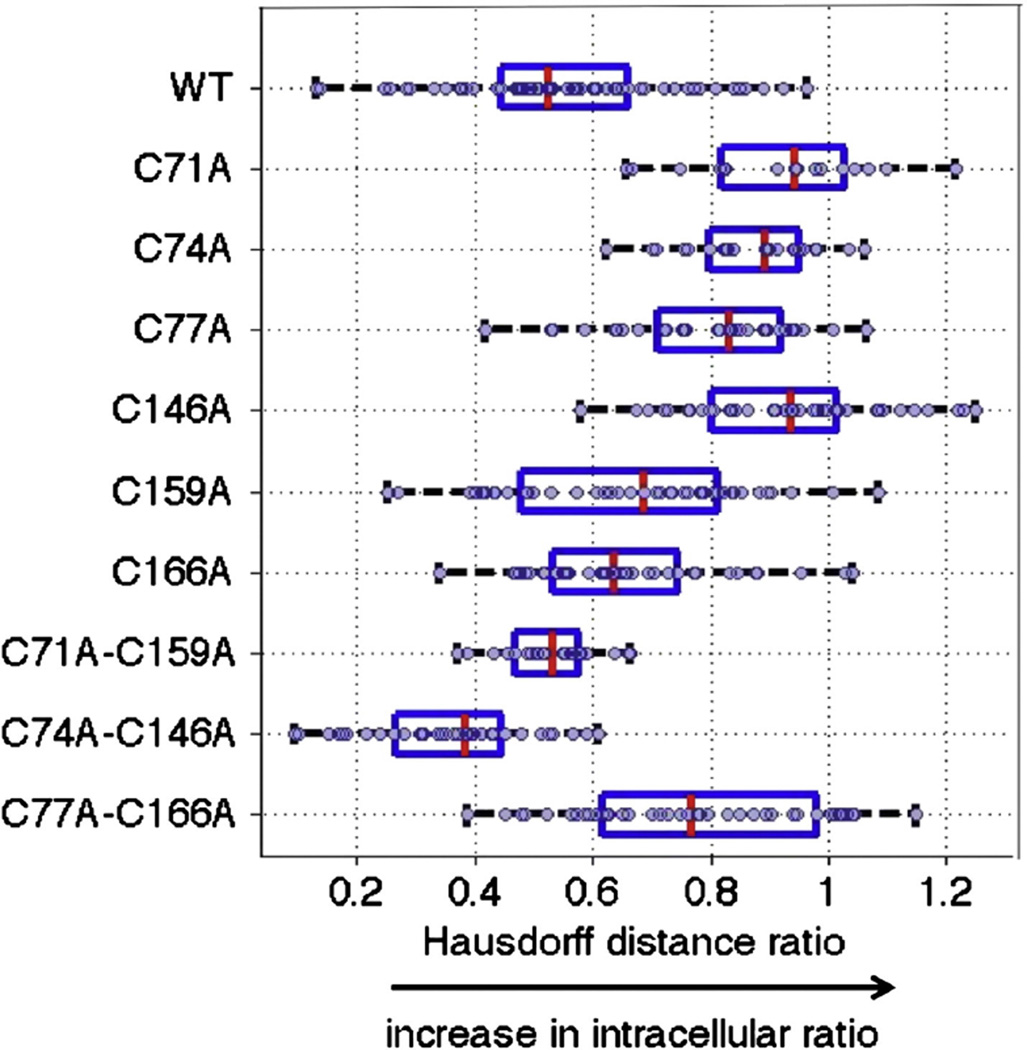
This semi-quantitative method identified three different trafficking patterns: a higher ER retention relative to the WT A2AR – all the single Cys-to-Ala variants and the conserved disulfide bond variant (C77A– C166A); a similar trafficking pattern as the WT A2AR – C71A–C159A; and improved plasma membrane trafficking relative to the WT receptor – C74A–C146A. These different trafficking patterns are highlighted in the box plot, Fig. 5, where the gray circles indicate the Hausdorff distance ratios for individual images of the WT and the Cys-to-Ala variants. The average values for the wild type A2AR and the Cys-to-Ala variants and the 95% confidence interval are listed in Table 2.
Fig. 5.
Receptor distribution within the plasma membrane and ER for WT A2AR and the Cys-to-Ala variants. The Hausdorff distance ratio was calculated for at least twenty images for each of the A2AR variants, where the gray circles represent the values calculated for each image. Box plots were used to display the data, with red lines indicating the median for each variant; the edges of the blue boxes correspond to the 25th and 75th percentiles. (For interpretation of the references to colors in this figure legend, the reader is referred to the web version of this article.)
Table 2.
Cellular distribution of the A2AR WT and Cys-to-Ala variants.
| Receptor distribution: Hausdorff ratio |
|||
|---|---|---|---|
| Mean ± SEM | 95% CI | Sample size | |
| A2A WT | 0.55 ± 0.02 | 0.50–0.60 | 62 |
| C71A | 0.92 ± 0.04 | 0.84–1.00 | 20 |
| C74A | 0.87 ± 0.02 | 0.82–0.92 | 22 |
| C77A | 0.80 ± 0.03 | 0.74–0.85 | 33 |
| C146A | 0.93 ± 0.02 | 0.88–0.98 | 43 |
| C159A | 0.66 ± 0.03 | 0.60–0.72 | 45 |
| C166A | 0.66 ± 0.02 | 0.61–0.71 | 41 |
| C71A–C159A | 0.53 ± 0.02 | 0.50–0.56 | 24 |
| C74A–C146A | 0.36 ± 0.02 | 0.32–0.41 | 39 |
| C77A–C166A | 0.78 ± 0.03 | 0.72–0.84 | 42 |
HEK-293 cells expressing CFP tagged A2AR WT and Cys-to-Ala variants, stained with plasma membrane and ER dyes. The Hausdorff distances between CFP and the plasma membrane, and ER and plasma membrane were calculated. The ratio of these distances (mean ± SEM), the values obtained for the 95% confidence interval, and the number of cells used for this analysis are listed in the table.
The box plot highlights the wide range of receptor distribution observed for some of the A2AR variants; images representative of the low and the high Hausdorff ratios for each variant are shown in the Supplemental information. Analysis of the average pixel intensity, an indicator of the protein expression levels per cell, revealed that there is no correlation between the WT expression levels per cell and the receptor distribution within the cell as indicated by the Hausdorff ratio analysis (Supplemental information).
Like the WT receptor, all the A2AR variants appeared to traffic to the plasma membrane to some degree. To determine if the variants were able to bind ligand, a high affinity (KD = 57 nM) fluorescent agonist, FITC-APEC [27], was used to visualize the active receptors at the cell surface. For these experiments we used HEK-293 cells expressing untagged A2AR variants; Fig. 6 shows the FITC-APEC binding typically observed.
Fig. 6.
Fluorescent-ligand binding to the A2AR variants. HEK-293 cells transiently transfected with untagged A2AR constructs and incubated with 70 nM FITC-APEC. A–C) Variants with mutations in the cysteines in ECL1. D–F) Variants with mutations in the cysteines in ECL2. G–I) Variants with mutations in the cysteines in ECL1 and ECL2, corresponding to the disulfide bonds. J–K) WT A2AR and negative control. Scale bars, 10 µm.
This fluorescent ligand-binding study showed that all single and double Cys-to-Ala variants were capable of binding the fluorescent ligand (Fig. 6). This result is consistent with the observation that the single and double Cys-to-Ala variants trafficked to the plasma membrane and confirms their ligand-binding capability.
2.2. Saturation binding of [3H] CGS 21680 to A2AR wild type and Cys-to-Ala variants
Radioactive ligand binding was conducted to determine the binding affinity of the A2AR variants for the high-affinity agonist [3H] CGS 21680 (Fig. 7). HEK-293 cells transiently transfected with the untagged A2AR constructs were incubated with increasing amounts of [3H] CGS 21680 and bound ligand was measured, as described in the Materials and methods section.
Fig. 7.
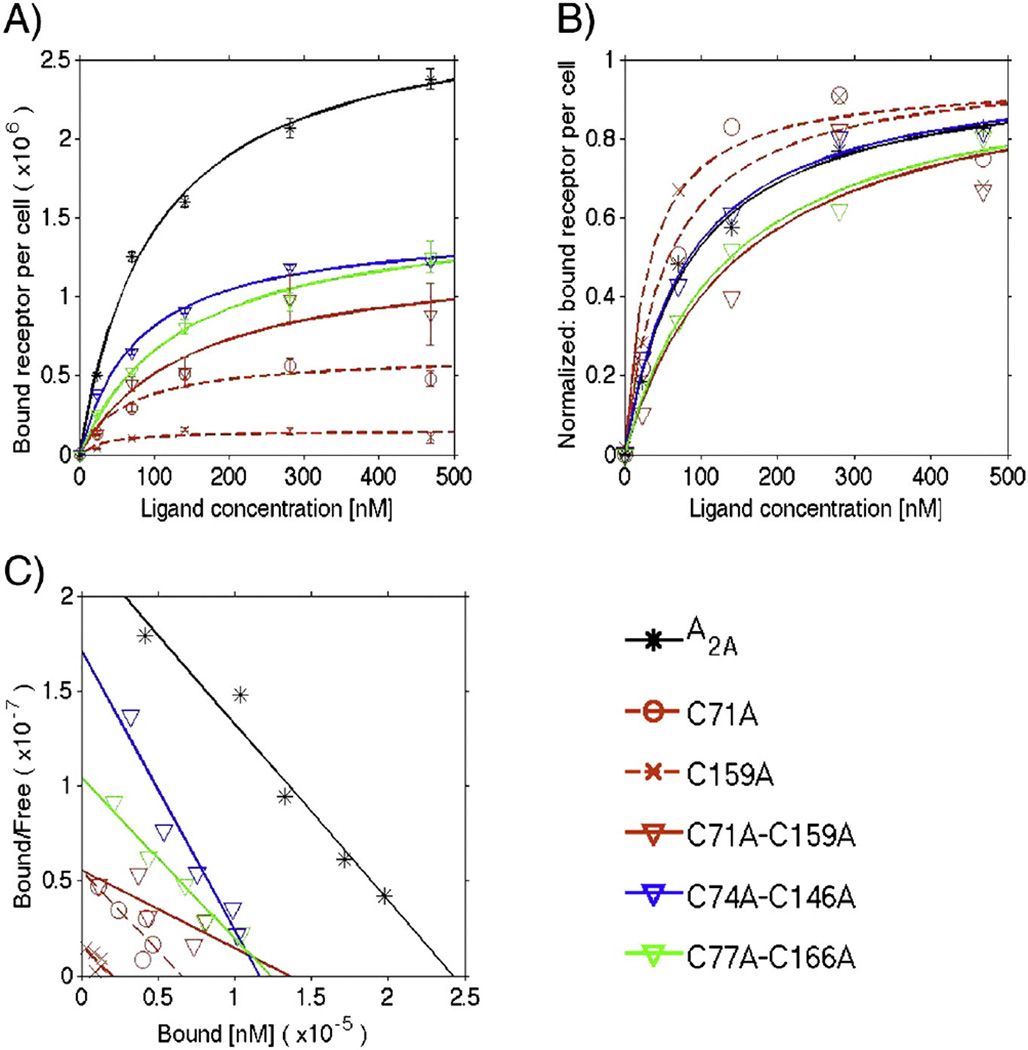
Equilibrium saturation data of [3H] CGS 21680 binding to A2AR variants expressed in HEK-293 cells. A) Monovalent binding fit: the data points are the average of at least two independent experiments performed in triplicate. The total number of active receptors per cell (Rmax) and the equilibrium dissociation constant (KD) values are displayed in Table 3. B) Normalized monovalent binding fit: data were normalized using the Rmax value. C) Scatchard analysis: the Scatchard analysis of [3H] CGS 21680 saturation binding to HEK-293 cells expressing the A2AR variants was conducted according to Scatchard [43]. For the single Cys-to-Ala variants, only C71A and C159A are plotted for clarity, and dashed lines represent the fits to the data. Data for the double Cys-to-Ala variants are plotted using downward-pointing triangles and solid lines for the fits. The data for the WT A2AR are plotted using asterisks and a black solid line for the fit.
Bound receptor–ligand complexes are plotted versus increasing ligand concentration for single and double Cys-to-Ala variants (Fig. 7A), where a line shows the fit to a single-site binding model. The equilibrium dissociation constant (KD) and the total number of active receptors per cell (Rmax) were determined from this fit (Table 3).
Table 3.
Binding parameters of A2AR WT and Cys-to-Ala variants.
| Equilibrium binding studies |
|||||
|---|---|---|---|---|---|
| KD ± SEM (nM) |
KD 95% CI (nM) |
Rmax ± SEM × 106 |
Rmax % of A2AR |
Sample size |
|
| A2A WT+ | 94.5 ± 9.5 | 75.8–113.1 | 2.9 ± 0.6 | 100 | 12 |
| C71A+ | 61.5 ± 11.1 | 39.8–83.2 | 0.64 ± 0.14 | 22.2 | 6 |
| C74A+ | 60.7 ± 3.6^ | 53.7–67.7 | 1.1 ± 0.1 | 38.5 | 6 |
| C77A+ | 70.0 ± 14.3 | 42.0–98.0 | 0.54 ± 0.13 | 18.8 | 9 |
| C146A+ | 51.7 ± 6.3^ | 39.3–64.2 | 0.18 ± 0.03 | 6.4 | 9 |
| C159A* | 49.8 ± 20.9 | 8.7–90.8 | 0.16 ± 0.01 | 5.6 | 6 |
| C166A+ | 64.4 ± 3.1^ | 58.4–70.4 | 0.44 ± 0.12 | 15.3 | 6 |
| C71A–C159A+ | 149.8 ± 5.0^ | 140.0–159.6 | 1.3 ± 0.2 | 44.1 | 6 |
| C74A–C146A+ | 91.8 ± 15.4 | 61.7–121.9 | 1.5 ± 0.1 | 50.9 | 9 |
| C77A–C166A+ | 139.8 ± 8.9^ | 122.3–157.3 | 1.6 ± 0.05 | 54.4 | 6 |
HEK-293 cells expressing untagged A2AR WT and Cys-to-Ala variants were incubated with increasing amount of agonist [3H] CGS 21680. Equilibrium data were fit to a monovalent binding model to determine the total number of active receptors (Rmax) and the equilibrium dissociation constant (KD).
r2 values > 0.9, and
r2 values > 0.84. Values represent the mean ± the standard error of the mean (SEM) for at least two independent biological experiments performed in triplicate. Sample size indicates the number of replicates measured.
Indicates KD values significantly different from the wild type value, p ≤ 0.05.
Normalizing the data using the Rmax values calculated from the fits allows for easier visualization of changes in the ligand-binding affinity (KD), as shown in Fig. 7B. Linear transformations of the data (Scatchard analysis, Fig. 7C) highlight that the single cysteine variants – in particular mutations in ECL2 – had the greatest impact on the total active receptor at the plasma membrane (x-axis intercept). A Hill plot (not shown) yields a Hill coefficient equal to one, validating the use of a monovalent binding model to fit the data.
In this ligand-binding analysis, three populations with somewhat different binding affinities were identified, as follows (Table 3):
C74A–C146A had similar KD (92 nM) to the WT A2AR (94 nM). This variant also had improved plasma membrane trafficking relative to the WT A2AR (Fig. 5).
Remarkably, the single Cys-to-Ala variants displayed modestly increased ligand-binding affinity compared to the WT receptor; despite their improved ligand-binding affinity, their higher levels of ER localization are likely a result of exposure of a free cysteine in the ECL.
In contrast to the single cysteine variants, and uncorrelated with their plasma membrane trafficking, C77A–C166A and C71A–C159A had significantly higher KD values (lower affinity) than the WT receptor for CGS 21680.
3. Discussion
Unlike other class A GPCRs, such as rhodopsin and the adrenergic receptors, ECL2 of the A2A adenosine receptor is mainly unstructured, with a rich disulfide bond network proposed to constrain the otherwise flexible ECL2 [10]. One of these disulfide bonds (C77–C166) is conserved in the class A GPCRs; this disulfide bond is essential for the expression, membrane trafficking and function of some GPCRs [14–21]. For example, for the closely related A1 adenosine receptor, mutation of either cysteine of the conserved disulfide bond results in a complete loss of antagonist binding and plasma-membrane localization [22]. In contrast, by mutating the cysteines in ECL1 and ECL2, including those of the conserved disulfide bond, we were able to access a range of ligand-binding affinities (from 52–150 nM) and only somewhat reduced trafficking to the plasma membrane. Unexpectedly, the conserved cysteines (C77, C166) were not critical for the trafficking and ligand-binding activity of this receptor.
3.1. Trafficking patterns and ER quality control
Tagging the WT receptor and the Cys-to-Ala constructs with CFP enabled us to confirm that the A2AR variants were expressed and trafficked to the plasma membrane (Fig. 2–3). Using the Hausdorff ratio (HR) analysis, a clear difference between the distribution of the WT receptor, with a HR of 0.55, and all the single Cys-to-Ala variants, with a HR range of 0.66–0.93 was observed. Overall, these studies indicate that the single Cys-to-Ala variants have significantly higher levels of ER-retained receptor (Fig. 5 and Table 2).
Unpaired cysteine residues are one of the main features that are recognized by the ER quality control system [28], in particular by thioldisulfide oxidoreductases. There are a high number of oxidoreductases in the ER, and native and non-native disulfide bonds are transiently formed in the ER until folding is complete [28,29]. Receptor trafficking to the plasma membrane was restored and even improved in most of the double Cys-to-Ala variants, C71A–C159A (HR 0.53) and C74A–C146A (HR 0.36). Thus, our data suggests that the unpaired cysteines of the A2AR variants may interact with ER oxidoreductases, and are retained in the ER due to disulfide bond shuffling until a folded conformation is achieved.
In contrast to the other double cysteine variants, C77A–C166A (site of conserved disulfide bond) had a higher level of ER localized receptor (HR 0.78) compared to WT (0.55). It is unclear how the ER quality control recognizes the differences in loop structure that form upon the removal of the conserved disulfide bond, but not the removal of the other two non-conserved disulfide bonds. Investigating this mechanism could lead to an improved understanding of the molecular factors responsible for the distribution of GPCRs within the cell, and should be further investigated. These studies could also be expanded to study the effect of double disulfide bond mutations on the trafficking and ligand-binding activity of the human A2AR.
3.2. Receptor ligand-binding activity and thermodynamic stability
Even though the single Cys-to-Ala variants exhibited higher levels of ER localized receptors compared to the WT, they were able to bind fluorescent and radiolabeled ligands with affinity close to WT (Fig. 6A – F and 7). It is possible that these variants could still form two disulfide bonds between ECL1 and ECL2, achieving a non-native conformation with higher affinity to the ligand than the WT receptor (Fig. 7B and Table 3).
Our data suggest that only two disulfide bonds are needed to maintain the WT conformation of A2AR. Mutations to C71–C159 and C77– C166 had a somewhat negative impact on the ligand-binding affinity (Fig. 7B and Table 3). In contrast, mutations to C74–C146 had no effect on ligand affinity, further suggesting that this disulfide bond is not necessary for the folding and ligand-binding activity of this receptor. However, this disulfide bond could be important for the interactions with other ligands not tested in the current study (e.g. antagonists and other agonists).
Earlier in vitro studies of A2AR, where purified receptors were denatured using urea, showed that WT receptor and DTT-reduced receptor underwent a similar unfolding transition; however, ligand binding was significantly decreased in the DTT-reduced receptor [6]. Taken together with our in vivo studies, these data indicate that the disulfide bond network in A2AR is more critical for maintaining the active conformation of the receptor than for achieving a more stable structural conformation [6]. A similar role may be implicated in another GPCR, the human P2Y12 receptor, for which no electron density was found in the X-ray structure, suggesting that a labile or dynamic disulfide bond forms between the conserved cysteines [30]. Additionally, mutations to the conserved cysteines retained similar protein yield and stability, indicating that for P2Y12 the conserved disulfide bond serves a functional role [30].
It has been reported that the recognition of misfolded proteins by the quality control system in the ER is correlated with the thermodynamic stability of the protein or altered folding kinetics [28,31,32]. Since mutation to C74–C146 improved the receptor trafficking to the plasma membrane (Fig. 5 and Table 2), it is possible that in this case the removal of the disulfide bond between C74 and C146 improved receptor stability, assembly efficiency, and thus, trafficking. Our results suggest that in A2AR the disulfide bonds restrict the active conformation of the receptor. However, this constrained active conformation may not be the most stable conformation, as seen with the loss of the C74–C146 bond, which improved the trafficking of the receptor. One possible explanation that is consistent with our results is that during evolution A2AR was optimized for function rather than for folding and assembly, as previously suggested by Ellgaard and Helenius to explain the poor native trafficking efficiency of some proteins, including CFTR and the δ opioid receptor [28].
The range of ligand-binding affinities observed with the A2AR variants (52–150 nM) suggests that the individual cysteines and disulfide bonds are not critical for the ligand-binding activity of this receptor, perhaps because the disulfide bond network in A2AR provides some structural redundancy. Alternatively, this modest impact on affinity could indicate a larger tolerance for various ligand-binding conformations. It is unclear whether the disulfide bond network is important to maintain the active conformation of the ECLs, or of residues in the transmembrane domains encompassing the ligand-binding pocket.
4. Importance of disulfide bonds on ligand recognition
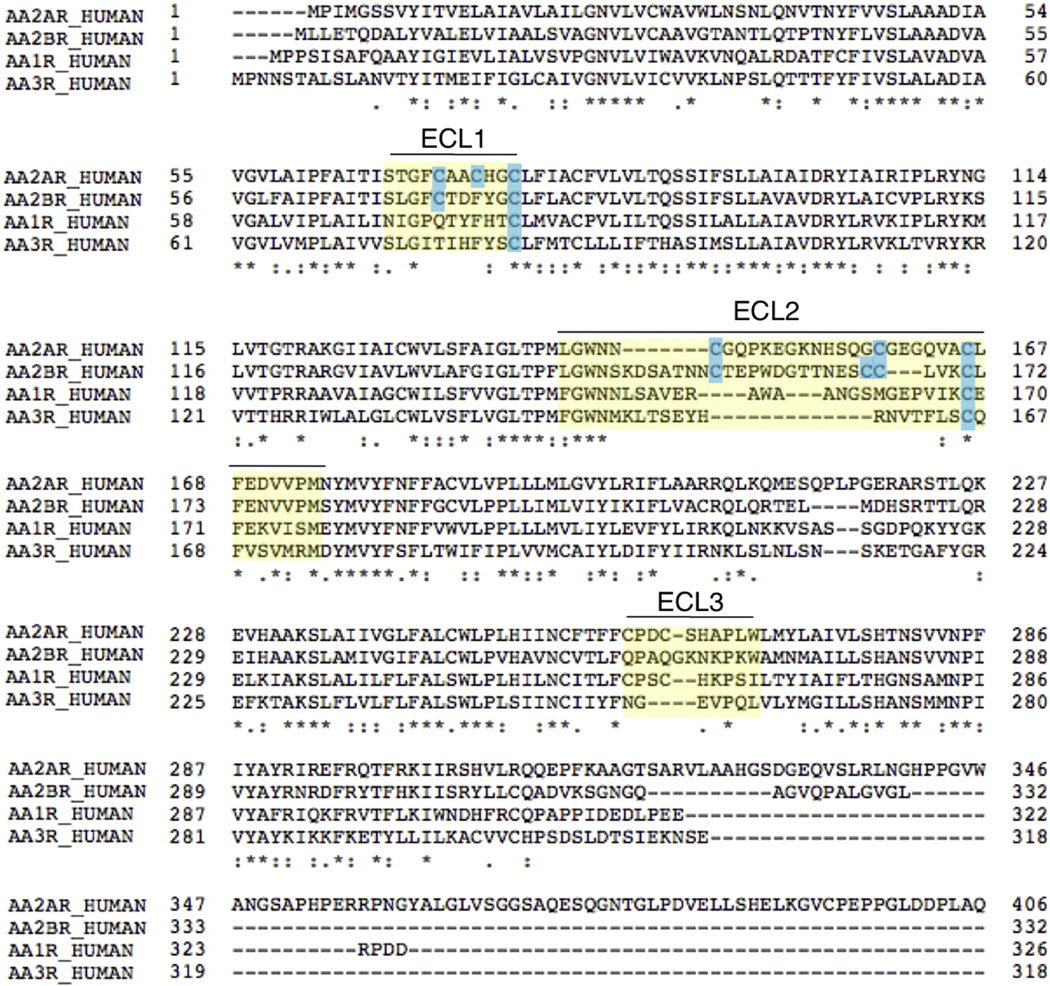
There is growing evidence that ECL2 is important for ligand recognition in class A GPCRs [14]. In many GPCRs, this region is not well conserved in length, amino acid composition, and number of disulfide bonds [15,33]. In contrast, there exists high structural similarity among GPCR transmembrane domains [3]. This can be observed within the adenosine receptor (AR) family, which share high sequence homology of the residues in the transmembrane domains, with low homology in the ECL regions, as seen in Fig. 9. It has been postulated that interactions that determine AR subtype selectivity are localized to the more diverse upper and extracellular regions of the binding pocket [34]. In contrast, the lower portion of the ligand-binding pocket is believed to determine the strength of ligand binding [35].
Fig. 9.
Sequence alignment of the human adenosine receptors. The yellow highlight denotes the approximate boundary of the extracellular loops, and the cysteines in ECL1 and ECL2 are highlighted in blue. Asterisks indicate fully conserved residues, colons indicate conservation between groups of strongly similar properties, and periods indicate conservation between groups of weakly similar properties. UniProt was used for sequence alignment. (For interpretation of the references to colors in this figure legend, the reader is referred to the web version of this article.) [44].
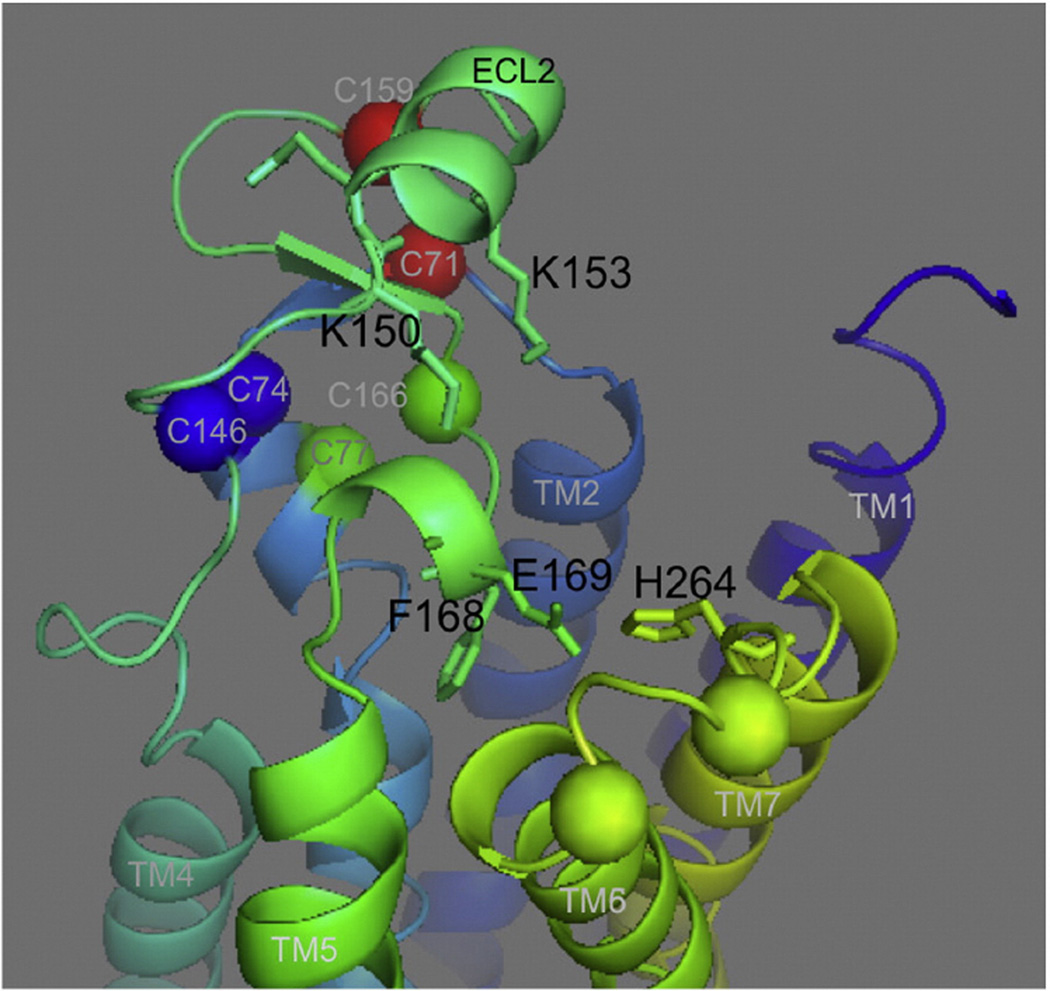
From the A2AR crystal structures, NMR, molecular modeling and mutagenesis studies, the details of the ligand-binding pocket of the ARs are becoming clearer. In A2AR, ECL2 forms a random coil structure with a very short α-helical segment at the end of the loop [3]. This segment could form critical aromatic π-stacking interactions between F168 and the heterocyclic core of various A2AR agonists and antagonists [3,8,11, 13,35–37]. Additionally, this small α-helical segment contains E169 that could form important polar interactions with various ligands and with H264 in ECL3 [37]. ECL2 has another α-helical segment, above F168 and E169, Fig. 8. This helix contains the positively charged residues K150 and K153, which can play a role in the initial recognition of the ligand and its movement to the binding site ([37] and supplement of Ref. [12]). Supervised molecular dynamics (SuMD) has allowed examination of the ligand–receptor recognition pathway on a nanosecond time scale. This approach also highlighted the role of ECL2 in ligand recognition of human A2A adenosine receptor [38]. Additionally, in molecular modeling studies, the carboxyl group of the agonist CGS 21680 is in contact with K153 through ionic interactions [37].
Fig. 8.
Residues in ECL2 important for ligand recognition and binding. Cysteines are indicated as spheres, and color-coded to note the corresponding disulfide bonds. Residues in the ECLs important for ligand binding are indicated as sticks. Adapted using PyMOL, Protein Data Bank identification code 4EIY. (For interpretation of the references to colors in this figure legend, the reader is referred to the web version of this article.)
Our data suggest that only two disulfide bonds are needed to retain WT ligand-binding affinity, C71–C159 and C77–C166, and therefore these two disulfide bonds may be critical for restricting the conformation of the two helices in the ECL2. Furthermore, mutations to C71– C159 and C77–C166 had the highest impact on the ligand-binding affinity of A2AR, which could be due to an increased flexibility of ECL2 in the absence of these disulfide bonds, resulting in a conformation where F168, E169, K150 and K153 are not in direct contact with the ligand. It is likely that the disulfide bonds restrict the conformation of the ECLs, and that for the incoming ligand, each ECL topology represents a signature for each receptor [19].
The four ARs contain a conserved phenylalanine (F168) residue in ECL2, and E169 is conserved in A2AR, A2BR and A1R, as seen in Fig. 9. Therefore, these residues could also form important contacts with the ligand in the other ARs. A1R and A3R have only the one conserved disulfide bond linking ECL1 and ECL2. A2BR has a rich concentration of cysteines, and could potentially form two disulfide bonds between ECL1 and ECL2. Since the disulfide bond network is different among the ARs, the interactions between the residues important for ligand binding (e.g. F168 and E169) and the ligand could vary due to a difference in loop topology, restricted by the disulfide bonds. The different disulfide bond networks present in the ARs could help explain why the ARs have different affinities for the same ligand.
5. Conclusion
The ECL regions are challenging to capture in crystal structures due to their flexibility; therefore, mutagenesis and functional studies continue to provide insights into the importance of these flexible regions. Our results suggest that the disulfide bond network in A2AR is important for maintaining the topology of the ECLs. By mutating the cysteines in the ECLs, we were able to access a modest range of ligand-binding affinities, perhaps indicative of various ligand-binding conformations.
None of the cysteine residues mutated in this study, including the conserved cysteines, were essential for A2A adenosine receptor trafficking and ligand-binding activity. Our results also indicate that the disulfide bond network does not contribute to the assembly of the most stable conformation, as the removal of C74–C146 improves folding efficiency and trafficking to the plasma membrane, attributes that have been linked to conformational stability. This suggests that a widely accepted concept in the biophysical community, that disulfide bonds contribute to protein stability, may not always be the case, in particular with proteins with an extensive disulfide bond network, such as A2AR.
6. Materials and methods
6.1. Mutagenesis and cloning
Human A2AR cDNA was a kind gift from Dr. Marlene Jacobson (Merck). Oligonucleotides used for site-directed mutagenesis and cloning were obtained from IDT (Coralville, Iowa), and are listed in the Supplemental information. All enzymes were purchased from New England Biolabs (Ipswich, MA). All the site-directed cysteine-to-alanine mutations were introduced in the A2AR gene using the pcDNA 3.1 vector and the Quick-change II XL Kit (Agilent Technologies, Santa Clara, CA), following the manufacturer’s protocol. The full-length A2AR coding gene was then subcloned into the vector pCEP4 or pCEP4 containing the cyan fluorescent protein (CFP) for mammalian expression. KpnI and XhoI restriction enzymes were used for subcloning the A2A gene into pCEP4.
Escherichia coli strain DH5α was used for propagation of the cloning plasmids using Luria–Bertani media supplemented with 100 µg/ml ampicillin; cultures were incubated overnight at 37 °C and 250 rpm. Transformations of E. coli were performed by the heat shock method [39]. DNA was extracted from DH5α using the Wizard Plus SV Minipreps DNA Purification System from Promega (Madison, WI). All mutations were confirmed by DNA sequencing (DNA Core Facility, University of Delaware).
6.2. Cell culture and transfection
All media used for mammalian cell culture and Lipofectamine2000 were purchased from Life Technologies (Grand Island, NY). HEK-293 cells were grown in Dulbecco’s Modified Eagle’s Medium (DMEM) supplemented with 10% fetal calf serum at 37 °C in a humidified 5% CO2 incubator. Transient transfections were carried out using Lipofectamine2000 following the manufacturer’s instructions and 800 ng of DNA per 80% confluent T-25 culture flask.
6.3. Expression and trafficking patterns
In order to confirm the expression and monitor the trafficking patterns, the A2AR constructs utilized for these studies contained a C-terminal-linked CFP. HEK-293 cells were imaged 36 h after transfection. For imaging, cells were seeded at 100,000 cells per well (Nunc Lab-Tek II Chambered Cover Glass 4-well, Thermo Scientific) and allowed to adhere overnight. Transfection efficiency was monitored using the CFP-tagged receptors; the efficiency was uniform throughout the experiments, ranging from 40%–46%.
6.4. Plasma membrane and endoplasmic reticulum (ER) staining
To further characterize the trafficking patterns of the A2AR–CFP constructs, plasma membrane (WGA Alexa Fluor 555 Conjugate, Molecular Probes, Eugene, OR) and endoplasmic reticulum (ER Tracker Green, Molecular Probes) dyes were used. For the staining experiments, transfected cells were plated at 100,000 cells per well in a 4-well imaging chamber (Nunc Lab-Tek II Chambered Cover Glass, Thermo Scientific) coated with 12% (w/v) collagen. Cells were incubated at 37 °C in a humidified 5% CO2 incubator overnight. The next day the cells were washed once with PBS. All aspirations and additions to the imaging wells were performed drop-wise using gel-loading tips. 400 µL of the ER Tracker Green solution (1 µM in PBS) was added to each well, and the plates were incubated for 20 min at 37 °C. 200 µL of the WGA solution (2 µg/ml in PBS) was then added to each well without aspirating the ER Tracker Green solution. The plates were incubated for an additional 5 min at 37 °C, and the dye solutions were removed following this incubation. Next, 400 µL of 4% paraformaldehyde (in PBS) was added to each well and the plates were incubated for 10 min at 37 °C. After this incubation, the paraformaldehyde solution was removed, the wells were washed twice with 400 µL PBS and a final volume of 400 µL PBS was added to each well for imaging. Cells were imaged 48 h after transfection.
6.5. Fluorescent ligand binding
For ligand binding studies, untagged receptors were used (A2A constructs in pCEP4 vector). Transfected HEK-293 cells were plated at 100,000 cells per well in a 4-well imaging chamber and grown overnight. Media was removed and replaced with 70 nM FITC-APEC (NIMH synthesis program, http://nimh-repository.rti.org, NIMH Code: D-906) in PBS and incubated for 1 h at 37 °C in a humidified 5% CO2 incubator. Cells were imaged 36–48 h after transfection.
6.6. Confocal microscopy
Confocal images were acquired on an inverted Zeiss LSM 510 NLO laser-scanning microscope (Carl Zeiss, Inc., Germany) using a 25 mW Argon laser (LASOS, Ebersberg, Germany) and a 40× Plan-Neofluar/1.3 Oil DIC objective lens (Carl Zeiss, Inc.).
6.7. Analysis of receptor trafficking
Images of cells expressing the A2AR-CFP constructs, stained with the plasma membrane and ER dyes were analyzed in order to determine the distribution pattern of the different A2A variants. For this purpose, while imaging, the master gain (800–900) and the laser power were kept constant. The quality of the ER and plasma membrane stains was confirmed prior to inclusion in analysis; i.e., images where the plasma membrane dye stained the membranes of internal organelles were not used in the analysis. Images were cropped to include only one cell per file prior to the analysis.
Each file was composed of an aligned set of three 12-bit gray scale images: the CFP-tagged receptor, the plasma membrane, and the ER. See Fig. 4 for examples; in this case, the CFP-tagged receptor is shown in cyan, the plasma membrane in red, and the ER in green to facilitate identification of the structures. For analysis, each image was subjected to thresholding to separate signal from background pixels, resulting in binary images. We used the IsoData auto-thresholding algorithm [40] that is the default thresholding algorithm in ImageJ [41]. Let SCFP, SM and SER be the set of signal pixels in the CFP-tagged receptor image, the plasma membrane image, and in the ER image, respectively. In order to compare the shape of those three point sets, we used the directed Hausdorff distance H(A,B) between two point sets A and B in the plane, which is defined as follows [42]:
where ‖a – b‖ denotes the Euclidean distance between points a and b. The directed Hausdorff distance assigns to every point a in A its nearest neighbor in B, and then computes the maximum of all distances between assigned points. In order to make this distance more robust against noise and outliers causing non-representative large distances, we replace the maximum with an average and arrive at the modified directed Hausdorff distance:
Our goal was to quantify whether the shape of SCFP was closer to the membrane shape of SM or to the shape of the cell interior that is represented by SER. We therefore compared SCFP to SM and SER to SM using the modified directed Hausdorff distance, and combined both quantities in a single Hausdorff ratio (HR):
A large Hausdorff ratio (close to 1) indicates that the shape of SCFP was similar to SER, as the average distances to the plasma membrane are similar. A small Hausdorff ratio (<0.5) indicates that the shape of SCFP was more similar to the membrane shape SM, as the average distances from the CFP-tagged receptor to the plasma membrane are overall smaller than the average distances from the ER to the plasma membrane. Due to the use of average distances as well as the use of a ratio, the Hausdorff ratio is quite robust and works well with different thresholding methods. We implemented the Hausdorff ratio computation in ImageJ [41].
6.8. Radioligand binding
Radioligand binding was performed as described previously [7]. HEK-293 cells were transfected with untagged receptors (A2A constructs in pCEP4), and tested for ligand binding 48 h after transfection. Cells from one confluent T-25 flask were washed and resuspended in the binding buffer (TME: 50 mM Tris–HCl, 10 mM MgCl2 and 1 mM EDTA). Cells were then aliquoted (approximately 100,000 cells per well) into poly(ethyleneimine) (0.1% v/v) treated 96-well glass fiber filter plates (MultiScreen-FC filter type B, Millipore, Billerica, MA). Cells were then incubated with 0 nM–470 nM [3H] CGS 21680 (Perkin Elmer, Boston, MA) for 3 h. The binding reaction was terminated by filtration, with three washes of ice-cold TME buffer. 30 µL of scintillation solution (ULTIMA Gold, Perkin Elmer) was added to each well. Ligand binding was determined via bound radioactive counts (CPMs) using a Perkin-Elmer 1450 Microbeta liquid scintillation counter. Multiple counts were taken until the values stabilized, approximately 24 h after the addition of the scintillation solution. Non-specific binding was determined in parallel reactions using non-transfected HEK-293 cells incubated over the same ligand concentrations. All samples were run in triplicate and at least two independent biological experiments were conducted. Non-specific binding was subtracted from the total binding to determine the specific binding. Matlab (version 7.10, MathWorks, Natick, MA) was used to fit the data to the equilibrium solution of the mass action kinetic model for a single-site binding reaction:
where C is the total number of receptor–ligand complexes (measured), L is the radioligand concentration, Rmax is the total number of active receptors, and KD is the equilibrium dissociation constant. The coefficients for KD and Rmax were determined by averaging the minimized least square regression for the data of each experiment. The standard error of the mean (SEM) and 95% confidence intervals were determined from the sample standard deviation, calculated from at least six independent experiments.
Supplementary Material
Acknowledgements
The authors thank Dr. Kirk Czymmek and the BioImaging Center at the Delaware Biotechnology Institute for their assistance in obtaining the confocal images. The research described in this publication was supported in part by grants from the NSF CBET1033268/1249200, NIH P30 RR031160, and NIH P30 GM103519, and an NSF Graduate Research Fellowship (ANN).
Abbreviations
- GPCRs
G protein-coupled receptors
- ARs
adenosine receptors
- ECL
extracellular loop
- DTT
dithiothreitol
- CFP
cyan fluorescent protein
- A2AR
A2A receptor
- WT
wild type
- ER
endoplasmic reticulum
- M
plasma membrane
- HR
Hausdorff ratio
- HEK cells
human embryonic kidney
Footnotes
Appendix A. Supplementary data
Supplementary data to this article can be found online at http://dx.doi.org/10.1016/j.bbamem.2014.11.010.
Contributor Information
Andrea N. Naranjo, Email: anaranjo@udel.edu.
Amy Chevalier, Email: amychev@seas.upenn.edu.
Emily C. McCusker, Email: emily.mccusker@tevapharm.com.
Carola Wenk, Email: cwenk@tulane.edu.
Anne S. Robinson, Email: asr@tulane.edu.
References
- 1.Rask-Andersen M, Almen MS, Schioth HB. Trends in the exploitation of novel drug targets. Nat. Rev. Drug Discov. 2011;10:579–590. doi: 10.1038/nrd3478. [DOI] [PubMed] [Google Scholar]
- 2.Jacobson KA, Gao ZG. Adenosine receptors as therapeutic targets. Nat. Rev. Drug Discov. 2006;5:247–264. doi: 10.1038/nrd1983. [DOI] [PMC free article] [PubMed] [Google Scholar]
- 3.Piirainen H, Ashok Y, Nanekar RT, Jaakola VP. Structural features of adenosine receptors: from crystal to function. Biochim. Biophys. Acta Biomembr. 2011;1808:1233–1244. doi: 10.1016/j.bbamem.2010.05.021. [DOI] [PubMed] [Google Scholar]
- 4.Ciruela F, Albergaria C, Soriano A, Cuffi L, Carbonell L, Sanchez S, Gandia J, Fernandez-Duenas V. Adenosine receptors interacting proteins (ARIPs): behind the biology of adenosine signaling. Biochim. Biophys. Acta Biomembr. 2010;1798:9–20. doi: 10.1016/j.bbamem.2009.10.016. [DOI] [PubMed] [Google Scholar]
- 5.O′Malley MA, Mancin JD, Young CL, McCusker EC, Raden D, Robinson AS. Progress toward heterologous expression of active G-protein-coupled receptors in Saccharomyces cerevisiae: linking cellular stress response with translocation and trafficking. Protein Sci. 2009;18:2356–2370. doi: 10.1002/pro.246. [DOI] [PMC free article] [PubMed] [Google Scholar]
- 6.O′Malley MA, Naranjo AN, Lazarova T, Robinson AS. Analysis of adenosine A(2)a receptor stability: effects of ligands and disulfide bonds. Biochemistry-Us. 2010;49:9181–9189. doi: 10.1021/bi101155r. [DOI] [PMC free article] [PubMed] [Google Scholar]
- 7.O’Malley MA, Lazarova T, Britton ZT, Robinson AS. High-level expression in Saccharomyces cerevisiae enables isolation and spectroscopic characterization of functional human adenosine A2a receptor. J. Struct. Biol. 2007;159:166–178. doi: 10.1016/j.jsb.2007.05.001. [DOI] [PMC free article] [PubMed] [Google Scholar]
- 8.Dore AS, Robertson N, Errey JC, Ng I, Hollenstein K, Tehan B, Hurrell E, Bennett K, Congreve M, Magnani F, Tate CG, Weir M, Marshall FH. Structure of the adenosine A(2A) receptor in complex with ZM241385 and the xanthines XAC and caffeine. Structure. 2011;19:1283–1293. doi: 10.1016/j.str.2011.06.014. [DOI] [PMC free article] [PubMed] [Google Scholar]
- 9.Hino T, Arakawa T, Iwanari H, Yurugi-Kobayashi T, Ikeda-Suno C, Nakada-Nakura Y, Kusano-Arai O, Weyand S, Shimamura T, Nomura N, Cameron AD, Kobayashi T, Hamakubo T, Iwata S, Murata T. G-protein-coupled receptor inactivation by an allosteric inverse-agonist antibody. Nature. 2012;482:237–240. doi: 10.1038/nature10750. [DOI] [PMC free article] [PubMed] [Google Scholar]
- 10.Jaakola VP, Griffith MT, Hanson MA, Cherezov V, Chien EY, Lane JR, Ijzerman AP, Stevens RC. The 2.6 Angstrom crystal structure of a human A2A adenosine receptor bound to an antagonist. Science. 2008;322:1211–1217. doi: 10.1126/science.1164772. [DOI] [PMC free article] [PubMed] [Google Scholar]
- 11.Lebon G, Warne T, Edwards PC, Bennett K, Langmead CJ, Leslie AG, Tate CG. Agonist-bound adenosine A2A receptor structures reveal common features of GPCR activation. Nature. 2011;474:521–525. doi: 10.1038/nature10136. [DOI] [PMC free article] [PubMed] [Google Scholar]
- 12.Liu W, Chun E, Thompson AA, Chubukov P, Xu F, Katritch V, Han GW, Roth CB, Heitman LH, AP IJ, Cherezov V, Stevens RC. Structural basis for allosteric regulation of GPCRs by sodium ions. Science. 2012;337:232–236. doi: 10.1126/science.1219218. [DOI] [PMC free article] [PubMed] [Google Scholar]
- 13.Xu F, Wu H, Katritch V, Han GW, Jacobson KA, Gao ZG, Cherezov V, Stevens RC. Structure of an agonist-bound human A2A adenosine receptor. Science. 2011;332:322–327. doi: 10.1126/science.1202793. [DOI] [PMC free article] [PubMed] [Google Scholar]
- 14.Venkatakrishnan AJ, Deupi X, Lebon G, Tate CG, Schertler GF, Babu MM. Molecular signatures of G-protein-coupled receptors. Nature. 2013;494:185–194. doi: 10.1038/nature11896. [DOI] [PubMed] [Google Scholar]
- 15.de Graaf C, Foata N, Engkvist O, Rognan D. Molecular modeling of the second extracellular loop of G-protein coupled receptors and its implication on structure-based virtual screening. Proteins. 2008;71:599–620. doi: 10.1002/prot.21724. [DOI] [PubMed] [Google Scholar]
- 16.Perlman JH, Wang W, Nussenzveig DR, Gershengorn MC. A disulfide bond between conserved extracellular cysteines in the thyrotropin-releasing-hormone receptor is critical for binding. J. Biol. Chem. 1995;270:24682–24685. doi: 10.1074/jbc.270.42.24682. [DOI] [PubMed] [Google Scholar]
- 17.Hwa J, Reeves PJ, Klein-Seetharaman J, Davidson F, Khorana HG. Structure and function in rhodopsin: further elucidation of the role of the intradiscal cysteines Cys-110 −185 and −187 in rhodopsin folding and function. Proc. Natl. Acad. Sci. U. S. A. 1999;96:1932–1935. doi: 10.1073/pnas.96.5.1932. [DOI] [PMC free article] [PubMed] [Google Scholar]
- 18.Karnik SS, Khorana HG. Assembly of functional rhodopsin requires a disulfide bond between cysteine residue-110 and residue-187. J. Biol. Chem. 1990;265:17520–17524. [PubMed] [Google Scholar]
- 19.Zhang PS, Johnson PS, Zollner C, Wang WF, Wang ZJ, Montes AE, Seidleck BK, Blaschak CJ, Surratt CK. Mutation of human mu opioid receptor extracellular disulfide cysteine residues alters ligand binding but does not prevent receptor targeting to the cell plasma membrane. Mol. Brain Res. 1999;72:195–204. doi: 10.1016/s0169-328x(99)00241-7. [DOI] [PubMed] [Google Scholar]
- 20.Dohlman HG, Caron MG, Deblasi A, Frielle T, Lefkowitz RJ. Role of extracellular disulfide-bonded cysteines in the ligand-bonded cysteins in the ligand-binding function of the beta-2-adrenergic receptor biochemistry-Us. 1990;29:2335–2342. doi: 10.1021/bi00461a018. [DOI] [PubMed] [Google Scholar]
- 21.Noda K, Saad Y, Graham RM, Karnik SS. The high-affinity state of the beta-2-adrenergic receptor requires unique interaction between conserved and nonconserved extracellular loop cysteines. J. Biol. Chem. 1994;269:6743–6752. [PubMed] [Google Scholar]
- 22.Scholl DJ, Wells JN. Serine and alanine mutagenesis of the nine native cysteine residues of the human A(1) adenosine receptor. Biochem. Pharmacol. 2000;60:1647–1654. doi: 10.1016/s0006-2952(00)00474-3. [DOI] [PubMed] [Google Scholar]
- 23.Mazzoni MR, Giusti L, Rossi E, Taddei S, Lucacchini A. Role of cysteine residues of rat A(2a) adenosine receptors in agonist binding. Biochim. Biophys. Acta Biomembr. 1997;1324:159–170. doi: 10.1016/s0005-2736(96)00223-4. [DOI] [PubMed] [Google Scholar]
- 24.Wedekind A, O’Malley MA, Niebauer RT, Robinson AS. Optimization of the human adenosine A2a receptor yields in Saccharomyces cerevisiae. Biotechnol. Prog. 2006;22:1249–1255. doi: 10.1021/bp050431r. [DOI] [PubMed] [Google Scholar]
- 25.Niebauer RT, Robinson AS. Exceptional total and functional yields of the human adenosine (A2a) receptor expressed in the yeast Saccharomyces cerevisiae. Protein Expr. Purif. 2006;46:204–211. doi: 10.1016/j.pep.2005.09.020. [DOI] [PubMed] [Google Scholar]
- 26.Mundell S, Kelly E. Adenosine receptor desensitization and trafficking. Biochim. Biophys. Acta Biomembr. 2011;1808:1319–1328. doi: 10.1016/j.bbamem.2010.06.007. [DOI] [PubMed] [Google Scholar]
- 27.McCabe RT, Skolnick P, Jacobson KA. 2-[2-[4-[2-[2-[1,3-Dihydro-1,1-bis (4-hydroxyphenyl)-3-oxo-5-isobenzofuranthioureidyl]ethylaminocarbonyl]ethyl] phenyl]ethylamino]-5N′-ethylcarboxamidoadenosine (FITC-APEC): a fluorescent ligand for A2a–adenosine receptors. J. Fluoresc. 1992;2:217–223. doi: 10.1007/BF00865279. [DOI] [PMC free article] [PubMed] [Google Scholar]
- 28.Ellgaard L, Helenius A. Quality control in the endoplasmic reticulum. Nat. Rev. Mol. Cell Biol. 2003;4:181–191. doi: 10.1038/nrm1052. [DOI] [PubMed] [Google Scholar]
- 29.Sitia R, Braakman I. Quality control in the endoplasmic reticulum protein factory. Nature. 2003;426:891–894. doi: 10.1038/nature02262. [DOI] [PubMed] [Google Scholar]
- 30.Zhang K, Zhang J, Gao Z-G, Zhang D, Zhu L, Han GW, Moss SM, Paoletta S, Kiselev E, Lu W, Fenalti G, Zhang W, Mueller CE, Yang H, Jiang H, Cherezov V, Katritch V, Jacobson KA, Stevens RC, Wu B, Zhao Q. Structure of the human P2Y(12) receptor in complex with an antithrombotic drug. Nature. 2014;509 doi: 10.1038/nature13083. (115-+). [DOI] [PMC free article] [PubMed] [Google Scholar]
- 31.Krebs MP, Noorwez SM, Malhotra R, Kaushal S. Quality control of integral membrane proteins. Trends Biochem. Sci. 2004;29:648–655. doi: 10.1016/j.tibs.2004.10.009. [DOI] [PubMed] [Google Scholar]
- 32.Nagy JK, Sanders CR. Destabilizing mutations promote membrane protein misfolding. Biochemistry-Us. 2004;43:19–25. doi: 10.1021/bi035918s. [DOI] [PubMed] [Google Scholar]
- 33.Seibt BF, Schiedel AC, Thimm D, Hinz S, Sherbiny FF, Muller CE. The second extracellular loop of GPCRs determines subtype-selectivity and controls efficacy as evidenced by loop exchange study at A(2) adenosine receptors. Biochem. Pharmacol. 2013;85:1317–1329. doi: 10.1016/j.bcp.2013.03.005. [DOI] [PubMed] [Google Scholar]
- 34.Li JN, Jonsson AL, Beuming T, Shelley JC, Voth GA. Ligand-dependent activation and deactivation of the human adenosine A(2a) receptor. J. Am. Chem. Soc. 2013;135:8749–8759. doi: 10.1021/ja404391q. [DOI] [PMC free article] [PubMed] [Google Scholar]
- 35.Jaakola VP, Lane JR, Lin JY, Katritch V, Ijzerman AP, Stevens RC. Ligand binding and subtype selectivity of the human A(2A) adenosine receptor identification and characterization of essential amino acid residues. J. Biol. Chem. 2010;285:13032–13044. doi: 10.1074/jbc.M109.096974. [DOI] [PMC free article] [PubMed] [Google Scholar]
- 36.Lane JR, Herenbrink CK, van Westen GJP, Spoorendonk JA, Hoffmann C, Ijzerman AP. A novel nonribose agonist, LUF5834, engages residues that are distinct from those of adenosine-like ligands to activate the adenosine A(2a) receptor. Mol. Pharmacol. 2012;81:475–487. doi: 10.1124/mol.111.075937. [DOI] [PubMed] [Google Scholar]
- 37.Deflorian F, Kumar TS, Phan K, Gao ZG, Xu F, Wu HX, Katritch V, Stevens RC, Jacobson KA. Evaluation of molecular modeling of agonist binding in light of the crystallographic structure of an agonist-bound A(2A) adenosine receptor. J. Med. Chem. 2012;55:538–552. doi: 10.1021/jm201461q. [DOI] [PMC free article] [PubMed] [Google Scholar]
- 38.Sabbadin D, Moro S. Supervised Molecular Dynamics (SuMD) as a helpful tool to depict GPCR-ligand recognition pathway in a nanosecond time scale. J. Chem. Inf. Model. 2014;54:372–376. doi: 10.1021/ci400766b. [DOI] [PubMed] [Google Scholar]
- 39.Sambrook J, Fritsch EF, Maniatis T. Molecular Cloning: A Laboratory Manual. 2nd ed. NY: Cold Spring Harbor Laboratory Press; 1989. [Google Scholar]
- 40.Ridler TW, Calvard S. Picture thresholding using an iterative selection method. IEEE Trans. Syst. Man Cybern. 1978;8:630–632. [Google Scholar]
- 41.Schneider CA, Rasband WS, Eliceiri KW. NIH Image to ImageJ: 25 years of image analysis. Nat. Methods. 2012;9:671–675. doi: 10.1038/nmeth.2089. [DOI] [PMC free article] [PubMed] [Google Scholar]
- 42.Alt H, Guibas LJ. Chapter 3 — discrete geometric shapes: matching, interpolation, and approximation. In: Sack JR, Urrutia J, editors. Handbook of Computational Geometry. North-Holland, Amsterdam: 2000. pp. 121–153. [Google Scholar]
- 43.Scatchard G. The attractions of proteins for small molecules and ions. Ann. N. Y. Acad. Sci. 1949;51:660–672. [Google Scholar]
- 44.Apweiler R, Bateman A, Martin MJ, O’Donovan C, Magrane M, Alam-Faruque Y, Alpi E, Antunes R, Arganiska J, Casanova EB, Bely B, Bingley M, Bonilla C, Britto R, Bursteinas B, Chan WM, Chavali G, Cibrian-Uhalte E, Da Silva A, De Giorgi M, Fazzini F, Gane P, Castro LG, Garmiri P, Hatton-Ellis E, Hieta R, Huntley R, Legge D, Liu WD, Luo J, MacDougall A, Mutowo P, Nightingale A, Orchard S, Pichler K, Poggioli D, Pundir S, Pureza L, Qi GY, Rosanoff S, Sawford T, Shypitsyna A, Turner E, Volynkin V, Wardell T, Watkins X, Zellner H, Corbett M, Donnelly M, Van Rensburg P, Goujon M, McWilliam H, Lopez R, Xenarios I, Bougueleret L, Bridge A, Poux S, Redaschi N, Aimo L, Auchincloss A, Axelsen K, Bansal P, Baratin D, Binz PA, Blatter MC, Boeckmann B, Bolleman J, Boutet E, Breuza L, Casal-Casas C, de Castro E, Cerutti L, Coudert E, Cuche B, Doche M, Dornevil D, Duvaud S, Estreicher A, Famiglietti L, Feuermann M, Gasteiger E, Gehant S, Gerritsen V, Gos A, Gruaz-Gumowski N, Hinz U, Hulo C, James J, Jungo F, Keller G, Lara V, Lemercier P, Lew J, Lieberherr D, Lombardot T, Martin X, Masson P, Morgat A, Neto T, Paesano S, Pedruzzi I, Pilbout S, Pozzato M, Pruess M, Rivoire C, Roechert B, Schneider M, Sigrist C, Sonesson K, Staehli S, Stutz A, Sundaram S, Tognolli M, Verbregue L, Veuthey AL, Wu CH, Arighi CN, Arminski L, Chen CM, Chen YX, Garavelli JS, Huang HZ, Laiho K, McGarvey P, Natale DA, Suzek BE, Vinayaka CR, Wang QH, Wang YQ, Yeh LS, Yerramalla MS, Zhang J, UniProt C. Activities at the Universal Protein Resource (UniProt) Nucleic Acids Res. 2014;42:D191–D198. doi: 10.1093/nar/gkt1140. [DOI] [PMC free article] [PubMed] [Google Scholar]
Associated Data
This section collects any data citations, data availability statements, or supplementary materials included in this article.


