

Abstract
Polygonum multiflorum, a traditional Chinese medicinal herb, is widely used in liver and liver nourishing. Recent years, drug regulatory departments reported that Polygonum multiflorum caused serious adverse reaction in clinic, especially liver injury. In this study, we detected the changes in rat serum and liver tissue metabolites through gas chromatography-mass spectrometry (GC-MS). Mass spectrometry, partial least squares-discriminate analysis (PLS-DA) and other diversified techniques were used to analyze the differences among their metabolites. Compared to the control group, the serum concentrations of L-threonine and serine in water extraction groups increased. The serum concentrations of 9,12-octadecadienoic acid, hexadecanoic acid, oleic acid, D-glucose and octadecanoic acid in alcohol extraction groups increased, while lactic acid decreased to a great extent. For liver tissue, compared to the control group, the concentrations of myo-inositol, oleic acid and cholesterol in water extraction groups increased, while those of hexadecanoic acid, octadecanoic acid, ribitol and butanedioic acid decreased to a great extent. The concentrations of myo-inositol, phosphoric acid, uridine, oleic acid, cholesterol and butanoic acid in alcohol extraction groups increased to a great extent, while those of hexadecanoic acid, octadecanoic acid, ribitol and butanedioic acid decreased. The results indicate that Polygonum multiflorum induces the metabolic disorders of energy metabolism, amino acid and lipid metabolism. What’s more, liver injury of alcohol extraction group was more serious than group of water extraction.
Keywords: GC-MS, polygonum multiflorum, metabonomics
Introduction
The Polygonum multiflorum (Chinese name He-Shou-Wu) is a popular traditional Chinese medicine, which is widely used in liver-and-kidney-nourishing and hair-blacking preparations, even the general public diet. However, more and more adverse reactions of Polygonum multiflorum were discovered as the increasingly application of it in nearly years [1-3]. The toxicity of Polygonum multiflorum had aroused wide concern in the world. What’s more, liver injury was the most serious and frequently in clinical reported [4-7]. Thus, in order to reduce the clinical adverse reactions and use Polygonum multiflorum in a more secure and reasonable manner, it is necessary to elucidate the relationship between the different components of Polygonum multiflorum and the toxicity of liver. Some scholars had reported the toxic effects of Polygonum multiflorum, but few of them elucidated the mechanism of liver toxicity from metabonomics.
Metabonomics, as a new technology, study biological fluids (such as blood, urine, etc), cell and tissue extracts and so on as the objects, through qualitative and quantitative analysis of the variations of endogenous metabolites in biological systems to evaluate effects of exogenous stimuli, meanwhile bioinformatics analysis of metabonomics data help us to study outside stimulation regulation and response mechanism from the perspective of the overall system of biochemical spectrum [8,9]. The traditional Chinese medicine “multi-component and multi-target” characteristics corresponded with the ideology of “overall and systematic” in metabonomics [10]. Therefore, in the modern medicine research, metabonomics has been widely applied to the foundation of Chinese medicine, mechanism and side effects [11-13]. GC-MS has a great advantage to detect low-molecular-weight metabolites in metabonomics studies, because GC-MS provides heightened equipment stability and user-friendly tools for data analysis [14-16]. The research based on systems biology approach of GC-MS metabonomics to study the changes of metabolites in rats and mechanism for liver injury caused by Polygonum multiflorum.
Material and methods
Chemicals and reagents
TMCS (trimethylchlorosilane) and MSTFA (N-Methyl-N-(trimethylsilyl)- Trifluoroacetamide) were purchased from Sigma-Aldrich in Germany. Methylhydroxylamine hydrochloride and pyridine were purchased from Aladdin Industrial, Inc. in China. Acetonitrile and n-heptane (HPLC-grade) were purchased from Tedia Reagent Company in the USA.
Instruments and conditions
The Agilent 6890N-5975B GC/MS was supplied by Agilent Technologies, Inc, in the USA. The column was HP-5MS (0.25 mm×30 m×0.25 μm, Agilent, USA). The temperature of GC oven was first set at 80°C for five minutes, and then gradually raised the temperature to 260°C at a rate of 10°C/min, maintained ten minutes at 260°C. MS procedure was set in EI mode with electron energy of 70 eV, full-scan mode with m/z of 50-550 and adopted splitless mode injection.
Animal surgery and sample collection
Male and female rats (SPF grade, weighting 200~220 g) were obtained from Laboratory Animal Center of Wenzhou Medical University. The animal license number was SCXK (Shanghai) 2012-0002. All thirty rats were housed at Wenzhou Medical University Laboratory Animal Research Center. Animals were housed under controlled conditions (22°C) with a natural light-dark cycles.All experimental procedures were conducted according to the Institutional Animal Care guidelines and with ethics approval from the Administration Committee of Experimental Animals, Laboratory Animal Center of Wenzhou Medical University.
The 30 rats were randomly divided into three groups (10 animals/group): Control group, E30 group, W30 group. Treatment was administered by gavage. The rats of control group were fed with water only.The rats of E30 groups were fed with 30 g/kg of alcohol extract of polygonum multiflorum. The rats of W30 groups were fed with 30 g/kg of water extract of polygonum multiflorum. The dosing volume was 15 mL/kg, administered orally once a day for 28 consecutive days.
Rats were only given water for 12 hours over night when the drug was ended. Blood samples of one milliliter and liver tissue was drawn from the rats. The blood samples were centrifuged for ten minutes at 3000 rpm. Liver tissue homogenate were prepared by normal saline at 1:2 (W/V). The serums and liver tissue were separated and kept at a temperature of -80°C until analysis.
Sample preparation
Polygonum multiflorum preparations were purchased from the First Affiliated Hospital of Wenzhou Medical University, Guizhou origin. In this study, the method of alcohol extraction was as follows: Polygonum multiflorum was crushed into a crude powder and eight times the amount of 80% ethanol was added to it followed by heat with reflux for extraction three times. Each extraction time was 1 hour, combined with alcohol extracting solution, then concentrated extracting solution and frozen at 4°C. The method of water extraction was as follows: Polygonum multiflorum was crushed into a crude powder, and eight times the amount of water was added and heated at reflux for extraction three times. Each extraction time was 1 hour, combined with water extracting solution, then concentrated extracting solution and frozen at 4°C. Using a water bath, it was also heated at 37°C before each administration.
200 µL of serum and liver tissue were taken in centrifugal tube separately after they were thawed, adding 400 µL acetonitrile, mixing, and then stored at 4°C for fifteen minutes. The samples were centrifuged at 13000 r/min for ten minutes. 400 µL of supernatant were processed through freeze drying for 24 hours. 50 µL of methylhydroxylamine hydrochloride (15 mg/mL in pyridine) was added to freeze-dried powder, reacting one hour at 70°C. 50 µL of MSTFA (with 1% TMCS as the catalyst) was added, reacting one hour at room temperature and then adding 150 µL n-heptane to end the derivative reaction. The supernatant was transferred to GC-MS vial and analyzed.
Data analysis
Remove the overload peaks of metabolites and import the GC-MS date into the Microsoft Excel. Area normalization method was used to deal with the date, and then SIMCAP 12.0 software (Umetrics, Umea) was applied to principal component analyze (PCA) and partial least squares discriminate analyze (PLS-DA). PLS-DA showed the differences in serum and liver compositions of three different groups. The corresponding loading diagrams, where each spot represents a metabolite, revealed variables that contributed to the separation of the samples on the score charts.
Statistical analysis
To detect the significant differences between metabolic changes, SPSS software (version 17.0) was applied to statistical analyze. The differences between two groups were detected by independent samples t test. A P-value <0.05 was considered to be statistically significant.
Results and discussion
Analytical characteristics of global profiling methods
Figure 1 provides the total ion chromatograms of serum and liver tissue obtained from GC-MS technique. It showed that the final dataset of endogenous metabolites consisted of fifty-five in serum and seventy-two in liver tissue after screening. The 5 quality control samples were separately detected in order to examine the reproducibility of the method. The results showed that the metabolic features had a coefficient of variance (CV%) of no more than 30%. The NIST 2005 mass spectrometry database was supplied to identify the metabolites of the serum and liver tissue.
Figure 1.
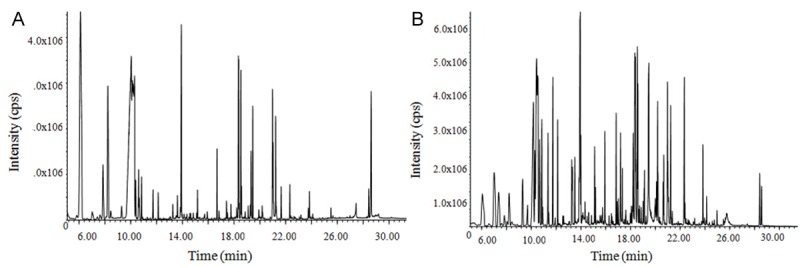
GC-MS total ion chromatograms of rat serum (A) and liver tissue (B).
Metabolomics study
GC-MS spectrum provides the basic information of endogenous metabolites in serum and liver tissue. PLS-DA was used to analyze the differences among their metabolites. The PLS-DA chart and score charts of W30 group, E30 group and control group in serum were shown in Figure 2. Figure 3 showed the PLS-DA chart and score charts of W30 group, E30 group and control in liver tissue.
Figure 2.
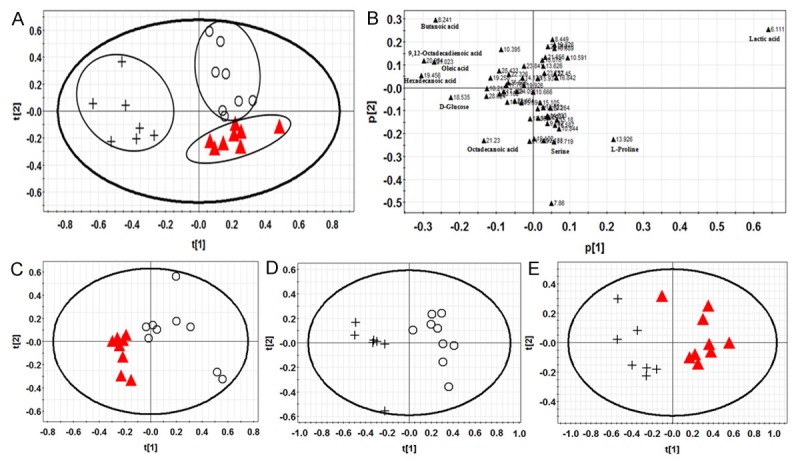
(A) was PLS-DA results of rat serum samples. (B) was the corresponding loading diagram of (A). (C-E) were PLS-DA score results of rat serum samples. Keys: control group (○), W30 group (▲), E30 group (+).
Figure 3.
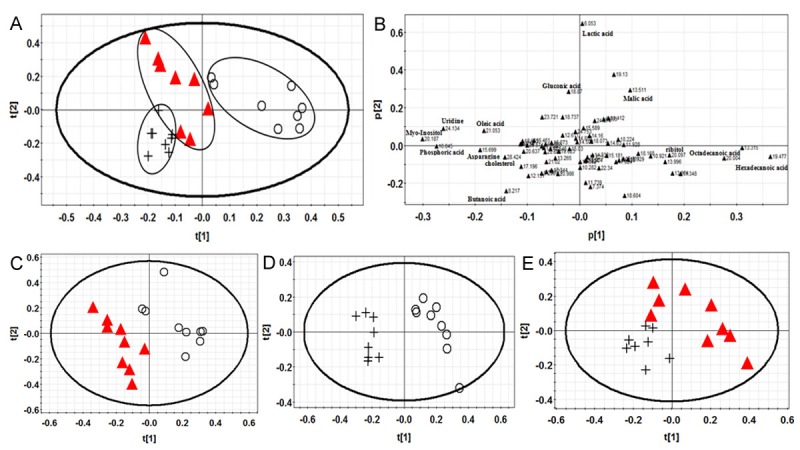
(A) was PLS-DA results of rat liver tissue samples. (B) was the corresponding loading diagram of (A). (C-E) were PLS-DA score results of rat liver tissue samples. Keys: control group (○), W30 group (▲), E30 group (+).
Figure 2 showed that control group, W30 group and E30 group in serum were separated completely. It indicated that Polygonum multiflorum had a significant impact on the metabolism of rats. There were some differences between W30 group and E30 group that compared with the control group; the spots of E30 group were farther than W30 group in Figure 2A. It showed that liver injury of E30 group was more serious than W30 group.
Figure 3 showed that control group and drug groups were separated widely and W30 group and E30 group had a little overlap.
In a word, no matter serum samples or liver tissue samples, it showed that there was a great distinction between control group and drug groups. In addition, metabolic disorders of E30 group were more serious than W30 group.
Loading diagrams showed that most of spots were gathering near the origin of coordinates and a few spots were away from the origin. Every spot represents a variable that caused the differences among groups. The spots of variables were father away from the origin, the more contributions to classification. Figure 2B showed that ten metabolites that the retention time was 6.111, 20.984, 19.456, 13.926, 21.023 minutes, etc had a great contribution to the classification. Eighteen metabolites that retention time was 19.477, 20.187, 16.845, 20.004, 6.053 minutes etc in Figure 3B bought a great contribution. These metabolites maybe potential biomarkers of Polygonum multiflorum induced liver injury in rats.
Changes in metabolite
On the basis of PLS-DA module, variable importance in the projection (VIP), loading weight, correlation coefficients and other diversified techniques were used to screening the differences variables of liver toxicity of Polygonum multiflorum compared with the control group.
The values of variables more than one of VIP were selected. T test and variance analysis of these variables were used by SPSS 17.0. The compounds of P<0.05 were selected that had statistical significance and excluded compounds that had no significant difference. Data Analysis soft and NIST mass spectrometry database were used to find related matching compounds. Serum samples were shown in Tables 1 and 2 showed liver tissue samples.
Table 1.
Summary of the changes in relative levels of metabolites in rat serum indicated by the PLS-DA loading plots and statistical analysis
| ID | Retention time | VIP | Metabolites compound | W30 | E30 |
|---|---|---|---|---|---|
| 1 | 6.111 | 3.64931 | Lactic acid | - | ↓** |
| 2 | 20.984 | 1.79947 | 9,12-Octadecadienoic acid | - | ↑* |
| 3 | 19.456 | 1.70148 | Hexadecanoic acid | - | ↑** |
| 4 | 13.926 | 1.63905 | L-Proline | - | - |
| 5 | 21.023 | 1.53244 | Oleic acid | - | ↑* |
| 6 | 18.535 | 1.43145 | D-Glucose | - | ↑** |
| 7 | 8.241 | 1.29372 | Butanoic acid | - | - |
| 8 | 21.230 | 1.09480 | Octadecanoic acid | - | ↑** |
| 9 | 12.133 | 1.07326 | L-threonine | ↑** | - |
| 10 | 11.719 | 1.03722 | Serine | ↑* | - |
Note: Marks indicate the direction of the change, i.e. ↓for decrease, ↑for increase, -for no change.
P<0.05, as indicated by the statistical analysis T-test.
P<0.01, as indicated by the statistical analysis T-test.
Table 2.
Summary of the changes in relative levels of metabolites in rat liver tissue indicated by the PLS-DA loading plots and statistical analysis
| ID | Retention time | VIP | Metabolites compound | W30 | E30 |
|---|---|---|---|---|---|
| 1 | 19.477 | 2.654 | Hexadecanoic acid | ↓** | ↓** |
| 2 | 20.187 | 2.29623 | Myo-Inositol | ↑** | ↑** |
| 3 | 16.845 | 2.02252 | Phosphoric acid | - | ↑** |
| 4 | 20.004 | 2.01631 | Octadecanoic acid | ↓** | ↓** |
| 5 | 6.053 | 1.9717 | Lactic acid | - | - |
| 6 | 24.134 | 1.68168 | Uridine | - | ↑* |
| 7 | 13.954 | 1.54936 | L-Proline | - | - |
| 8 | 15.699 | 1.51306 | Asparagine | - | - |
| 9 | 21.053 | 1.45883 | Oleic acid | ↑** | ↑** |
| 10 | 11.348 | 1.31384 | Pyrimidine | - | - |
| 11 | 13.511 | 1.28656 | Malic acid | - | - |
| 12 | 20.097 | 1.27562 | Ribitol | ↓** | ↓** |
| 13 | 28.424 | 1.26961 | cholesterol | ↑* | ↑** |
| 14 | 6.995 | 1.18809 | L-Alanine | - | - |
| 15 | 8.217 | 1.15384 | Butanoic acid | - | ↑* |
| 16 | 13.996 | 1.09157 | Glycine | - | - |
| 17 | 18.87 | 1.06777 | Gluconic acid | - | - |
| 18 | 10.921 | 1.04214 | Butanedioic acid | ↓** | ↓** |
Note: Marks indicate the direction of the change, i.e. ↓for decrease, ↑for increase, -for no change.
P<0.05, as indicated by the statistical analysis T-test.
P<0.01, as indicated by the statistical analysis T-test.
Compared to the control group, the serum concentrations of L-threonine and serine in W30 groups increased. The serum concentrations of 9,12-octadecadienoic acid, hexadecanoic acid, oleic acid, D-glucose and octadecanoic acid in E30 groups increased, while lactic acid decreased to a great extent.
In liver tissue, compared to the control group, the concentrations of myo-inositol, oleic acid and cholesterol in W30 groups increased, while those of hexadecanoic acid, octadecanoic acid, ribitol and butanedioic acid decreased to a great extent. The concentrations of myo-inositol, phosphoric acid, uridine, oleic acid, cholesterol and butanoic acid in E30 groups increased to a great extent, while those of hexadecanoic acid, octadecanoic acid, ribitol and butanedioic acid decreased.
Whatever serum samples or liver tissue samples, compared with the control group, E30 group showed the more changes of metabolites than W30 group. It indicated that liver injury of E30 group was more serious than W30 group. Some scholars speculated that the mechanism of liver toxicity maybe associated with vitamin A in Polygonum multiflorum. Ethanol can enhance the toxicity of vitamin A on liver cells. If patients take the preparation of Polygonum multiforum contained ethanol or drink at the same time, it will induce or aggravate the injury of liver.
Liver is one of the important digestive organs of the body and the body’s largest gland. At the same time, liver is an important metabolic organ. It plays an important role in sugar, lipid protein, and vitamin and hormone etc metabolism. Thus, as soon as the liver injures, the related metabolites will be disordered. The serum concentrations of L-threonine and serine increased after giving the extract of Polygonum multiflorum, which maybe caused by the disorders of amino acid metabolism in liver. Liver is the main site of amino acid metabolism. Therefore, when the liver injured, it caused complex metabolic disorders and amino acid metabolism decreased in liver cells resulting in the concentration of amino acid increased in blood. The serum concentrations of lipid metabolites such as 9,12-octadecadienoic acid, hexadecanoic acid, oleic acid and so on increased significantly, which showed Polygonum multiflorum accelerated the process of lipid oxidation degradation. In liver tissue, the concentration of phosphoric acid increased to a great extent. The mechanism probably was the decomposition of cell membrane phospholipid molecules caused by free radicals, resulting in the injury of biological membrane. The concentration of uridine increased significantly, indicating that the degradation of nucleic acid added.
Conclusion
Polygonum multiflorum induces the metabolic disorders of energy metabolism, amino acid and lipid metabolism. It indicated that the rats had liver injury. What’s more, liver injury of E30 group was more serious than W30 group. In addition, using the GC-MS and other diversified techniques analysis centered in metabonomics screened the related biomarkers that caused liver injury in rats. From the molecular level, it made us understand the intervention of metabolites of Polygonum multiflorum and laid the foundation of metabolic regulation mechanism of liver injury caused by Polygonum multiflorum in the future.
Acknowledgements
This study was supported by grants from the Education of Zhejiang province, China, No.Y201327183; the national science and technology on new drug creation and development projects (2011ZX09102-011-07 to GY L, 2011ZX09101-002-07 to SH C), Zhejiang Provincial Program for the Cultivation of High-level Innovative Health talents to SHC, the Youth Talent Program Foundation of The First Affiliated Hospital of Wenzhou Medical University (qnyc010), Wenzhou Municipal Science and Technology Bureau (Y20140741).
Disclosure of conflict of interest
None.
References
- 1.Dong H, Slain D, Cheng J, Ma W, Liang W. Eighteen cases of liver injury following ingestion of Polygonum multiflorum. Complement Ther Med. 2014;22:70–74. doi: 10.1016/j.ctim.2013.12.008. [DOI] [PubMed] [Google Scholar]
- 2.Jung KA, Min HJ, Yoo SS, Kim HJ, Choi SN, Ha CY, Kim HJ, Kim TH, Jung WT, Lee OJ, Lee JS, Shim SG. Drug-Induced Liver Injury: Twenty Five Cases of Acute Hepatitis Following Ingestion of Polygonum multiflorum Thunb. Gut Liver. 2011;5:493–499. doi: 10.5009/gnl.2011.5.4.493. [DOI] [PMC free article] [PubMed] [Google Scholar]
- 3.Park GJ, Mann SP, Ngu MC. Acute hepatitis induced by Shou-Wu-Pian, a herbal product derived from Polygonum multiflorum. J Gastroenterol Hepatol. 2001;16:115–117. doi: 10.1046/j.1440-1746.2001.02309.x. [DOI] [PubMed] [Google Scholar]
- 4.Cardenas A, Restrepo JC, Sierra F, Correa G. Acute hepatitis due to shen-min: a herbal product derived from Polygonum multiflorum. J Clin Gastroenterol. 2006;40:629–632. doi: 10.1097/00004836-200608000-00014. [DOI] [PubMed] [Google Scholar]
- 5.Mazzanti G, Battinelli L, Daniele C, Mastroianni CM, Lichtner M, Coletta S, Costantini S. New case of acute hepatitis following the consumption of Shou Wu Pian, a Chinese herbal product derived from Polygonum multiflorum. Ann Intern Med. 2004;140:W30. doi: 10.7326/0003-4819-140-7-200404060-00042-w3. [DOI] [PubMed] [Google Scholar]
- 6.Panis B, Wong DR, Hooymans PM, De Smet PA, Rosias PP. Recurrent toxic hepatitis in a Caucasian girl related to the use of Shou-Wu-Pian, a Chinese herbal preparation. J Pediatr Gastroenterol Nutr. 2005;41:256–258. doi: 10.1097/01.mpg.0000164699.41282.67. [DOI] [PubMed] [Google Scholar]
- 7.Wu X, Chen X, Huang Q, Fang D, Li G, Zhang G. Toxicity of raw and processed roots of Polygonum multiflorum. Fitoterapia. 2012;83:469–475. doi: 10.1016/j.fitote.2011.12.012. [DOI] [PubMed] [Google Scholar]
- 8.Keun HC. Metabonomic modeling of drug toxicity. Pharmacol Ther. 2006;109:92–106. doi: 10.1016/j.pharmthera.2005.06.008. [DOI] [PubMed] [Google Scholar]
- 9.Tang HR, Wang YL. Metabonomics: a revolution in progress. Progress In Biochemistry and Biophysics. 2006;33:401–417. [Google Scholar]
- 10.Nicholson JK, Lindon JC, Holmes E. ‘Metabonomics’: understanding the metabolic responses of living systems to pathophysiological stimuli via multivariate statistical analysis of biological NMR spectroscopic data. Xenobiotica. 1999;29:1181–1189. doi: 10.1080/004982599238047. [DOI] [PubMed] [Google Scholar]
- 11.Feng JJ, Hao G, Min CY, Xie L, Liu L, Lv T, Xie HP. Metabonomics of liver toxicity from Traditional Chinese Medicine Huang-Yao-Zi studied by mass spectrum-based orthogonal projection method. Chemometrics and Intelligent Laboratory Systems. 2014;135:201–207. [Google Scholar]
- 12.Jia H, Su Z, Long W, Liu Y, Chang X, Zhang H, Ding G, Feng Y, Cai D, Zou Z. Metabonomics Combined with UPLC-MS Chemical Profile for Discovery of Antidepressant Ingredients of a Traditional Chinese Medicines Formula, Chaihu-Shu-Gan-San. Evid Based Complement Alternat Med. 2013;2013:487158. doi: 10.1155/2013/487158. [DOI] [PMC free article] [PubMed] [Google Scholar]
- 13.Xu W, Wang H, Chen G, Li W, Xiang R, Pei Y. (1)H NMR-based metabonomics study on the toxicity alleviation effect of other traditional Chinese medicines in Niuhuang Jiedu tablet to realgar (As2S2) J Ethnopharmacol. 2013;148:88–98. doi: 10.1016/j.jep.2013.03.073. [DOI] [PubMed] [Google Scholar]
- 14.Garcia A, Barbas C. Gas chromatography-mass spectrometry (GC-MS)-based metabolomics. Methods Mol Biol. 2011;708:191–204. doi: 10.1007/978-1-61737-985-7_11. [DOI] [PubMed] [Google Scholar]
- 15.Hiller K, Hangebrauk J, Jager C, Spura J, Schreiber K, Schomburg D. Metabolite Detector: comprehensive analysis tool for targeted and nontargeted GC/MS based metabolome analysis. Anal Chem. 2009;81:3429–3439. doi: 10.1021/ac802689c. [DOI] [PubMed] [Google Scholar]
- 16.Tsugawa H, Tsujimoto Y, Arita M, Bamba T, Fukusaki E. GC/MS based metabolomics: development of a data mining system for metabolite identification by using soft independent modeling of class analogy (SIMCA) BMC Bioinformatics. 2011;12:131. doi: 10.1186/1471-2105-12-131. [DOI] [PMC free article] [PubMed] [Google Scholar]