

Abstract
Background: Pancreatic cancer has the worst prognosis and early detection is crucial for improving patient prognosis. Therefore, we performed a meta-analysis to evaluate and compare the sensitivity and specificity of single test of CA19-9, CA242, and CEA, as well as combination test in pancreatic cancer detection. Methods: We searched PubMed, Embase, Medline, and Wanfang databases for studies that evaluated the diagnostic validity of CA19-9, CA242, and CEA between January 1990 and September 2014. Data were analyzed by Meta-Disc and STATA software. Results: A total of 21 studies including 3497 participants, which fulfilled the inclusion criteria were considered for analysis. The pooled sensitivities for CA19-9, CA242, and CEA were 75.4 (95% CI: 73.4-77.4), 67.8 (95% CI: 65.5-70), and 39.5 (95% CI: 37.3-41.7), respectively. The pooled specificities of CA19-9, CA242, and CEA were 77.6 (95% CI: 75.4-79.7), 83 (95% CI: 81-85), and 81.3 (95% CI: 79.3-83.2), respectively. Parallel combination of CA19-9+CA242 has a higher sensitivity (89, 95% CI: 80-95) without impairing the specificity (75, 95% CI: 67-82). Conclusions: Our meta-analysis showed that CA242 and CA19-9 have better performance in the diagnosis of pancreatic cancer than CEA. Furthermore, parallel combination test of CA19-9+CA242 could be of better diagnostic value than individual CA242 or CA19-9 test.
Keywords: CA19-9, CA242, CEA, meta-analysis, pancreatic cancer
Introduction
Pancreatic cancer, a lethal malignancy, is the fourth or fifth commonest cause of cancer mortality [1]. Approximately 330,300 people are diagnosed with the disease and die from it per year worldwide, with a cancer prevalence of 211,500 cases in 2012 [2]. This is in part due to the fact that pancreatic cancer has a very poor prognosis. No early detection tests are available and most patients are not diagnosed until late stage [3]. In a study from Japanese Registry, it was reported that patients with stage I tumors (<2 cm size) had a better survival than patients with stage IIb tumors (58% vs. 17% alive at 5 years) [4]. Therefore, many researchers have focused on the development of early detection methods for pancreatic cancer.
Imaging modalities are used for the diagnosis of pancreatic cancer, including endoscopic ultrasonography (EUS), endoscopic retrograde cholangiopancreatography (ERCP), computed tomography (CT), magnetic resonance imaging (MRI), magnetic resonance cholangiopancreatography (MRCP), 18F-fluorodeoxyglucose-positron emission tomography (18F-FDGPET), and laparoscopy/laparotomy. However, these complex and expensive imaging modalities have failed in the early screening of pancreatic cancer. Therefore, simple and cost-effective modalities that can be used in early screening of pancreatic cancer are urgently needed.
Various tumor markers have been studied in connection with pancreatic cancer, including carbohydrateantigen19-9 (CA19-9), CA242, and carcinoembryonic antigen (CEA) [5]. CA19-9 is an isolated form of Lewis antigen, which is widely used for pancreatic cancer diagnosis in clinical setting. However, CA19-9 may be elevated in patients with nonmalignant diseases or other gastrointestinal cancers [6]. CEA was found in gastrointestinal tissue during fetal development and colorectal carcinoma, and has been used to diagnose colon cancer, pancreatic cancer, and gastric cancer. However, it may also become positive in heavy smokers and people with nonspecific colitis. CA242 was obtained by immunization of mice with human cell line COLO205 fused with the Sp 2/0 mouse myeloma cell line [7]. It is also an important serum tumor marker for the diagnosis of pancreatic cancer. However, to date there has been no systematic evaluation of the diagnostic potency of the three makers individually or in combination. Accordingly, we performed a meta-analysis to evaluate the sensitivity and specificity of CA19-9, CA242, and CEA in diagnosing pancreatic cancer.
Methods
Search strategy and inclusion criteria
A literature search for human studies was performed to screen publications on the diagnostic performance of CA19-9, CA242, and CEA for pancreatic cancer. PubMed, Medline, Embase, and Wanfang databases were searched for relevant publications in Chinese or in English from January 1990 to September 2014. The keywords “CA19-9 OR carbohydrate antigen 19-9”, “CA242 OR carbohydrate antigen 242”, “CEA OR carcinoembryonic antigen”, “pancreatic cancer OR pancreatic tumor OR pancreatic carcinoma” were used.
Two reviewers independently reviewed each publication. The abstracts were scanned to identify potentially eligible articles and then the full texts of these articles were read to determine whether they should be included in our study. Any disagreement was discussed and solved by a third reviewer. The inclusion criteria were: (1) Compare the sensitivity and specificity of CA19-9, CA242, and CEA in pancreatic cancer; (2) Have reported or provided sufficient data to allow us to calculate the true positive (TP), false negative (FN), false positive (FP) and true negative (TN) values; (3) Patients with pancreatic cancer were confirmed by surgical and pathological characteristics or radiographic examination.
Data extraction and quality assessment
The following information from each study was extracted independently by 2 reviewers: (1) First author name; (2) Year of publication; (3) Number of patients; (4) Detection methods; (5) Event numbers in TP, FN, TN and FP arms; (6) Cut off value of CA19-9, CA242, and CEA. The QUADAS score was used to assess the quality of included studies.
Data analysis
The pooled sensitivity, specificity, diagnostic odds ratio (DOR) and the likelihood ratios [positive likelihood ratio (PLR) and negative likelihood ratio (NLR)] for single test or combination tests were calculated by Meta-Disc version 1.4. The I-squared value (I2) was used to assess the statistical heterogeneity among the studies. The estimate below 25% was regarded as low heterogeneity and above 75% was labeled as high heterogeneity [8]. If heterogeneity existed, a random effect model was used for meta-analysis; otherwise, a fixed effect model was chosen. In addition, subgroup analyses were performed according to the detection method (ELISA vs. CLIA), control groups (benign vs. healthy), and cut off value to assess potential sources of variation in the study results. Publication bias was analyzed by STATA12 software (Stata Corp, College Station, TX, USA).
Results
Literatures
A total of 143 citations were obtained via database searches; and among them, twenty-one met the inclusion criteria for this study (Figure 1). These studies included 1896 pancreatic cancer cases, 940 benign pancreatic diseases cases and 661 healthy cases (Table 1). The quality assessment of included studies was shown in Figure 2.
Figure 1.
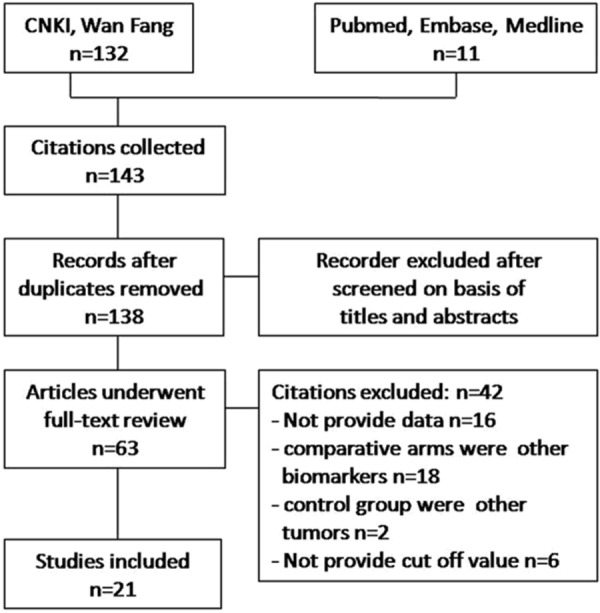
Flow diagram of the studies identified.
Table 1.
Main characteristics of the studies included in the meta-analysis
| Study (year) | Case | Control | CA199 | CA242 | CEA | ||||||
|---|---|---|---|---|---|---|---|---|---|---|---|
|
| |||||||||||
| Method | Cutoff | TP/FP/FN/TN | Method | Cutoff | TP/FP/FN/TN | Method | Cutoff | TP/FP/FN/TN | |||
| Wang L (2000) [9] | 130 | B | ELISA | 37 | 40/27/5/58 | ELISA | 21 | 37/34/8/51 | ELISA | 3.2 | 32/61/13/24 |
| Liu CM (2004) [10] | 74 | H | ELISA | 37 | 26/6/7/34 | ELISA | 20 | 24/5/10/35 | ELISA | 5 | 14/7/20/33 |
| Cui LH (2008) [11] | 74 | B | ELISA | 35 | 30/4/10/30 | ELISA | 20 | 28/5/12/29 | ELISA | 5 | 24/6/16/28 |
| Dong AP (2009) [12] | 165 | B/H | RIA | 37 | 45/24/9/86 | RIA | 20 | 44/26/11/84 | RIA | 10 | 36/36/19/74 |
| Wang P (2003) [13] | 64 | B | CLIA | 60 | 30/4/12/18 | ELISA | 20 | 29/6/13/16 | CLIA | 5 | 20/2/22/20 |
| Li XM (2014) [14] | 249 | H | CLIA | 37 | 90/17/39/103 | ELISA | 20 | 83/28/46/92 | CLIA | 5 | 54/41/75/79 |
| Yang YC (2007) [15] | 244 | B | ELISA | 37 | 134/20/39/51 | ELISA | 20 | 110/17/63/54 | ELISA | 5 | 53/6/120/65 |
| Cheng J (2012) [16] | 466 | B/H | CLIA | 35 | 171/6/94/195 | CLIA | 20 | 150/3/115/198 | CLIA | 5 | 102/7/163/194 |
| Li XM (2013) [17] | 229 | H | CLIA | 35 | 88/21/21/99 | ELISA | 20 | 78/19/31/101 | CLIA | 5 | 47/37/62/83 |
| Li N (2001) [18] | 123 | B | CLIA | 35 | 50/23/13/37 | CLIA | 20 | 47/10/16/50 | CLIA | 5 | 27/12/36/48 |
| Lu C (2005) [19] | 95 | B/H | CLIA | 37 | 31/16/7/41 | CLIA | 20 | 30/9/8/48 | CLIA | 5 | 23/22/15/35 |
| Xia F (2006) [20] | 138 | B | CLIA | 35 | 58/8/23/49 | CLIA | 20 | 59/6/22/51 | CLIA | 5 | 50/10/31/47 |
| Li FM (2010) [21] | 125 | B | ECLIA | 35 | 38/22/7/58 | ECLIA | 10 | 32/9/13/71 | ECLIA | 10 | 15/15/30/65 |
| You YQ (2012) [22] | 100 | B | ECLIA | 37 | 39/21/11/29 | ECLIA | 25 | 40/18/10/22 | ECLIA | 5 | 21/19/29/31 |
| Liao Q (2007) [23] | 150 | B | ELISA | 37 | 84/15/28/23 | ELISA | 20 | 66/10/46/28 | ELISA | 5 | 37/2/75/36 |
| Zhang LZ (2008) [24] | 160 | B | CLIA | 37 | 71/9/24/56 | ELISA | 20 | 71/5/24/60 | CLIA | 10 | 40/8/55/57 |
| Yan H (2005) [25] | 98 | H | CLIA | 35 | 56/6/10/26 | CLIA | 20 | 52/5/14/27 | CLIA | 5 | 45/8/21/24 |
| Gao YC (2005) [26] | 496 | B | CLIA | 37 | 236/71/79/110 | RIA | 20 | 222/52/93/129 | CLIA | 10 | 74/7/241/174 |
| Huang BX (2011) [27] | 75 | B | CLIA | 37 | 37/4/8/26 | CLIA | 20 | 28/7/17/23 | CLIA | 10 | 18/6/27/24 |
| Zhang M (2005) [28] | 146 | H | MEIA | 37 | 38/21/8/79 | MEIA | 20 | 35/11/11/89 | MEIA | 5 | 12/20/34/80 |
| Jiang A (2011) [29] | 96 | H | ECLIA | 35 | 39/12/9/36 | ECLIA | 20 | 34/11/14/37 | ECLIA | 5 | 22/13/26/35 |
Figure 2.
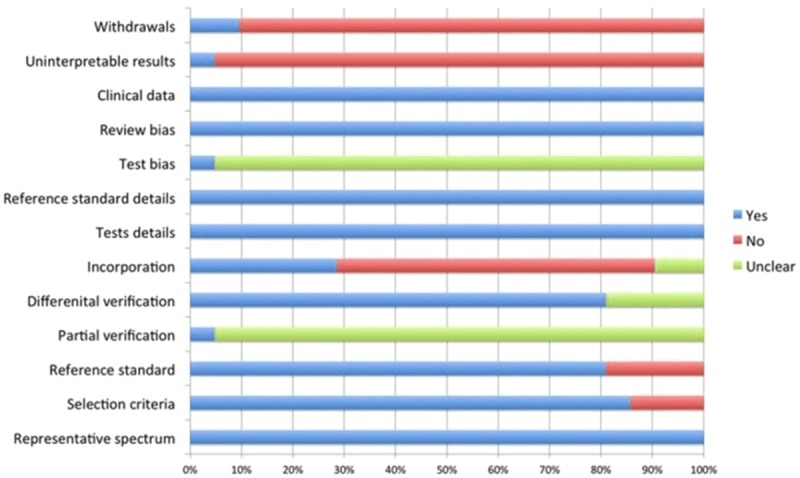
The QUADAS score of included studies.
Single biomarker analysis
The results of the meta-analysis are stated in Table 2. The pooled sensitivities for CA19-9, CA242, and CEA were 75.4 (95% CI: 73.4-77.4), 67.8 (95% CI: 65.5-70) and 39.5 (95% CI: 37.3-41.7), respectively. The pooled specificities of CA19-9, CA242, and CEA were 77.6 (95% CI: 75.4-79.7), 83 (95% CI: 81-85), and 81.3 (95% CI: 79.3-83.2), respectively. CA19-9 showed the highest sensitivity, followed by CA242. While for specificity, CA242 gave the highest result, followed by CEA. The pooled DOR for CA19-9, CA242, and CEA were 13.2 (95% CI: 9.33-18.66), 11.91 (95% CI: 0.39-16.91), and 3.53 (95% CI: 2.53-4.93), respectively. Because of the heterogeneity in the study, we used the random effects model to generate the ROC curves. The areas under the curve (AUCs) of CA19-9, CA242, and CEA were 0.85, 0.84, and 0.7, respectively.
Table 2.
Meta-analysis of CA19-9, CA242, and CEA for detecting pancreatic cancer
| Pooled estimates | CA19-9 | CA242 | CEA |
|---|---|---|---|
| overall | |||
| Study numbers | 19 | 18 | 20 |
| I2 (%) | 69.6 | 68.1 | 70.6 |
| Sensitivity (%) (95% CI) | 75.4 (73.4-77.4) | 67.8 (65.5-70) | 39.7 (37.4-41.9) |
| Specificity (%) (95% CI) | 77.6 (75.4-79.7) | 83 (81-85) | 81.3 (79.3-83.3) |
| PLR (95% CI) | 3.58 (2.82-4.54) | 4.10 (3.21-5.18) | 2.39 (1.84-3.11) |
| NLR (95% CI) | 0.31 (0.28-0.35) | 0.38 (0.34-0.45) | 0.71 (0.66-0.77) |
| DOR (95% CI) | 13.2 (9.33-18.66) | 11.91 (0.39-16.91) | 3.63 (2.56-5.12) |
| ROC area | 0.85 | 0.84 | 0.7 |
| Control groups | |||
| Benign | |||
| Study numbers | 11 | 10 | 11 |
| I2 (%) | 63.1% | 59.3 | 51 |
| Sensitivity (%) (95% CI) | 76.8 (74.1-79.3) | 68.4 (65.6-71.3) | 35.7 (32.8-38.7) |
| Specificity (%) (95% CI) | 70.2 (66.8-73.4) | 78.8 (75.2-81.9) | 86.6 (83.8-89.1) |
| PLR (95% CI) | 2.79 (2.216-3.52) | 3.35 (2.56-4.37) | 2.86 (1.99-4.1) |
| NLR (95% CI) | 0.33 (0.28-0.39) | 0.4 (0.34-0.46) | 0.71 (0.64-0.78) |
| DOR (95% CI) | 9.76 (6.51-14.62) | 8.86 (5.85-13.4) | 4.28 (2.84-6.45) |
| ROC area | 0.82 | 0.81 | 0.73 |
| Healthy | |||
| Study numbers | 6 | 5 | 6 |
| I2 (%) | 0 | 59.7 | 47.9 |
| Sensitivity (%) (95% CI) | 78.2 (74-80) | 70.8 (66-75.3) | 44.9 (40.2-49.7) |
| Specificity (%) (95% CI) | 82 (78.1-85.4) | 83.5 (79.6-86.9) | 72.6 (68.3-76.6) |
| PLR (95% CI) | 4.28 (3.5-5.24) | 4.46 (3.07-6.48) | 1.54 (1.22-2) |
| NLR (95% CI) | 0.27 (0.21-.033) | 0.34 (0.27-0.44) | 0.77 (0.65-0.91) |
| DOR (95% CI) | 17.13 (12.15-24.15) | 13.38 (7.44-24.06) | 2.1 (1.37-3.2) |
| ROC area | 0.88 | 0.85 | 0.62 |
| Methods | |||
| ELISA | |||
| Study numbers | 5 | 8 | 4 |
| I2 (%) | 50.7 | 61.7 | 0 |
| Sensitivity (%) (95% CI) | 77.9 (73.5-81.9) | 66.6 (63.1-70) | 35.7 (30.7-40.9) |
| Specificity (%) (95% CI) | 73.1 (67.4-78.3) | 81.4 (77.7-84.7) | 88.5 (83-92.8) |
| PLR (95% CI) | 2.97 (2.13-4.15) | 3.53 (2.62-4.77) | 3.29 (2.14-5.06) |
| NLR (95% CI) | 0.31 (0.24-0.39) | 0.41 (0.34-0.48) | 0.71 (0.62-0.8) |
| DOR (95% CI) | 11.11 (6.13-20.14) | 9.12 (5.67-14.68) | 5.19 (3.03-8.9 |
| ROC area | 0.84 | 0.82 | 0.75 |
| CLIA | |||
| Study numbers | 10 | 7 | 10 |
| I2 (%) | 80.5 | 79.7 | 80.6 |
| Sensitivity (%) (95% CI) | 73.6 (71-76.1) | 67.4 (64.1-70.5) | 39.8 (37-42.6 |
| Specificity (%) (95% CI) | 80.4 (77.7-82.9) | 85.1 (82.1-87.8) | 83 (80.4-85.3) |
| PLR (95% CI) | 4.36 (2.81-6.76) | 5.17 (2.87-9.31) | 2.67 (1.73-4.11) |
| NLR (95% CI) | 0.32 (0.28-0.37) | 0.37 (0.31-0.44) | 0.69 (0.61-0.78) |
| DOR (95% CI) | 15.24 (8.76-26.53) | 15.79 (7.56-32.99) | 4.13 (2.38-7.15) |
| ROC area | 0.87 | 0.87 | 0.72 |
| Cut off value | 37 U/ml | 20 U/ml | 10 ng/ml |
| Study numbers | 11 | 18 | 5 |
| I2 (%) | 65.9 | 68.1 | 23 |
| Sensitivity (%) (95% CI) | 76.4 (73.8-78.9) | 67.8 (65.5-70) | 33 (29.1-37.1) |
| Specificity (%) (95% CI) | 72.9 (69.7-75.9) | 83 (81-85) | 84.7 (81.1-87.9) |
| PLR (95% CI) | 3.04 (2.37-3.91) | 4.10 (3.21-5.18) | 2.68 (1.7-4.22) |
| NLR (95% CI) | 0.32 (0.28-0.38) | 0.38 (0.34-0.45) | 0.72 (0.63-0.84) |
| DOR (95% CI) | 10.56 (7-15.93) | 11.91 (0.39-16.91) | 4.13 (2.7-6.33) |
| ROC area | 0.83 | 0.84 | 0.72 |
| Cut off value | 35 U/ml | - | 5 ng/ml |
| Study numbers | 8 | - | 16 |
| I2 (%) | 56.3 | - | 73.8 |
| Sensitivity (%) (95% CI) | 73.9 (70.5-77.1) | - | 42.2 (39.5-44.9) |
| Specificity (%) (95% CI) | 83.9 (80.8-86.6) | - | 79.9 (77.5-82.2) |
| PLR (95% CI) | 4.57 (2.83-7.36) | - | 2.26 (1.67-3.05) |
| NLR (95% CI) | 0.29 (0.24-0.35) | - | 0.71 (0.65-0.78) |
| DOR (95% CI) | 18 (10.93-29) | - | 3.41 (2.25-5.15) |
| ROC area | 0.88 | - | 0.69 |
Subgroup analysis
Since heterogeneity existed in this study, we performed subgroup analysis to assess the source of heterogeneity. The results of subgroup analysis showed that for CA19-9 and CA242, the specificity was higher when the control group was healthy people. However, for CEA, the specificity was higher with benign cases as control, while the sensitivity was higher with healthy control. It was also found that for CA19-9, raising the cut off value from 35 U/ml to 37 U/ml may decrease the specificity. In contrast, raising the cut off value from 5 ng/ml to 10 ng/ml increased the specificity but decreased the sensitivity of CEA. However, it seemed that the detection method was not a potential source of variation.
Biomarkers combination analysis
Due to the limited sensitivity of single serum tumor marker test, combined multiple markers tests were considered to be able to improve the sensitivity. It was defined as positive for parallel combined test if the value of any of the tumor markers was higher than the cut off value. A positive result for serial combined testing was defined only when the values of all the tested tumor markers were higher than the corresponding cut off value. Due to the limited number of included studies, patients with benign pancreatic diseases were used as the control group for the combination test.
The meta-analysis results indicated that parallel combination patterns of CA19-9+CA242+CEA and CA19-9+CA242 had similar sensitivity (90, 95% CI: 81-96 and 89, 95% CI: 80-95, respectively), however, parallel combination pattern of CA19-9+CA242 had a higher specificity (75, 95% CI: 67-82) (Table 3). On the other hand, the specificity of all four combination patterns increased while the sensitivity decreased significantly in serial combination test.
Table 3.
Sensitivity and specificity of combination test
| Biomarkers | Sensitivity | Specificity |
|---|---|---|
| Parallel combination | ||
| CA19-9+CA242 | 0.89 (0.80-0.95) | 0.75 (0.67-0.82) |
| CA19-9+CEA | 0.85 (0.75-0.92) | 0.71 (0.63-0.79) |
| CA242+CEA | 0.76 (0.65-0.85) | 0.71 (0.62-0.78) |
| CA19-9+CA242+CEA | 0.9 (0.81-0.96) | 0.64 (0.56-0.72) |
| Serial combination | ||
| CA19-9+CA242 | 0.66 (0.59-0.73) | 0.87 (0.81-0.92) |
| CA19-9+CEA | 0.52 (0.45-0.6) | 0.8 (0.74-0.86) |
| CA242+CEA | 0.58 (0.5-0.65) | 0.89 (0.83-0.93) |
| CA19-9+CA242+CEA | 0.5 (0.42-0.57) | 0.93 (0.88-0.97) |
Publication bias
Deek’s funnel plot asymmetry test was used to examine publication bias. Publication bias was conducted by a regression of lnDOR against 1/ESS1/2, with P<0.05 for the slope coefficient indicating significant asymmetry [30]. The Deek’s asymmetry test result showed that there was no obvious publication bias in this study (Figure 3).
Figure 3.
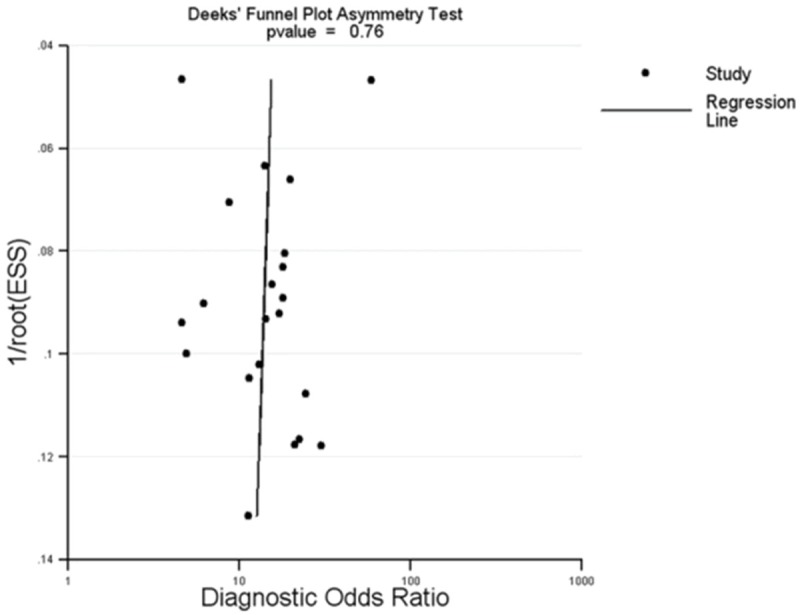
Deek’s funnel plot analysis to detect publication bias.
Discussion
This meta-analysis aimed to compare the diagnostic power of CA19-9, CA242 and CEA. In general, CA19-9 has the highest sensitivity and CA242 gives the highest specificity. Parallel combination test pattern of CA19-9+CA242 can increase sensitivity without impairing the specificity. It is well known that CA19-9 was the first choice as biomarker for pancreatic cancer. In subsequent validation studies, CA242 and CEA have also been found to be related with pancreatic cancer, and were gradually accepted as biomarkers for pancreatic cancer. Our meta-analysis indicated that the sensitivity of CA19-9 was significantly higher than those of CA242 and CEA, while the specificities of CA242 and CEA were higher than that of CA19-9.
There was significant heterogeneity in this study. The different study design can influence the pooled estimate. To account for these potential variations, subgroup analyses were performed. According to our meta-analysis, CA19-9 had a higher specificity when healthy people were used as control, and CEA had a higher specificity when patients with benign pancreatic diseases were used as control. The status of patient did not seem to influence the diagnostic capacity of CA242, as the serum level of CA242 does not increase during cholestasis or acute pancreatitis [31].
However, the single serum biomarker test has limited sensitivity and specificity. Therefore, we analyzed the different combination patterns of CA19-9, CA242, and CEA. Subgroup analyses were then performed according to the positive result definition (parallel and serial). Parallel combination usually increased the diagnostic sensitivity but decreased the specificity, while serial combination decreased the diagnostic sensitivity but increased the specificity. Among the different combination patterns, parallel combination pattern of CA19-9+CA242 could increase sensitivity without impairing the specificity.
There are some limitations in our study. Firstly, heterogeneity existed in this study. Through subgroup analysis, it was found that besides the status of control (with or without benign pancreatic disease), different cut off values of the included studies may be another potential source of heterogeneity. Secondly, the blinded test was not documented in most studies. Studies lacking a blinded design were likely to report a better performance. Thus, this may influence the accuracy of the meta-analysis results. Thirdly, we are unable to perform subgroup analysis according to the stage of pancreatic cancer, because only a few studies reported sensitivity and specificity of these tumor biomarkers according to the different stage of pancreatic cancer. Fourthly, the sample size for the combination test was small due to the limited number of studies. Therefore, large, double-blinded, multiple center randomized controlled trials are needed. Still, despite these limitations, we believe that our analysis could contribute to the comprehensive evaluation of biomarkers in pancreatic cancer diagnosis.
In conclusion, our meta-analysis showed that CA242 and CA19-9 have better performance in the diagnosis of pancreatic cancer than CEA. Furthermore, parallel combination pattern of CA19-9+CA242 could be considered of better diagnostic value for pancreatic cancer patients. Further large scale studies are needed to verify our findings.
Acknowledgements
This work was supported by National Natural Science Foundation of China (No. 81172692 and 81373036) and special grant from Zhejiang Provincial Department of Science and Technology (No. 2013C14016).
Disclosure of conflict of interest
None.
References
- 1.Maisonneuve P, Lowenfels AB. Epidemiology of pancreatic cancer: an update. Dig Dis. 2010;28:645–56. doi: 10.1159/000320068. [DOI] [PubMed] [Google Scholar]
- 2.Bochatay L, Girardin M, Bichard P, Frossard JL. [Pancreatic cancer in 2014: screening and epidemiology] . Rev Med Suisse. 2014;10:1582–5. [PubMed] [Google Scholar]
- 3.He XY, Yuan YZ. Advances in pancreatic cancer research: Moving towards early detection. World J Gastroenterol. 2014;20:11241–11248. doi: 10.3748/wjg.v20.i32.11241. [DOI] [PMC free article] [PubMed] [Google Scholar]
- 4.Egawa S, Toma H, Ohigashi H, Okusaka T, Nakao A, Hatori T, Maguchi H, Yanagisawa A, Tanaka M. Japan Pancreatic Cancer Registry; 30th year anniversary: Japan Pancreas Society. Pancreas. 2012;41:985–92. doi: 10.1097/MPA.0b013e318258055c. [DOI] [PubMed] [Google Scholar]
- 5.Ni XG, Bai XF, Mao YL, Shao YF, Wu JX, Shan Y, Wang CF, Wang J, Tian YT, Liu Q, Xu DK, Zhao P. The clinical value of serum CEA, CA19-9, and CA242 in the diagnosis and prognosis of pancreatic cancer. Eur J Surg Oncol. 2005;31:164–9. doi: 10.1016/j.ejso.2004.09.007. [DOI] [PubMed] [Google Scholar]
- 6.Duffy MJ, Sturgeon C, Lamerz R, Haglund C, Holubec VL, Klapdor R, Nicolini A, Topolcan O, Heinemann V. Tumor markers in pancreatic cancer: a European Group on Tumor Markers (EGTM) status report. Ann Oncol. 2010;21:441–7. doi: 10.1093/annonc/mdp332. [DOI] [PubMed] [Google Scholar]
- 7.Gui JC, Yan WL, Liu XD. CA19-9 and CA242 as tumor markers for the diagnosis of pancreatic cancer: a meta-analysis. Clin Exp Med. 2014;14:225–33. doi: 10.1007/s10238-013-0234-9. [DOI] [PubMed] [Google Scholar]
- 8.Higgins JP, Thompson SG, Deeks JJ, Altman DG. Measuring inconsistency in meta-analyses. BMJ. 2003;327:557–60. doi: 10.1136/bmj.327.7414.557. [DOI] [PMC free article] [PubMed] [Google Scholar]
- 9.Wang L, Li ZY, Zou X. The expression of CEA, CA19-9, CA242, TPA in patients with pancreatic cancer. Shandong Med J. 2000;40:24–25. [Google Scholar]
- 10.Liu CM, Gui X, Duan XH. Significance of serum CA19-9 detection in the diagnosis of pancreatic cancer. Journal Of Xinjiang Medical University. 2004;27:281–282. [Google Scholar]
- 11.Cui LH, Pu J, Li X, Wang XH. Combined detection of serum tumor markers in patients with pancreatic cancer. RENMIN JUNYI. 2008;51:587–588. [Google Scholar]
- 12.Dong AP, Huang L. Role of combined detection of serum tumor markers in diagnosis of pancreatic cancer. Journal of Xianning University (Medical Sciences) 2009;23:209–211. [Google Scholar]
- 13.Wang P, Cui TP, Wu JM, Sun P. Role of combined detection of serum tumor markers in diagnosis of pancreatic cancer. Central China Medical Journal. 2003;27:F003–F004. [Google Scholar]
- 14.Li XM, Wang LZ, Gong GF, Zhu Y. Clinical research of serum MIC-1, CA19-9, CA242 and CEA in patients with pancreatic cancer. J Clin Intern Med. 2014;31:31–33. [Google Scholar]
- 15.Yang YC, Zhao YP, Liao Q, Li LJ, Han SM. Role of serum tumor markers in differential diagnosis of pancreatic occupancy. Chin J Hepatobiliary Surg. 2007;13:361–363. [PubMed] [Google Scholar]
- 16.Chen J, Chen C. Value of combined detection of serum multi-tumor markers in diagnosis of pancreatic carcinoma. Med J Natl Defending Forces Southwest China. 2012;22:1324–1327. [Google Scholar]
- 17.Li XM, Hu S, Zhu Y, Gong GF. Role of serum VEGF, CA19-9, CA242 and CEA in diagnosis of pancreatic cancer. Int J Lab Med. 2013;34:739–741. [Google Scholar]
- 18.Li N, Shen SQ, Liu JC. Values of CA19-9, CA242, CEA, and CA125 in diagnosis and prognosis for pancreatic cancer. Chin J Bases Clin General Surg. 2011;18:300–304. [Google Scholar]
- 19.Lu C, Wang CD, Chen YL. Value of combined detection of CEA, CA19-9 and CA242 in diagnosis of pancreatic carcinoma. 2005;14:601–602. [Google Scholar]
- 20.Xia F, Zheng J, Wang SG, Dong JH. Clinical significance of 12 tumor markers detection using protein biochip in the diagnosis of pancreatic carcinoma. J Digest Surg. 2006;5:111–114. [Google Scholar]
- 21.Li FM. Role of combined detection of serum CEA, CA19-9 and CA242 in diagnosis of pancreatic cancer. J Radioimmunlol. 2010;23:448–449. [Google Scholar]
- 22.You YQ, Lin FQ, Gong DY, Li ZP. Value of five serum tumor markers in diagnosis of pancreatic carcinoma. Int J Lab Med. 2012;33:1266–1267. [Google Scholar]
- 23.Liao Q, Zhao YP, Yang YC, Li LJ, Long X, Han SM. Combined detection of serum tumor markers for differential diagnosis of solid lesions located at the pancreatic head. Hepatobiliary Pancreat Dis Int. 2007;6:641–5. [PubMed] [Google Scholar]
- 24.Zhang LZ, Zhao Z, Wu B. Assay and clinical significance of serum tumor markers in diagnosis of pancreatic carcinoma. Cancer Res Clin. 2008;20:754–756. [Google Scholar]
- 25.Yan H. Value of CEA, CA19-9, CA242 and Ferritin in diagnosis of pancreatic carcinoma. Journal of Changzhi Medical College. 2005;19:290–291. [Google Scholar]
- 26.Gao YC, Lu HK, Liu XD, Lu Y. Complement-arity between serum tumor markers in pancreatic carcinoma. J Shanghai Second Med University. 2005;25:1239–1241. [Google Scholar]
- 27.Huang BX, Xu J. Value of serum tumor markers in diagnosis of pancreatic carcinoma. Modern Journal of Integrated Traditional Chinese and Western Medicine. 2011;20:873–874. [Google Scholar]
- 28.Zhang M. Diagnosis of pancreatic cancer through detecting 4 tumor markers in serum. Occupation and Health. 2005;21:1007–1008. [Google Scholar]
- 29.Jiang A, Xiao JY, Liu XD. Value of combined detection of CA19-9, CA125, CA242 and CEA in diagnosis of pancreatic carcinoma. Shandong Med J. 2011;51:43–44. [Google Scholar]
- 30.Deeks JJ, Macaskill P, Irwig L. The performance of tests of publication bias and other sample size effects in systematic reviews of diagnostic test accuracy was assessed. J Clin Epidemiol. 2005;58:882–93. doi: 10.1016/j.jclinepi.2005.01.016. [DOI] [PubMed] [Google Scholar]
- 31.Zhang LZ, Gong YF, Tu ZX. Quantitative determination of serum levels of CA242 in patients with pancreatic cancer and its significance. Chin J Pancreatol. 2002;2:20–21. [Google Scholar]