

Abstract
Background:
Tumor-infiltrating lymphocytes (TILs) are usually measured using subjective methods. Studies suggest that TIL subtypes have independent roles in cancer and that they could support the use of novel immunostimulatory therapies. We simultaneously measured TIL subtypes in non–small cell lung cancer (NSCLC) samples using objective methods and determined their relationship with clinico-pathologic characteristics and survival.
Methods:
Using multiplexed quantitative fluorescence (QIF), we measured the levels of CD3, CD8, and CD20 in 552 NSCLC from two independent collections represented in tissue microarrays (YTMA79, n = 202 and YTMA140, n = 350). The level of TILs was obtained in different tumor compartments using cytokeratin stain to define tumor cells and 4’,6-Diamidino-2-Phenylindole. Association of TILs with clinical parameters was determined using univariate and multivariable analyses. All statistical tests were two-sided.
Results:
In both NSCLC collections there was a low correlation between the three TIL markers (linear regression coefficients (R2) = 0.19–0.22, P < .001 for YTMA79 and R2 = 0.23–0.32, P < .001 for YTMA140). No consistent association between the level of TIL subtypes and age, sex, smoking history, tumor size, stage, and histology type was found. In univariate analysis, an elevated CD3 or CD8 signal was statistically significantly associated with longer survival in both collections. However, only CD8 was independent from age, tumor size, histology, and stage in multivariable analysis. High CD20 was associated with longer survival in the YTMA79 cohort.
Conclusions:
Increased levels of CD3 and CD8 + TILs are associated with better outcome in NSCLC, but only CD8 is independent from other prognostic variables. Objective measurement of TIL subpopulations could be useful to predict response or evaluate the local immune effect of anticancer immune checkpoint inhibitors.
Increased tumor-infiltrating lymphocytes (TILs) have been consistently associated with better outcome in diverse human neoplasms, including melanoma, colorectal, and triple- negative carcinomas (1). Similarly, increased total TILs has been associated with longer survival in non–small cell lung cancer (NSCLC) (2–4). However, studies using chromogenic immunohistochemistry (IHC) to characterize the prognostic effect of specific TIL subtypes in NSCLC have reported conflicting results (5–8). Diverse studies indicate that in tumors, immune cell subpopulations are strategically distributed within different tissue compartments (1). Some immune cell subtypes are located predominantly within the tumor core and others in the surrounding stroma or at the invasive front. Moreover, structurally organized and vascularized B cell–rich aggregates of lymphoid cells mimicking secondary lymphoid follicles, termed tertiary lymphoid tissues/structures, have been recognized and positively associated with outcome in human tumors (1,9–10). This suggests that different immune cell populations have different biological roles in tumor control and that the spatial orientation of immune cell subtypes with respect to cancer cells might be of biological relevance.
Novel immunostimulatory therapies using monoclonal antibodies targeting specific immune checkpoint targets such as CTLA-4, PD-1, and PD-L1 (alone or in combination with chemotherapy) have shown durable responses in a subset of patients with heavily pretreated, advanced NSCLC (11). There has been considerable interest in these agents because in general they are well tolerated and have demonstrated clinical activity in adenocarcinomas and also squamous tumors currently lacking effective targeted therapies. Preliminary observations indicate that clinical responses to immune checkpoint blockers are associated with elevated tumor levels of immune inhibitory signals, such as IDO-1 and PD-L1, and with increased TILs or specific TIL subtypes (11–14). Moreover and as expected, side effects associated with such immunotherapies are also commonly associated with increased inflammatory infiltrates in the affected tissue/organ. Therefore, methods for accurate characterization and measurement of TIL subpopulations in the context of cancer tissues and targeted immunotherapies are needed and might help in prognosis assessment and prediction of treatment response.
The traditional way to determine TILs in formalin-fixed paraffin-embedded (FFPE) tissue samples is by pathologist scoring of hematoxylin and eosin (H&E)–stained preparations. However, the information provided by this method is only semiquantitative and subject to considerable interobserver variation. Measurement of TILs using chromogenic IHC provides excellent cellular detail and potentially quantitative output, but is limited to simultaneous assessment of only one to two cellular subtypes without the architectural context. Herein, we simultaneously characterize the TIL subpopulations in FFPE samples from two independent NSCLC cohorts using multiplexed quantitative immunofluorescence (QIF). In addition, we determine the clinico-pathological associations and prognostic value of different TIL subtypes in NSCLC.
Methods
Patients, Cohorts, and Tissue Microarrays
FFPE samples from two previously reported and well-characterized retrospective collections of NSCLC represented in tissue microarrays (TMAs) were included in the study (4,15). One collection termed YTMA79 comprises samples from 202 NSCLC patients seen at Yale Pathology between 1988 and 2003. The second collection termed YTMA140 includes samples from 350 NSCLC patients, collected independently at Sotiria General Hospital and Patras University General Hospital (Greece) between 1991 and 2001. Clinico-pathological information from patients in both cohorts was collected from clinical records and pathology reports. Detailed characteristics of the cohorts are presented in Supplementary Table1 (available online). All tissue was used after approval from the Yale Human Investigation Committee protocol #9505008219, which approved the patient consent forms or in some cases waiver of consent.
TMAs were prepared using standard procedures as previously described (16). Briefly, after pathology review of H&E-stained preparations, 0.6mm cores were obtained from the original paraffin blocks using a needle and inserted into a recipient paraffin block. For better representation of the tumors, at least two cores obtained from different areas were included in the TMAs (see Supplementary Figure 1, C-E, available online). Because sections from two blocks containing cores from different tumor areas were measured for each cohort and some cases were represented twice in each block, a minimum of two cores and maximum of four cores were included for each case. YTMA79 contained 202 case patients, 13 (6.4%) of which were absent or excluded in the first block and 12 (5.9%) in the second. No case patient was absent in both blocks, and three case patients (1.5%) had representation only of the stromal compartment. YTMA140 contained 350 case patients, 22 (6.3%) of which were absent or excluded in the first block and 12 (3.4%) in the second. Only one case patient was absent in both blocks, and seven (2%) had representation only of the stromal compartment.
Multiplexed TILs Immunofluorescence Staining
Validation and details of the multiplexing TIL protocol are presented in Brown et al. (17). Briefly, fresh TMA cuts were deparaffinized and subjected to antigen retrieval using EDTA buffer (Sigma-Aldrich, St Louis, MO) pH = 8.0 and boiled for 20minutes at 97° C in a pressure-boiling container (PT module, Lab Vision). Slides were then incubated with dual endogenous peroxidase block (DAKO #S2003, Carpinteria, CA) for 10minutes at room temperature and subsequently with a blocking solution containing 0.3% bovine serum albumin in 0.05% Tween solution for 30 minutes. Staining for pancytokeratin, CD3, CD8, and CD20 was performed using a sequential multiplexed immunofluorescence protocol with isotype-specific primary antibodies to detect epithelial tumor cells (cytokeratin, clone M3515, 1:100, DAKO), T lymphocytes (CD3 IgG, 1:100, clone E272, Novus biologicals, CO), cytotoxic T cells (CD8 IgG1, 1:250, clone C8/144B, DAKO), and B lymphocytes (CD20 IgG2a, 1:150, clone L26, DAKO). Nuclei were highlighted using 4’,6-Diamidino-2-Phenylindole (DAPI). Secondary antibodies and fluorescent reagents used were goat anti-rabbit Alexa546 (1:100, Invitrogen), anti-rabbit Envision (K4009, DAKO) with biotynilated tyramide/Streptavidine-Alexa750 conjugate (Perkin-Elmer), anti-mouse IgG1 antibody (1:100, eBioscience, CA) with fluorescein-tyramide (Perkin-Elmer), anti-mouse IgG2a antibody (1:200, Abcam, MA) with Cy5-tyramide (Perkin-Elmer). Residual horseradish peroxidase activity between incubations with secondary antibodies was eliminated by exposing the slides twice for seven minutes to a solution containing benzoic hydrazide (0.136mg) and hydrogen peroxide (50 µl). Fresh whole-tissue section cuts from morphologically normal human tonsil were included in each staining batch as positive control and to assess the interexperimental reproducibility.
Fluorescence Measurement, Scoring, and Cutpoint Selection
Quantitative measurement of the fluorescent signal was performed using the AQUA (Genoptix Inc, Carlsbad, CA) method that enables objective and sensitive measurement of targets within user-defined tissue compartments (4,18). Briefly, the QIF score of each fluorescence channel in the tumor and/or stromal compartment was calculated by dividing the target TIL marker pixel intensity by the area of the desired compartment defined by the cytokeratin positivity (eg, tumor compartment), absence of cytokeratin positivity (eg, stromal compartment), or the DAPI-positive cells (eg, total tissue including tumor and stroma). Scores were normalized to the exposure time and bit depth at which the images were captured, allowing scores collected at different exposure times to be comparable. Stained slides were visually examined by a pathologist, and cases with staining artifacts were excluded. To stratify the patients according to the marker levels for survival analysis achieving statistically meaningful groups, the TIL scores obtained in the total tissue area were first split by tertiles, which indicated the possibility of collapsing the lower segments to define two distinct outcome-based groups: one including the highest tertile and another comprising the lower two segments (Supplementary Figure 2, available online).
Pathologist Evaluation of TILs
The scoring of TILs was performed in the same slides used for multiplexed immunofluorescence by consecutive staining with H&E. The preparations were read by a pathologist (DC) using a four-tiered scale based on the visual estimation of the proportion of lymphocytes in each histospot, as described (4,18). A score of 0 indicated virtual absence of TILs, 1+ = low TILs (<30%), 2+ = moderate (30%-60%), and 3+ = marked increase in the lymphocytic infiltrate (>60%). For survival analysis, case patients with TIL categories of 0 to 2+ were put in the low-TIL group and those with scores of 3+ were grouped as high-TIL tumor patients.
Statistical Analysis
For the statistical analysis, the maximal marker score obtained from all available cores of each case was used. QIF signals between compartments were analyzed using linear regression and correlation functions and expressed as regression/correlation coefficients. Patient characteristics were compared using the Student’s t test for continuous variables and chi-square test for categorical variables. Overall survival functions were compared using Kaplan-Meier estimates, and statistical significance was determined using the log-rank test. Univariate and multivariable Cox proportional hazards models including age, tumor size, smoking status, clinical stage, and histological subtype as covariables were built. To adjust for correlations between the TIL markers, three independent multivariable models were generated. Assumptions of proportionality for the Cox models were confirmed by generating Kaplan-Meier survival estimate curves of dichotomized variables and observing no intersection between the curves. All P values were based on two-sided tests, and all values under .05 were considered statistically significant. Statistical analyses were performed using JMP Pro software (version 9.0.0, 2010, SAS Institute Inc, Cary, NC) and GraphPad Prism v6.0 for Windows (GraphPad Software, Inc, San Diego, CA).
Results
Staining of morphologically normal FFPE human tonsil using H&E showed the expected presence of squamous epithelium-lining crypts and underlying lymphoid tissue with germinal center-containing follicles (Figure 1A, left panel). Using the multiplexed TILs assay to stain the same preparation, we simultaneously characterized the cellular components and their spatial association. As shown in Figure 1, the squamous tonsil epithelium shows prominent infiltration by CD3+ T cells, consistent with a lymphoepithelial structure (Figure 1A, right panel). In addition, the tissue is characterized by the presence of CD20-rich follicular structures, CD3+ cells with follicular and interfollicular disposition and CD8+ cytotoxic T cells that are preferentially located in the interfollicular regions. A comparable cellular detail was obtained in NSCLC samples. As shown in Figure 1, B and C, some tumors showed extensive infiltration by CD3+ TILs in both the tumor core and in the stroma (Figure 1B, right panel), while others showed predominance of stromal CD20+ B lymphocytes typically seen as relatively small aggregates reminiscent of tertiary lymphoid structures (Figure 1C, right panel). Of note, the clustering of immune cells is quite evident on H&E stain; however, the relative CD20 and CD3 positive populations are not (Figure 1, B and C, left panels).
Figure 1.
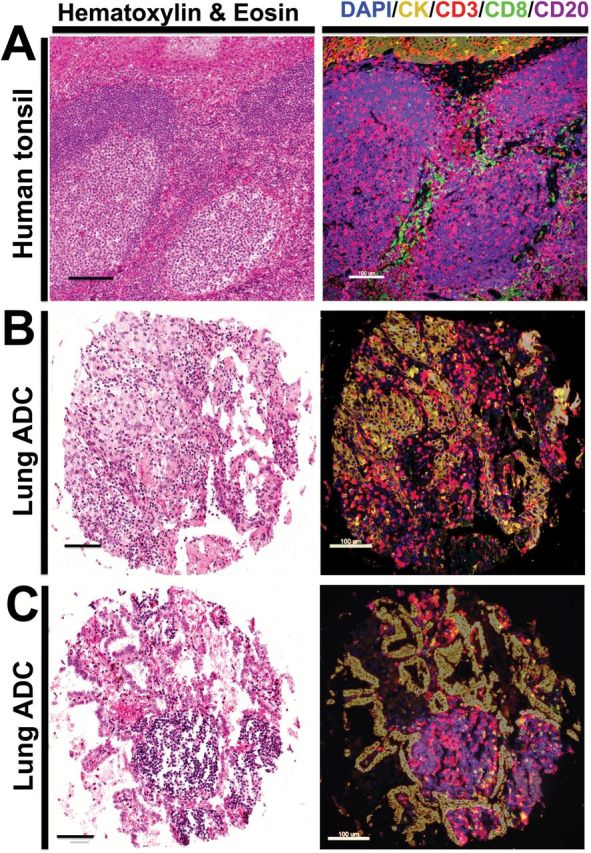
Characterization of tumor-infiltrating lymphocyte (TIL) subpopulations in formalin-fixed paraffin-embedded (FFPE) tissues using multiplexed quantitative immunofluorescence. A-C) Representative microphotographs showing sections from morphologically normal FFPE human tonsil (A) or lung adenocarcinomas (B-C) stained with hematoxylin and eosin (left panels) or with multiple immunofluorescence (right panels). Staining includes CD3 for T lymphocytes (red channel), CD8 for cytotoxic T cells (green), CD20 for B lymphocytes (purple), pancytokeratin for epithelial cells (yellow), and 4’,6-Diamidino-2-Phenylindole for nonselective nuclear staining (blue). The spatial relationship between specific TIL subtypes and tumor or stromal tissue compartments can be appreciated in the multiplexed stain. Bar = 100 µm.
In both NSCLC collections, the scores for CD3 in the total compartment were the highest, showing a continuous distribution and a high dynamic range that was more pronounced in YTMA140 containing approximately 40% more cases (Figure 2). Overall, there was only a limited association between the three TIL markers (linear regression coefficients [R2] = 0.19 to 0.22, P < .001 for YTMA79 and R2 = 0.23–0.32, P < .001 for YTMA140) (Supplementary Figure 1, A and B). As expected, the highest correlation was between CD3 and CD8. Similarly, there was only a low to modest association between each TIL marker in the tumor and stromal compartment (R2 = 0.3–0.69 for YTMA79 and R2 = 0.29–0.63 for YTMA140) (Figure 2, A and B, insets) and a low relationship between the TIL signals in two cores obtained from different tumor areas, suggesting heterogeneity of the measurements (eg, intercore regression) (Supplementary Figure 1 C-E, available online).
Figure 2.
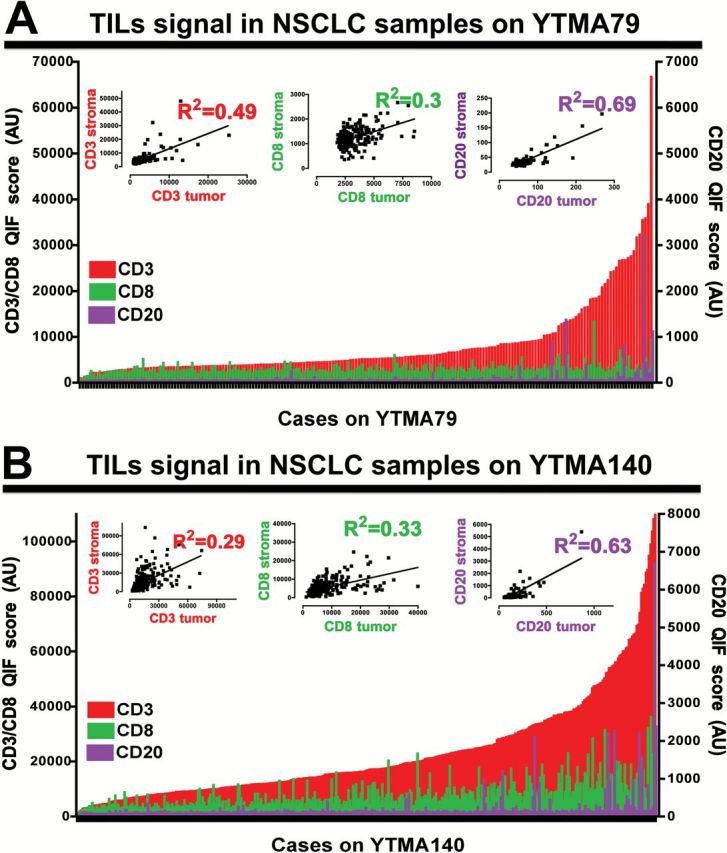
Distribution of tumor-infiltrating lymphocyte (TIL) signals in non–small cell lung cancer (NSCLC) samples from two independent populations. Charts showing the distribution of CD3 (red), CD8 (green), and CD20 (purple) quantitative fluorescence (QIF) signal in NSCLC samples from YTMA79 (A) and YTMA140 (B). The relationship between the signal intensity of each marker in the stromal and tumor (cytokeratin positive) compartment is shown in the insets. R2 = Linear regression coefficient. QIF scores are expressed as arbitrary units of fluorescence. AU = arbitrary units of fluorescence; NSCLC = non–small cell lung cancer; QIF = quantitative fluorescence; TIL = tumor-infiltrating lymphocyte.
For further analysis and as indicated above, the populations were split in two groups with high and low TIL signals, the first including the top tertile and the second the two lower tertiles (see Methods and Supplementary Figure 2, available online). Overall, no consistent association between the level of TIL subtypes and major clinico-pathological variables was found. Elevated CD8 was statistically significantly associated with a smoking history only in YTMA79, but not in YTMA140 (P = .03 and P = .40, respectively) (Tables 1 and 2). High CD20 signal was marginally associated with adenocarcinoma histology in YTMA79 (P = .05) (Table 1), but not in YTMA140 (P = .30) (Table 2). In addition, high CD8 signal was statistically significantly linked with adenocarcinoma histology only in YTMA140 (P = .01) (Table 2). No association between TIL subtypes and age, sex, tumor size, and clinical stage at diagnosis was identified.
Table 1.
Association between TILs signal and clinico-pathological variables in YTMA79
| Parameter | CD3 low No. (%) | CD3 high No. (%) |
P | CD8 low No. (%) | CD8 high No. (%) |
P | CD20 low No. (%) | CD20 high No. (%) | P |
|---|---|---|---|---|---|---|---|---|---|
| Age, y | |||||||||
| <70 | 85 (71.4) | 34 (28.6) | .22 | 81 (68.0) | 38 (32.0) | .47 | 82 (68.3) | 38 (31.7) | .78 |
| <70 | 40 (58.8) | 28 (41.2) | 45 (66.2) | 23 (33.8) | 43 (63.2) | 25 (36.8) | |||
| Sex | |||||||||
| Male | 62 (63.9) | 35 (36.1) | .33 | 67 (69.0) | 30 (30.9) | .73 | 67 (68.4) | 31 (31.6) | .35 |
| Female | 63 (69.2) | 28 (30.8) | 59 (64.8) | 32 (35.2) | 58 (63.7) | 33 (36.3) | |||
| Smoker | |||||||||
| No | 10 (71.4) | 4 (28.6) | .41 | 12 (85.7) | 2 (14.3) | .03 | 9 (64.3) | 5 (35.7) | .44 |
| Yes | 114 (66.3) | 58 (33.7) | 115 (66.9) | 57 (33.1) | 115 (66.5) | 58 (33.5) | |||
| Tumor size | |||||||||
| <3 cm | 45 (62.5) | 27 (37.5) | .62 | 46 (63.9) | 26 (36.1) | .34 | 42 (57.5) | 31 (42.5) | .49 |
| >3 cm | 40 (66.7) | 20 (33.3) | 43 (71.7) | 17 (28.3) | 38 (63.3) | 22 (36.7) | |||
| Stage | |||||||||
| I-II | 73 (61.3) | 46 (38.7) | .13 | 80 (67.2) | 39 (32.8) | .91 | 75 (62.5) | 45 (37.5) | .16 |
| III-IV | 41 (74.5) | 14 (25.5) | 36 (65.5) | 19 (34.5) | 38 (69.0) | 17 (31.0) | |||
| Histology | |||||||||
| ADC | 75 (65.8) | 39 (34.2) | .21 | 76 (66.7) | 38 (33.3) | .65 | 70 (60.9) | 45 (39.1) | .05* |
| SCC | 26 (78.8) | 7 (21.2) | 34 (79) | 9 (21.0) | 27 (81.8) | 6 (18.2) | |||
| Other | 26 (60.5) | 17 (39.5) | 27 (62.8) | 16 (37.2) | 30 (69.8) | 13 (30.2) |
*P value reflects the statistical difference between adenocarcinoma and squamous cell carcinoma. Values in parentheses indicate percentage of the group. Statistical significance determined by two-sided χ2 test. ADC = adenocarcinoma; SCC = squamous cell carcinoma.
Table 2.
Association between TILs signal and clinico-pathological variables in YTMA140
| Parameter | CD3 low No. (%) |
CD3 high No. (%) |
P | CD8 low No. (%) |
CD8 high No. (%) |
P | CD20 low No. (%) |
CD20 high No. (%) |
P |
|---|---|---|---|---|---|---|---|---|---|
| Age, y | |||||||||
| <70 | 179 (68.0) | 84 (32.0) | .99 | 172 (65.4) | 91 (34.6) | .13 | 180 (68.4) | 83 (31.6) | .18 |
| <70 | 53 (67.9) | 25 (32.1) | 58 (74.4) | 20 (25.6) | 47 (60.3) | 31 (39.7) | |||
| Sex | |||||||||
| Male | 203 (67.6) | 97 (32.3) | .69 | 201 (67.0) | 99 (33.0) | .63 | 196 (65.3) | 104 (34.7) | .18 |
| Female | 29 (70.7) | 12 (29.3) | 29 (70.7) | 12 (29.3) | 31 (75.6) | 10 (24.4) | |||
| Smoker | |||||||||
| No | 19 (67.9) | 9 (32.1) | .85 | 21 (75.0) | 7 (25.0) | .40 | 21 (75.0) | 7 (25.0) | .40 |
| Yes | 192 (69.6) | 84 (30.4) | 186 (67.4) | 90 (32.6) | 186 (67.4) | 90 (32.6) | |||
| Tumor size | |||||||||
| <3 cm | 33 (66.0) | 17 (34.0) | .75 | 33 (66.0) | 17 (34.0) | .79 | 32 (64.0) | 18 (36.0) | .62 |
| >3 cm | 194 (68.3) | 90 (31.7) | 193 (68.0) | 91 (32.0) | 192 (67.6) | 92 (32.4) | |||
| Stage | |||||||||
| I-II | 130 (65.0) | 70 (35.0) | .19 | 134 (67.0) | 66 (33.0) | .82 | 135 (67.5) | 65 (32.5) | .76 |
| III-IV | 97 (71.9) | 38 (28.1) | 92 (68.1) | 43 (31.9) | 89 (65.9) | 46 (34.1) | |||
| Histology | |||||||||
| ADC | 83 (62.4) | 50 (37.6) | .10 | 82 (61.7) | 51 (38.3) | .01* | 83 (62.4) | 50 (37.6) | .30 |
| SCC | 117 (70.0) | 50 (30.0) | 125 (74.9) | 42 (25.1) | 118 (70.7) | 49 (29.3) | |||
| Other | 33 (78.6) | 9 (21.4) | 24 (57.1) | 18 (42.9) | 27 (64.3) | 15 (35.7) |
*P value reflects the statistical difference between adenocarcinoma and squamous cell carcinoma. Values in parenthesis indicate percentage of the group. Statistical significance determined by two-sided χ2 test. ADC = adenocarcinoma; SCC = squamous cell carcinoma.
As shown in Figure 3, high CD3 or CD8 signals were statistically significantly associated with longer survival in both YTMA79 and YTMA140 (log-rank P = .009 for CD3 and P = .004 for CD8 on YTMA79 and log-rank P = .041 for CD3 and P = .002 for CD8 on YTMA140) (Figure 3, A and B, E and F). Increased CD20 signal was statistically significantly associated with better survival only in one NSCLC collection (log-rank P = .004 in YTMA79 and P = .293 in YTMA140) (Figure 3, C and G). Elevated TILs as scored by pathologist reading of H&E-stained slides (score 3+) was also associated with longer survival but did not reach statistical significance (log-rank P = .117 for YTMA79 and P = .091 for YTMA140) (Figure 3, D and H).
Figure 3.
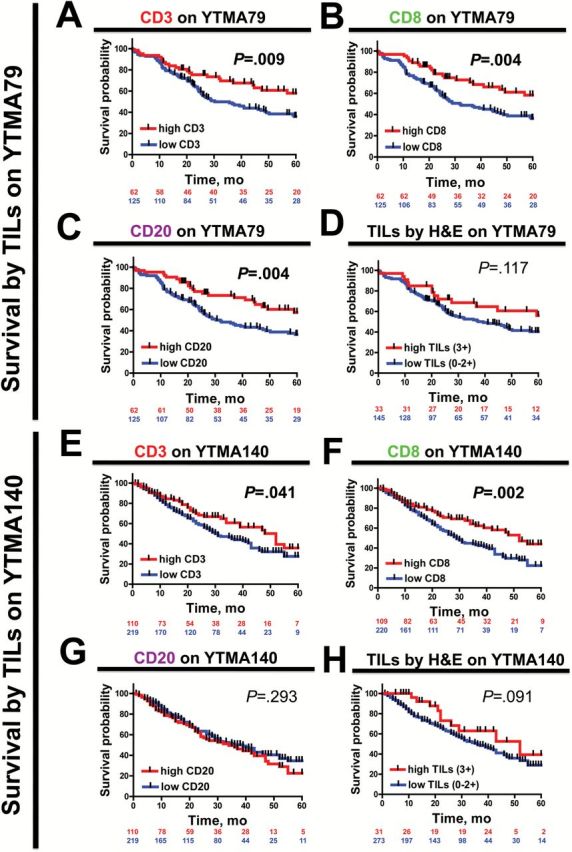
Association between different tumor-infiltrating lymphocyte (TIL) signal and survival in non–small cell lung cancer. A-H) Kaplan-Meier graphical analysis of the overall survival in patients with NSCLC from YTMA79 (A-D) and YTMA140 (E-H) according to CD3 (A and E), CD8 (B and F), CD20 (C and G), or total TILs in hematoxylin and eosin–stained slides (D and H). Case patients with high signal include case patients in the top tertile, and case patients in the low-signal group comprise those in the lower two tertiles (see Methods). The number of patients at risk in each group and the respective log-rank P values are indicated in the chart. All statistical tests were two-sided. H&E = hematoxylin and eosin; TIL = tumor-infiltrating lymphocyte.
In multivariable analysis including age, tumor size, clinical stage, and histology, only earlier stage (eg, stages I&II) and high CD8 signal (but not CD3, CD20, or total TILs by pathology evaluation) were independently associated with longer survival in both YTMA79 and YTMA140 (Table 3). Increased CD3 or CD20 signal was an independent predictor of survival only in YTMA79. The hazard ratios and P values of the univariate Cox analysis for each variable are presented in Supplementary Table 2 (available online).
Table 3.
Multivariable Cox models for survival in YTMA79 and YTMA140*
| Parameter | Risk ratio (95% CI) | P | Risk ratio (95% CI) | P |
|---|---|---|---|---|
| YTMA79 | YTMA140 | |||
| Model 1. CD3 | ||||
| Age, y (>70) | 1.482 (0.816 to 2.653) | .19 | 1.494 (0.979 to 2.222) | .06 |
| Tumor size (>3cm) | 1.291 (0.640 to 2.888) | .57 | 1.499 (0.884 to 2.723) | .14 |
| Smoking (Yes) | 2.113 (0.731 to 8.959) | .18 | 1.063 (0.628 to 1.948) | .83 |
| Stage (III-IV) | 4.891 (2.264 to 10.501) | <.0001 | 2.084 (1.345 to 2.686) | .0003 |
| Histology (ADC) | 0.750 (0.335 to 1.555) | .45 | 0.971 (0.685 to 1.380) | .87 |
| CD3 high | 0.411 (0.192 to 0.821) | .011 | 0.772 (0.521 to 1.117) | .173 |
| Model 2. CD8 | ||||
| Age (>70) | 1.312 (0.724 to 2.329) | .36 | 1.419 (0.927 to 2.117) | .10 |
| Tumor size (>3cm) | 1.211 (0.643 to 2.316) | .55 | 1.479 (0.874 to 2.682) | .15 |
| Smoking (Yes) | 1.822 (0.621 to 7.782) | .30 | 1.098 (0.648 to 2.012) | .74 |
| Stage (III-IV) | 5.520 (2.627 to 11.483) | <.0001 | 2.089 (1.309 to 2.620) | .0005 |
| Histology (ADC) | 0.797 (0.358 to 1.643) | .55 | 0.908 (0.638 to 1.294) | .59 |
| CD8 high | 0.533 (0.280 to 0.968) | .03 | 0.576 (0.385 to 0.842) | .004 |
| Model 3. CD20 | ||||
| Age (>70) | 1.439 (0.798 to 2.540) | .22 | 1.487 (0.974 to 2.212) | .06 |
| Tumor size (>3cm) | 1.288 (0.686 to 2.466) | .43 | 1.517 (0.892 to 2.765) | .13 |
| Smoking (Yes) | 2.098 (0.718 to 8.970) | .19 | 1.044 (0.616 to 1.914) | .88 |
| Stage (III-IV) | 7.062 (3.230 to 15.541) | <.0001 | 2.183 (1.375 to 2.753) | .0002 |
| Histology (ADC) | 0.718 (0.319 to 1.501) | .39 | 0.981 (0.692 to 1.394) | .92 |
| CD20 high | 0.418 (0.222 to 0.754) | .003 | 0.841 (0.602 to 1.193) | .33 |
* All statistical tests were two-sided. ADC = adenocarcinoma; CI = confidence interval.
Discussion
Here we describe a novel method for objective, simultaneous, and compartment-specific measurement of CD3, CD8, and CD20+ TILs that is suitable for conventional FFPE tissue samples. We also show that different TIL subtypes show distinct levels in the tumor and peritumoral stroma and are associated with longer survival in NSCLC. Our findings also indicate that measurement of TILs using this method is more sensitive and provides superior prognostic information than conventional H&E-based pathologist estimation.
Determination of TILs has traditionally been performed in a semiquantitative fashion by using H&E-stained preparations or with single-color IHC. Typically, diverse areas from one slide are evaluated and a trained observer (eg, a pathologist or researcher) renders an integrated categorical estimation of the cells of interest. Also, the examiner estimates the predominance of the cells within certain tissue compartments or structures. For its simplicity and low cost, this approach has been widely used and interesting correlations regarding the biological and clinical role of TILs in diverse tumor types have been established (1). However, this strategy is subjective, variably reproducible, and lacks capacity for detailed simultaneous characterization of cell subtypes. Also, such determinations are limited by the absence of standardized cutoffs and operational landmarks to assess the level of TILs (eg, use of proportion of cells vs absolute number; evaluate the whole sample vs stroma vs tumor only; score the whole slide or only the invasive front, etc.). This has been recognized by an international taskforce led by Dr. Jerome Galon, which proposed the use of a standardized “Immunoscore” using chromogenic IHC for CD3 and CD8 in serial tumor sections coupled to automated quantification in different tumor areas (19,20). However, this method is largely supported by findings in colorectal cancer and not NSCLC, has limited throughput, requires relatively large amounts of tissue and lacks multiple cellular subtyping and compartment-specific capacity. Comparison of this strategy with multiplexed fluorescence will be required to determine the strengths and clinical value of each approach.
Consistent with findings in tumors from different locations and tissue types, increased total TILs has been associated with longer survival in both early-stage and advanced NSCLC (2–4). However, studies measuring single-cell subtypes using IHC have reported conflicting results with one showing association between increased CD8+ cytotoxic T cells (but not of CD4+ cells) and longer survival (5) and others showing the opposite result (6–7). In addition, Hiraoka et al. reported an absence of survival benefit of either elevated CD8+ or CD4+ TILs alone, but a statistically significant (and independent) prognostic effect of combined high stromal CD8+ and CD4+ in 109 NSCLC samples (8). However, these reports include relatively small collections of cases from single institutions and without validation in an independent set. Our findings support the notion that the presence of elevated CD3- and CD8-positive T cells is consistently associated with survival, but only CD8 provides independent prognostic information in NSCLC. CD20 signal showed statistically significant association with survival only in one cohort. This is somewhat consistent with another study evaluating CD4, CD8, and CD20+ cells with chromogenic IHC in 335 NSCLC samples represented in TMAs. The authors found that a high stromal density of each marker was statistically significantly associated with longer survival (21). Also similar to our study, only a high proportion of CD4 and CD8+ cells in this group was independently associated with survival in multivariable analysis. Our results do not include measurements of CD4 because of limited available fluorescence channels.
The limited correlation seen between the markers and in different tumor compartments indicates that the TIL signal is heterogeneous. Nonhomogenous or clustered secretion of cytokines and chemokines known to participate in the recruitment of different TIL subtypes to the tumor microenvironment such as Interferon-γ, CXCL9, CXCL10, and CXCL13 might explain this finding (1,9–10). In particular, our results suggest that CD20+ cells are often located in clusters, leading to a more variable expression pattern that could explain the prognostic effect present only in one of the cohorts. The heterogeneity of TILs seen in our study raises questions regarding the minimal amount of tissue or number of fields/TMA spots required to accurately reflect the tumor-immune contexture. Future studies will be required to determine the minimal tissue sample size for assessment of the TIL markers for clinical purposes.
Our analysis has a number of limitations. One major limitation is that it includes only retrospectively collected cases lacking data on molecular tumor alterations (eg, EGFR, KRAS, ALK, or ROS1). A second issue is that the use of TMAs may underestimate or overestimate the level of TILs because of intratumoral heterogeneity of expression. Clinical assays on actual patient specimens use whole pathology sections (although samples are frequently small). Thus, examination of high numbers of fields of view seen in a histologic section may attenuate the sampling effect of TMAs. Our multiplexing approach is suitable for whole-tissue section samples; it is supported by its use in conventional biopsy slides of human tonsil used as positive control (Figure 1A). Moreover, efforts to characterize TILs in conventional whole-tissue section biopsies from tumor samples have been recently finalized and show comparable results (Brown et al., 2014 [17]). One key unaddressed issue is the potential of TILs, alone or in combination with other markers, to predict response to immunostimulatory therapies such as anti-PD-1/PD-L1 as previously suggested (12,14,22). Future studies measuring TIL subpopulations using QIF in whole-tissue sections specimens from patients treated with such compounds might provide a better substrate to conclusively address the predictive value of these markers.
Funding
This work was supported by the Yale Cancer Center Translational Research Program, the Breast Cancer Research Foundation (to DLR), ASCO young investigator award 2012 (to VV), NIH R01CA155196 (to RSH) and CCSG P30 CA 016359 (to Yale University).
Supplementary Material
The authors acknowledge Lori Charette and the Yale Pathology Tissue Services for production of the high-quality TMAs used in this study. The authors Kurt Schalper, Jason Brown, Vamsidhar Velcheti, Daniel Carvajal-Hausdorf, Joseph McLaughlin, and Roy S. Herbst declared no conflict of interest. David L. Rimm is consultant for Bristol-Myers-Squibb, Amgen, Genoptix and Perkin-Elmer.
References
- 1. Fridman WH, Pagès F, Sautès-Fridman C, et al. The immune contexture in human tumours: impact on clinical outcome. Nat Rev Cancer. 2012;12(4):298–306. [DOI] [PubMed] [Google Scholar]
- 2. Horne ZD, Jack R, Gray ZT, et al. Increased levels of tumor-infiltrating lymphocytes are associated with improved recurrence-free survival in stage 1A non-small-cell lung cancer. J Surg Res. 2011;171(1):1–5. [DOI] [PubMed] [Google Scholar]
- 3. Kilic A, Landreneau RJ, Luketich JD, et al. Density of tumor-infiltrating lymphocytes correlates with disease recurrence and survival in patients with large non-small-cell lung cancer tumors. J Surg Res. 2011;167(2):207–210. [DOI] [PubMed] [Google Scholar]
- 4. Velcheti V, Schalper KA, Carvajal DE, et al. Programmed death ligand-1 expression in non-small cell lung cancer. Lab Invest. 2014;94(1):107–116. [DOI] [PMC free article] [PubMed] [Google Scholar]
- 5. Zhuang X, Xia X, Wang C, et al. A high number of CD8+ T cells infiltrated in NSCLC tissues is associated with a favorable prognosis. Appl Immunohistochem Mol Morphol. 2010;18(1):24–28. [DOI] [PubMed] [Google Scholar]
- 6. Mori M, Ohtani H, Naito Y, et al. Infiltration of CD8+ T cells in non-small cell lung cancer is associated with dedifferentiation of cancer cells, but not with prognosis. Tohoku J Exp Med. 2000;191(2):113–118. [DOI] [PubMed] [Google Scholar]
- 7. Wakabayashi O, Yamazaki K, Oizumi S, et al. CD4+ T cells in cancer stroma, not CD8+ T cells in cancer cell nests, are associated with favorable prognosis in human non-small cell lung cancers. Cancer Sci. 2003;94(11):1003–1009. [DOI] [PMC free article] [PubMed] [Google Scholar]
- 8. Hiraoka K, Miyamoto M, Cho Y, et al. Concurrent infiltration by CD8+ T cells and CD4+ T cells is a favourable prognostic factor in non-small-cell lung carcinoma. Br J Cancer. 2006;94(2):275–280. [DOI] [PMC free article] [PubMed] [Google Scholar]
- 9. Gu-Trantien C, Loi S, Garaud S, et al. CD4⁺ follicular helper T cell infiltration predicts breast cancer survival. J Clin Invest. 2013;123(7):2873–2892. [DOI] [PMC free article] [PubMed] [Google Scholar]
- 10. Di Caro G, Bergomas F, Grizzi F, et al. Occurrence of tertiary lymphoid tissue is associated to T cell infiltration and predicts better prognosis in early stage colorectal cancers. Clin Cancer Res. 2014; In press. [DOI] [PubMed] [Google Scholar]
- 11. Brahmer JR. Harnessing the immune system for the treatment of non-small-cell lung cancer. J Clin Oncol. 2013;31(8):1021–1028. [DOI] [PubMed] [Google Scholar]
- 12. Hamid O, Schmidt H, Nissan A, et al. A prospective phase II trial exploring the association between tumor microenvironment biomarkers and clinical activity of ipilimumab in advanced melanoma. J Transl Med. 2011;9:204. [DOI] [PMC free article] [PubMed] [Google Scholar]
- 13. Pardoll DM. The blockade of immune checkpoints in cancer immunotherapy. Nat Rev Cancer. 2012;12(4):252–264. [DOI] [PMC free article] [PubMed] [Google Scholar]
- 14. Sznol M, Chen L. Antagonist antibodies to PD-1 and B7-H1 (PD-L1) in the treatment of advanced human cancer. Clin Cancer Res. 2013;19(5):1021–1034. [DOI] [PMC free article] [PubMed] [Google Scholar]
- 15. Anagnostou VK, Syrigos KN, Bepler G, et al. Thyroid transcription factor 1 is an independent prognostic factor for patients with stage I lung adenocarcinoma. J Clin Oncol. 2009;27(2):271–278. [DOI] [PubMed] [Google Scholar]
- 16. Camp RL, Chung GG, Rimm DL. Automated subcellular localization and quantification of protein expression in tissue microarrays. Nat Med. 2002;8(11):1323–1327. [DOI] [PubMed] [Google Scholar]
- 17. Brown JR, Wimberly H, Lannin DR, Nixon C, Rimm DL, Bossuyt V. Multiplexed quantitative analysis of CD3, CD8, and CD20 predicts response to neoadjuvant chemotherapy in breast cancer. Clin Cancer Res. 2014;20(23):5995–6005. [DOI] [PMC free article] [PubMed] [Google Scholar]
- 18. Schalper KA, Velcheti V, Carvajal D, et al. In situ Tumor PD-L1 mRNA expression is associated with increased TILs and better outcome in breast carcinomas. Clin Cancer Res. 2014;20(10):2773–2782. [DOI] [PubMed] [Google Scholar]
- 19. Galon J, Pagès F, Marincola FM, et al. Cancer classification using the Immunoscore: a worldwide task force. J Transl Med. 2012;10:205. [DOI] [PMC free article] [PubMed] [Google Scholar]
- 20. Galon J, Mlecnik B, Bindea G, et al. Towards the introduction of the ‘Immunoscore’ in the classification of malignant tumours. J Pathol. 2014;232(2):199–209. [DOI] [PMC free article] [PubMed] [Google Scholar]
- 21. Al-Shibli KI, Donnem T, Al-Saad S, et al. Prognostic effect of epithelial and stromal lymphocyte infiltration in non-small cell lung cancer. Clin Cancer Res. 2008;14(16):5220–5227. [DOI] [PubMed] [Google Scholar]
- 22. Tumeh PC, Harview CL, Yearley JH, et al. PD-1 blockade induces responses by inhibiting adaptive immune resistance. Nature. 2014;515(7528):568–571. [DOI] [PMC free article] [PubMed] [Google Scholar]
Associated Data
This section collects any data citations, data availability statements, or supplementary materials included in this article.