

Abstract
Background:
Metformin may improve metabolic factors (insulin, glucose, leptin, highly sensitive C-reactive protein [hs-CRP]) associated with poor breast cancer outcomes. The NCIC Clinical Trials Group (NCIC CTG) MA.32 investigates effects of metformin vs placebo on invasive disease-free survival and other outcomes in early breast cancer. Maintaining blinding of investigators to outcomes, we conducted a planned, Data Safety Monitoring Committee–approved, analysis of the effect of metformin vs placebo on weight and metabolic factors at six months, including examination of interactions with baseline body mass index (BMI) and insulin, in the first 492 patients with paired blood samples.
Methods:
Eligible nondiabetic subjects with T1-3, N0-3, M0 breast cancer who had completed surgery and (neo)adjuvant chemotherapy (if given) provided fasting plasma samples at random assignment and at six months. Glucose was measured locally; blood was aliquoted, frozen, and stored at -80°C. Paired plasma aliquots were analyzed for insulin, hs-CRP, and leptin. Spearman correlation coefficients were calculated and comparisons analyzed using Wilcoxon signed rank test. All statistical tests were two-sided.
Results:
Mean age was 52.1±9.5 years in the metformin group and 52.6 ± 9.8 years in the placebo group. Arms were balanced for estrogen/progesterone receptor, BMI, prior (neo)adjuvant chemotherapy, and stage. At six months, decreases in weight and blood variables were statistically significantly greater in the metformin arm (vs placebo) in univariate analyses: weight -3.0%, glucose -3.8%, insulin -11.1%, homeostasis model assessment -17.1%, leptin -20.2%, hs-CRP -6.7%; all P values were less than or equal to .03. There was no statistically significant interaction of change in these variables with baseline BMI or insulin.
Conclusions:
Metformin statistically significantly improved weight, insulin, glucose, leptin, and CRP at six months. Effects did not vary by baseline BMI or fasting insulin.
Obesity has been associated with poor breast cancer outcomes, independent of menopausal status, in women with both hormone receptor–positive and –negative breast cancer (1). Members of our group identified insulin as a potential mediator of this adverse prognostic effect in nondiabetic women; those with fasting insulin levels in the upper vs lower quartile having a doubled risk of distant recurrence and a tripled risk of death (2,3). This finding has been replicated by other groups (4–7). These observations have raised interest in interventions, lifestyle or pharmacologic, that target insulin and related metabolic factors as a means of improving breast cancer outcomes. Metformin, a widely available generic biguanide used in the treatment of Type II diabetes, promotes modest weight loss, lowers insulin levels, and improves insulin resistance in nondiabetic populations, including breast cancer survivors (8). Recent evidence from neoadjuvant window-of-opportunity studies suggests it may exert beneficial effects on markers of proliferation and apoptosis in women with early breast cancer (9–11).
Together, these observations led to the NCIC Clinical Trials Group (NCIC CTG) MA.32, a randomized, placebo-controlled adjuvant trial investigating the effect of metformin vs placebo on invasive cancer-free survival and other outcomes, including weight and metabolic factors, in early breast cancer. In the context of this trial, we conducted a planned, Data Safety Monitoring Committee (DSMC)–approved investigation of the effects of metformin vs placebo on body weight and key metabolic factors (insulin, homeostasis model assessment [HOMA], leptin, highly sensitive C-reactive protein [hs-CRP]) using paired blood specimens (baseline and six months). We also explored whether metabolic effects of metformin differed according to level of obesity or insulin resistance.
Methods
Study Design
The NCIC CTG MA.32 Clinical Trial (Clinical Trials.gov identifier: NCT01101438; http://clinicaltrials.gov/show/NCT01101438) is a phase III randomized trial being conducted in North America, the United Kingdom, and Switzerland that has completed enrollment of 3649 nondiabetic women receiving standard surgical, chemotherapeutic, hormonal, biologic, and radiation treatment for T1-3, N0-3, M0 breast cancer diagnosed during the previous year. Chemotherapy, if given, was completed at least one month prior to enrollment. Women with T1c N0 breast cancer were eligible if they had at least one of: histologic grade III (locally determined, classification system not specified by the protocol), lymphovascular invasion, negative estrogen (ER) and progesterone (PgR) receptors, HER2 positivity, Oncotype Recurrence Score greater than or equal to 25 or Ki-67 over 14%. In May 2012, after 2382 women were enrolled, the eligibility criteria were amended to mandate triple-negative (ER-, PR-, HER2-negative) status for patients with T1cN0 disease and at least one adverse tumor characteristic as listed above for patients with T2N0 tumors. Participants were required to have a fasting glucose of less than or equal to 7.0 mmol/L. Those with diabetes, history of lactic acidosis, current use of diabetes medication, recurrence of breast cancer or previous breast cancer, excessive alcohol intake, or marked hepatic, kidney, or cardiac dysfunction were excluded.
Eligible subjects were randomly assigned to receive a metformin 850mg caplet po bid or an identical placebo caplet po bid for five years, including a four-week ramp up of one caplet per day in each arm. Participating subjects were required to provide a fasting blood specimen (plasma, serum, whole blood) at random assignment prior to initiating drug treatment and at six months (includes four-week ramp up of one caplet per day plus 20 weeks of full dose) and five years. Height and weight were measured at study centers at baseline and weight at six months. The primary outcome is invasive disease-free survival; additional cancer and non–cancer related outcomes were also specified.
The study protocol was approved by the institutional review board of the participating institutions. All patients provided written informed consent to participate, including conduct of the correlative analyses reported here. The correlative analyses were conducted once paired (baseline, six months) blood samples were available on approximately 500 subjects. This number was chosen arbitrarily to allow evaluation of metabolic effects that could lead to modification of study design, if needed, prior to full accrual.
Metabolic Substudy
The first 492 participants for whom fasting bloods (collected fasting at baseline and on study medication six months later) were available at NCIC CTG were included (Figure 1). A 1mL aliquot of plasma, frozen within 30 minutes at -80°C at the local center, was transported on dry ice to the central repository at NCIC CTG in Kingston, Canada and retransported on dry ice to Mount Sinai Hospital in Toronto. Paired bloods (baseline, six months from a given subject) were assayed (blinded to treatment allocation) in batches for insulin (Roche ECLIA, catalogue #12017547122), leptin (Luminex Milliplex MAP catalogue #HADCYMAG-61K), and hs-CRP (Roche, particle based immunoturbidimetric assay catalogue #11972855216). Assays were performed in eight batches. Single assays were performed on all samples with an additional 10% random repeats. Intra-assays coefficients of variability were 3%, 3%, and 4.2%, respectively. Inter-assay coefficients of variability were 6%, 4%, and 3.8%, respectively. Glucose was analyzed at local laboratories immediately after collection. HOMA (a marker of insulin resistance that correlates well with the Gold Standard Frequently Sampled Intravenous Glucose Tolerance test) was calculated from glucose and insulin in a subset of 331 subjects on whom both were measured on the same day (glucose [mg/dl] x insulin [pmol/L] /22.5) (12).
Figure 1.

Consolidated Standards of Reporting Trials diagram for metabolic substudy: MA.32. HOMA = homeostasis model assessment.
Statistical Analysis
Statistical analyses were conducted at NCIC CTG by Dr. Bingshu Chen using SAS version 9.2. Log transformations were used for skewed baseline and six month variables (weight, BMI, blood factors); summary statistics for these variables are presented as median, interquartile change (IQR). Correlations were calculated using Spearman ranked sum correlation coefficients. The statistical significance of differences between groups for baseline and month six measurements and for changes between baseline and month six (defined as median of [month 6 value – baseline value]/baseline value) were tested using the Wilcoxon rank sum test.
Multivariable analyses of log-transformed changes (calculated by subtracting log-transformed baseline values from log-transformed month six values) included treatment variables (lumpectomy vs mastectomy, radiation yes vs no, adjuvant chemotherapy yes vs no, adjuvant trastuzumab yes vs no, adjuvant hormone therapy yes vs no) and correlations within trial sites. Interactions between treatment arm and baseline BMI and insulin were examined via regression analysis.
A P value of less than .05 was considered statistically significant, and all tests were two-sided.
Results
Population
Baseline characteristics of the study population are shown in Table 1. Mean age was 52.1±9.5 years and 52.6±9.8 years in the metformin and placebo arms, respectively. This is comparable to the whole patient population (data not shown). Neoadjuvant therapy was administered in 31 of 237 (12.7%) in the metformin arm and 27 of 255 (22.4%) in the placebo arm. Combining clinical stage (in patients receiving neoadjuvant therapy) and pathologic stage (in those not receiving neoadjuvant therapy), the majority of patients had T2 or T3 breast cancer (132 T2 and 28 T3 of 237 in the metformin arm, 137 T2 and 30 T3 of 255 in the placebo arm), with involved axillary nodes (in 56.5% and 51.4% in the metformin and placebo arms, respectively). Estrogen and/or progesterone receptors were positive in 73.0% and 72.2%, and HER2 was positive in 17.3% and 14.4% of cases in the metformin and placebo arms, respectively. Just under half the subjects in each arm had undergone mastectomy (49.4% and 41.6% metformin and placebo arms, respectively); the majority received adjuvant chemotherapy (210/237 = 88.6% and 224/255 = 87.8% in metformin and placebo arms, respectively). Adjuvant hormone therapy was received by 66.5% (65.0% in the metformin arm and 67.8% in the placebo arm). Herceptin was administered to 40 of 41 (97.6%) of subjects with HER2-positive breast cancer in the metformin arm and 33 of 36 (91.7%) of subjects with HER2-positive breast cancer in the placebo arm.
Table 1.
Baseline characteristics of the metabolic substudy population*
| Characteristic | Metformin No. (%) (n = 237) |
Placebo No. (%) (n = 255) |
|---|---|---|
| Age (mean ± SD), y | 52.1±9.5 | 52.6 ±-9.8 |
| Race | ||
| Asian | 4 (1.7) | 6 (2.4) |
| Black | 2 (0.8) | 3 (1.2) |
| Native | 3 (1.2) | 3 (1.2) |
| White | 227 (95.8) | 239 (93.7) |
| Unknown | 1 (0.4) | 4 (1.6) |
| T stage (neoadjuvant) | ||
| cT1 | 3 (9.6) | 1 (3.7) |
| cT2 | 18 (58.1) | 13 (48.1) |
| cT3 | 10 (32.3) | 13 (48.1) |
| N stage (neoadjuvant) | ||
| cN0 | 6 (19.4) | 8 (29.6) |
| cN1-3 | 25 (80.6) | 19 (70.4) |
| T stage (adjuvant) | ||
| T1 | 74 (36.0) | 87 (38.2) |
| T2 | 114 (55.3) | 124 (54.4) |
| T3 | 18 (8.7) | 17 (7.4) |
| N stage (adjuvant) | ||
| N0 | 97 (47.1) | 116 (50.9) |
| N1-3 | 109 (52.9) | 112 (49.1) |
| Hormone receptor | ||
| ER- and/or PgR-positive | 173 (73.0) | 184 (72.2) |
| ER- and PgR-negative | 64 (27.0) | 71 (27.8) |
| HER2 | ||
| Positive | 41 (17.3) | 36 (14.4) |
| Negative | 196 (82.7) | 219 (85.9) |
| Surgery | ||
| Mastectomy | 117 (49.4) | 106 (41.6) |
| Lumpectomy | 120 (50.6) | 149 (58.4) |
| Adjuvant chemotherapy | ||
| Yes – neoadjuvant | 31 (13.1) | 27 (10.6) |
| Yes – postoperative | 179 (75.5) | 197 (77.3) |
| No | 27 (11.4) | 31 (12.1) |
| Adjuvant hormone therapy | ||
| Yes – neoadjuvant | 3 (1.3) | 0 (0) |
| Yes – postoperative | 151 (63.7) | 173 (67.8) |
| No | 83 (35.0) | 82 (32.2) |
| Adjuvant trastuzumab | ||
| Yes | 40 (16.9) | 33 (12.9) |
| No | 197 (83.1) | 222 (87.1) |
* ER = estrogen receptor; PgR = progesterone receptor.
Baseline Measurements
Baseline weight and metabolic measurements are shown in Table 2. Median BMI was 27.4 (IQR = 24.3–31.4) vs 27.3 (IQR = 24.1–32.0) kg/m2 in the metformin and placebo arms, respectively. The majority of subjects in each arm was overweight or obese (BMI = 25–30kg/m2 in 80 [33.8%] metformin and 77 [30.2%] placebo subjects and BMI ≥ 30kg/m2 in 86 [36.3%] metformin and 88 [36.5%] placebo subjects). HOMA was calculated on the subset of 331 subjects who had blood drawn for insulin and glucose assays on the same day; the median HOMA was 1.78 (IQR = 1.11–2.52) in the metformin arm and 1.68 (IQR = 1.16–2.76) in the placebo arm. These medians were below the cut point of 2.7, often associated with insulin resistance. These baseline characteristics did not differ statistically significantly between study arms.
Table 2.
Baseline weight and fasting metabolic variables (median, IQR)
| Baseline variable | Metformin median (IQR) (n = 237) | Placebo median (IQR) (n = 255) | P |
|---|---|---|---|
| Weight, kg* | 74.1 (65.4–83.6) | 72.3 (63.0–82.1) | .82 |
| BMI, kg/m2* | 27.4 (24.3–31.4) | 27.3 (24.1–32.0) | .83 |
| Glucose, mmol/L* | 5.3 (4.9–5.6) | 5.2 (4.9–5.6) | .31 |
| Insulin, pmol/L | 54.0 (37.0–81.0) | 53.0 (36.0–81.0) | .69 |
| HOMA† (n = 331) | 1.78 (1.11–2.52) | 1.68 (1.16–2.76) | .95 |
| Leptin, ng/mL | 12.7 (6.9–20.1) | 12.2 (6.5–22.5) | .90 |
| hs-CRP, µg/L | 1.4 (0.6–3.3) | 1.5 (0.6–3.2) | .74 |
* Measured at local center. P values (two-sided) were calculated using the Wilcoxon rank sum test. HOMA = homeostasis model assessment; hs-CRP = highly sensitive C-reactive protein; IQR = interquartile range.
† Calculated from glucose and insulin, with blood draws for both on the same date (Metformin n = 154, Placebo n = 177).
Baseline weight and fasting blood variables were all positively correlated with baseline BMI (Spearman r = 0.93 [95% confidence interval {CI} = 0.91 to 0.94] weight, 0.54 [95% CI = 0.48 to 0.60] insulin, 0.72 [95% CI = 0.68 to 0.76] leptin, 0.25 [95% CI = 0.17 to 0.33] glucose, 0.51 [95% CI = 0.44 to 0.57] hs-CRP, all P < .001). Similar positive correlations of BMI and blood variables were identified with baseline fasting insulin (Spearman r = 0.54 [95% CI = 0.48 to 0.60] BMI, 0.56 [95% CI=0.50 to 0.62] leptin, 0.37 [95% CI = 0.30 to 0.45] glucose, 0.42 [95% CI = 0.35 to 0.49] hs-CRP, all P < .001). Scatterplots of these associations are shown in Figure 2.
Figure 2.
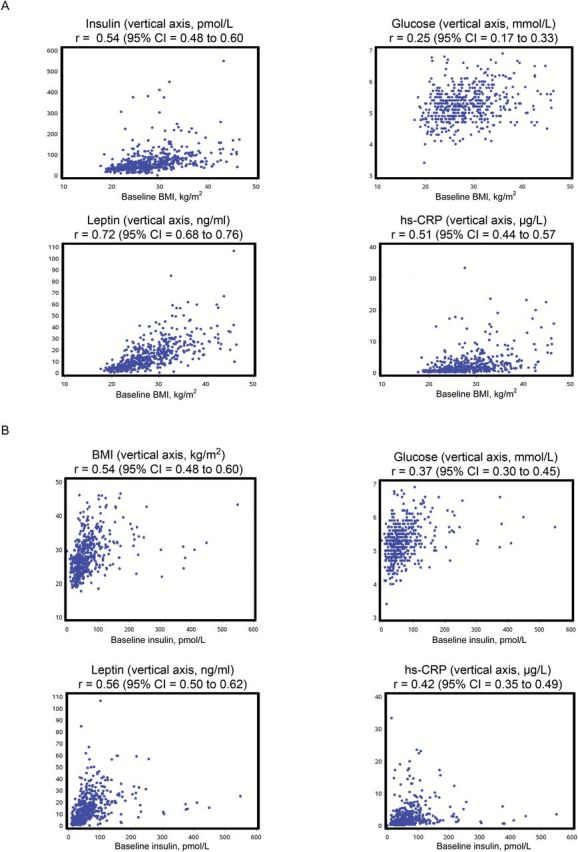
Correlation of baseline body mass index (BMI) and insulin with baseline metabolic parameters. Scatterplots of (A) baseline BMI with baseline fasting insulin, glucose, leptin, and hs-CRP and (B) baseline insulin with baseline BMI, fasting glucose, leptin, and hs-CRP (“r” = Spearman correlation coefficient, 95% confidence intervals for r are based on Fisher’s Z transformation). All correlation coefficients statistically significantly different from zero (calculated using Fisher’s z-transformation method) (P < .01). BMI = body mass index; CI = confidence interval; hs-CRP = highly sensitive C-reactive protein.
Change at Six Months
Changes in weight, BMI, and blood variables between baseline and six months in those receiving metformin and placebo are shown in Table 3. There were reductions in weight, BMI, glucose, insulin, HOMA, and leptin (except hsCRP, which remained stable) in the metformin arm and increases in all these variables (except insulin, which remained stable) in the placebo arm. Weight decreased 1.7kg (2.3%) in metformin patients and increased 0.5kg (0.7%) in placebo patients (net difference -3.0%). Insulin decreased 11.1% in metformin patients and was stable in placebo patients (net difference -11.1%); glucose decreased 1.9% in metformin patients and increased 1.9% in placebo patients (net difference – 3.8%), while HOMA decreased 11.2% in metformin patients and increased 5.9% in placebo patients (net difference -17.1%). Leptin decreased 9.5% in the metformin patients and increased 10.7% in placebo patients (net difference -20.2%). hs-CRP was stable in metformin patients and increased 6.7% in placebo patients (net difference -6.7%). Improvements in all these variables were statistically significantly greater in the metformin vs placebo arm in univariate analyses (all P ≤ .03). Results were similar in multivariable analyses, all P values were less than or equal to .002 (Table 3). Importantly, there were no statistically significant interactions of baseline BMI (all P interaction ≥ .20) or baseline fasting insulin (all P interaction ≥ .17) with the observed change in any of these variables in the metformin vs placebo arms. Scatterplots of the association of these changes with baseline BMI and insulin are shown in Figure 3; Spearman rank correlation coefficients ranged from -0.06 (baseline insulin with glucose change) to 0.14 (baseline BMI with glucose change), all statistically nonsignificant (all P ≥ .05). There was no evidence that metformin use was associated with underweight (BMI < 18.5kg/m2) or low insulin levels at month six (footnote to Table 3). No symptomatic episodes of hypoglycemia were reported in either arm.
Table 3.
Change from baseline at six months
| Measurement | Metformin (n = 237) | Placebo (n = 255) | Metformin vs placebo | Interaction P values | ||||
|---|---|---|---|---|---|---|---|---|
| Change* median (IQR) | %† | Change median (IQR) | % | P | Change and baseline BMI | Change and baseline fasting insulin | ||
| Univariate* | Multivariable‡ | |||||||
| Weight, kg§ | -1.7 (0--3.7) | -2.3 | +0.5 (-1.2–2.3) | +0.7 | <.001 | <.001 | .32 | .17 |
| BMI, kg/m2* | -0.7 (-1.4-0.0) | -2.6 | +0.2 (-0.5–0.8) | +0.7 | <.001 | <.001 | .27 | .19 |
| Glucose, mmol/L§ | -0.1 (-0.4-0.2) | -1.9 | +0.1 (-0.2–0.4) | +1.9 | <.001 | .002 | .97 | .17 |
| Insulin, pmol/L‖ | -6.0 (-18.0-11.0) | -11.1 | 0.0 (-14.0–15.0) | 0 | .03 | .002 | .79 | .84 |
| HOMA¶ (n = 331) | -0.2 (-0.6-0.3) | -11.2 | +0.1 (-0.4–0.5) | +5.9 | .01 | <.001 | .72 | .89 |
| Leptin, ng/mL | -1.2 (-4.7-1.6) | -9.5 | +1.3 (-2.2–4.7) | +10.7 | <.001 | <.001 | .20 | .27 |
| hs-CRP, µg/L | 0.0 (-0.7-0.3) | 0 | +0.1 (-0.3–0.7) | +6.7 | .005 | .002 | .67 | .59 |
* Change is defined as (month six value – baseline value). Median and IQR are reported; univariate P values (two-sided) were calculated using the Wilcoxon rank sum test.
† % change is defined as median of change / median of baseline value.
‡ Adjusted for surgery (mastectomy vs lumpectomy), radiation (yes vs no), chemotherapy (yes vs no), trastuzumab (yes vs no), hormone therapy (yes vs no), with adjustment for correlation within trial site using robust variance estimate. Multivariable P values (two-sided) were calculated using the Wald test.
§ Measured at local center. On the metformin arm 2 of 237 and 3 of 237 had BMIs under 18.5kg/m2 (considered underweight) at baseline and six months, respectively. No patient on the placebo arm had a BMI under 18.5 kg/m2 at either time. BMI = body mass index; HOMA = homeostasis model assessment; hs-CRP = highly sensitive C-reactive protein; IQR = interquartile range.
║ On the metformin arm 13 of 237 and 20 of 237 had insulin below the lower limit of normal (21 pmol/L) at baseline and six months, respectively. Comparable figures on the control arm were 17 of 255 and 15 of 255, respectively.
¶ Calculated from glucose and insulin, with blood draws for both on the same date.
Figure 3.
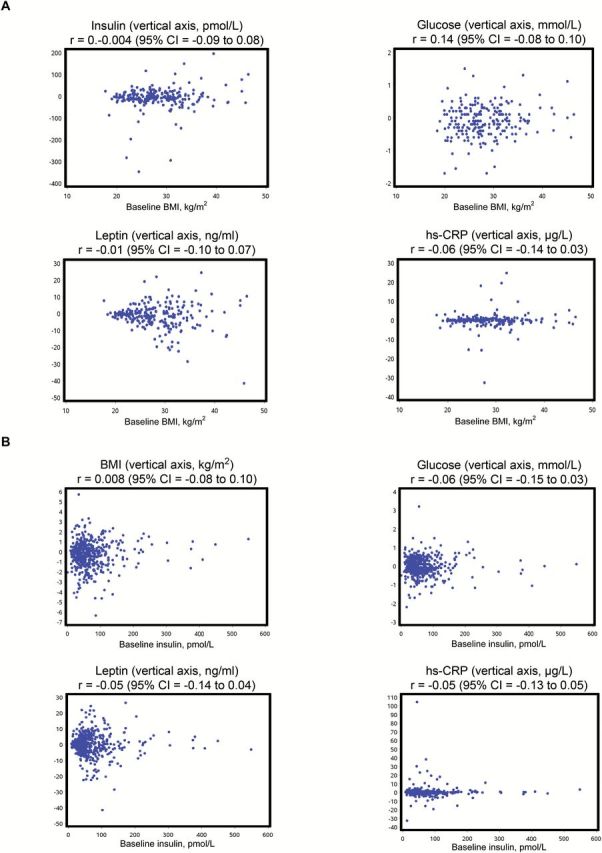
Correlation of baseline body mass index (BMI) and insulin with change in metabolic parameters. Scatterplots of baseline BMI and fasting insulin with change (at six months) in BMI and fasting insulin, glucose, leptin, and hs-CRP. A) Associations with baseline BMI. B) Associations with baseline fasting insulin (“r” = Spearman correlation coefficient, 95% confidence intervals for r are based on Fisher’s z-transformation). No correlation coefficients were statistically significantly different from zero (calculated using Fisher’s z-transformation method). BMI = body mass index; CI = confidence interval; hs-CRP = highly sensitive C-reactive protein.
Discussion
Consistent with prior reports of beneficial effects of metformin on metabolic factors, predominantly in noncancer populations without diabetes (13), we identified improvements in weight, BMI, and metabolic variables in breast cancer patients on MA.32 who received metformin. Importantly from a safety perspective, we found no evidence of an adverse effect of metformin on weight or any of the metabolic factors we studied.
One of the mechanisms by which metformin has been postulated to exert anticancer effects is an indirect one, through an impact on host metabolism, notably via a reduction in circulating insulin levels (14). Our results provide evidence that host metabolism is, indeed, improved when metformin is administered to nondiabetic breast cancer patients. Our observation that improvements extend beyond insulin, glucose, and HOMA to include leptin and hs CRP reflect broader metabolic effects of metformin that may be relevant to breast cancer. For example, higher levels of leptin have been associated with poor breast cancer outcome (3,15); there is evidence that leptin may act biologically in breast cancer, binding to its own OB2 receptor, to activate STAT signaling pathways; it can also activate PI3K signaling pathways and Ras-Raf-MEK signaling pathways (16). Moreover, leptin may enhance estrogen signaling through increased aromatization, or via cross-talk with ER signaling pathways (16). The important relative reductions seen in hs-CRP, a marker of chronic inflammation, may reflect anti-inflammatory effects that may counter a potential adverse effect of inflammation on breast cancer outcomes (16). We plan to explore these factors as prognostic (overall, and in metformin vs placebo arms separately) and predictive factors (for metformin benefit) in the full MA.32 population.
The absence of an interaction of change in our study variables with baseline BMI or baseline fasting insulin is reassuring, as it suggests that beneficial metabolic benefits of metformin are present regardless of initial body size or level of insulin resistance. This addresses a concern raised in one of a group of smaller neoadjuvant window-of-opportunity studies using metformin in the preoperative setting (9–11). These studies provide evidence that metformin leads to reductions in Ki-67 (a marker of proliferation) and increases in TUNEL (a marker of apoptosis) and that these changes can be associated with reductions in weight, insulin, and leptin (11). However, in one of these studies (10), Bonanni et al. identified no overall effects of metformin on Ki-67 or metabolic factors. They found evidence of a statistically significant qualitative interaction of metformin effect on Ki67 with baseline HOMA but not BMI. Reductions in Ki67 were seen when BMI was greater than or equal to 27kg/m2 or HOMA was greater than or equal to 2.7 (considered a cutpoint for insulin resistance by the authors), whereas potentially concerning increases were seen in the remaining women. Design differences may be responsible for the differing results. A key difference is that metformin (with a relatively short half-life of 18 hours) was discontinued early in the Bonanni study (two to three days prior to measurement of metabolic factors), and it is quite possible that effects of metformin had dissipated in many women by the time postmetformin blood samples were drawn. In contrast, subjects in our study continued to take metformin at the time of follow-up measurements. We plan to investigate these issues more comprehensively in the full MA.32 dataset.
The baseline insulin levels we observed (median = 54.0 pmol/L, IQR = 37.0–81.0) were in the range of normal for nondiabetic women (21–118 pmol/L). They are somewhat higher than those observed in our earlier prognostic study (mean = 44.6 pmol/L) (2) and our neoadjuvant metformin study (mean = 43.4 pmol/L) (11). This likely reflects two major factors: 1) BMI (which is correlated with insulin, r = 0.54 in this study) was higher here (mean = 28.8kg/m2) than in our other studies (25.5 and 26.9kg/m2, respectively); and (2) BMI and insulin were measured after systemic adjuvant chemotherapy in 90% of subjects here (v 0% in our earlier studies).
Some of the changes we identified, notably in fasting insulin and glucose, were smaller than previously reported in other studies (8,13). In an earlier study of breast cancer survivors with baseline insulin greater than or equal to 44 pmol/L who received a lower dose of metformin (500mg tid) for six months, we identified a 22.4% reduction in insulin (8); these values contrast with reductions of 11.1% in the metformin arm in this MA.32 substudy. The 11.1% change we observed in insulin is more consistent with the 10.9% reduction seen in our neoadjuvant study (11) and the 14.4% reduction reported in a meta-analysis of metformin treatment in persons at risk for diabetes (13). In contrast, reductions in weight (1.9kg in the earlier study [8] and 1.7kg in MA.32) and in leptin (10.1% in the earlier study [8] and 9.5% in MA.32) were reassuringly similar in the two studies. The selection of women with baseline insulin of greater than or equal to 44 pmol/L in our initial study and the high dependence of insulin on fasting status may have contributed to the variability in insulin reduction we have observed across studies. It is possible that there was more variability in the fasting status of women in the multicenter MA.32 than in our earlier study, where a 12-hour overnight fast was strictly enforced. In MA.32, the protocol defined fasting a “after an overnight fast of at least 12 hours;” however, the fasting time period was not collected on the case report forms. As a result, we cannot explore this potential variability. Furthermore, although all patients in this MA.32 substudy were reported to take study medications as prescribed (two caplets daily) when their six month blood sample was drawn and cross-over from placebo to metformin was not permitted, it is possible that compliance with the full dose of study medication was lower than in our earlier study. These patterns will be further explored in the full study population, and when additional fasting blood samples become available after five years of treatment.
Our study is not without limitations. Although our findings were independent of other cancer treatment in our multivariable analyses and use of metformin vs placebo was randomly allocated, it is possible unknown confounders may have contributed to our findings in these initial analyses. We plan to reexamine these effects in the full study population once data are available on all patients.
Metformin has also been proposed to exert direct antitumor effects, independent of host metabolic factors, through a number of mechanisms, most of which require the presence of organic cation transporters (OCTs) on the surface of tumor cells for direct uptake of metformin (17). Inhibition of the respiratory chain in the mitochondria leading to LKB1-mediated AMPK activation with subsequent downstream mTOR inhibition has been proposed as the most likely direct mechanism of metformin; other non-AMPK mediated effects may also occur (18–20). In parallel to investigation of metabolic effects of metformin, we plan to explore these potential direct mechanisms in the full MA.32 population. This work will use, tumor tissue obtained at diagnosis to identify whether tumor characteristics predict any beneficial effects of metformin on breast cancer outcomes that are identified in the parent trial.
In conclusion, we have demonstrated beneficial effects of metformin on body weight and several metabolic factors associated with insulin resistance in initial patients enrolled onto NCIC CTG MA.32. Our observations provide no evidence that these effects are dependent on baseline BMI or insulin. They support the continuation of this study to determine effects of metformin on cancer outcomes and on noncancer outcomes, including cardiovascular disease and diabetes. They provide clear evidence that metformin improves the metabolic profile of nondiabetic breast cancer patients, regardless of initial weight or degree of insulin resistance; this information can help guide the design of metformin trials in breast and other cancer populations, in which insulin and related metabolic factors have been hypothesized to influence cancer outcomes.
Funding
This work was supported by the Canadian Cancer Society Research Institute (#021039), the National Cancer Institute (US) (#CA077202), the Breast Cancer Research Foundation (New York), Canadian Breast Cancer Foundation – Ontario Region (Ontario Institute for Cancer Research) (#10NOV-467), and Apotex Canada (in kind donation of placebo and metformin).
The study sponsors had no role in the design of the study, the collection, analysis, or interpretation of the data, the writing of the manuscript, nor the decision to submit the manuscript for publication.
References
- 1. Protani M, Coory M, Martin JH. Effect of obesity on survival of women with breast cancer: systematic review and meta-analysis. Breast Cancer Res Treat. 2010;123(3):627–635. [DOI] [PubMed] [Google Scholar]
- 2. Goodwin PJ, Ennis M, Pritchard KI, et al. Fasting insulin and outcome in early-stage breast cancer: results of a prospective cohort study. J Clin Oncol. 2002;20(1):42–51. [DOI] [PubMed] [Google Scholar]
- 3. Goodwin PJ, Ennis M, Pritchard KI, et al. Insulin- and obesity-related variables in early-stage breast cancer: correlations and time course of prognostic associations. J Clin Oncol. 2012;30(2):164–171. [DOI] [PubMed] [Google Scholar]
- 4. Pasanisi P, Berrino F, De PM, Venturelli E, Mastroianni A, Panico S. Metabolic syndrome as a prognostic factor for breast cancer recurrences. Int J Cancer. 2006;119(1):236–238. [DOI] [PubMed] [Google Scholar]
- 5. Duggan C, Irwin ML, Xiao L, et al. Associations of insulin resistance and adiponectin with mortality in women with breast cancer. J Clin Oncol 2011;29(1):32–39. [DOI] [PMC free article] [PubMed] [Google Scholar]
- 6. Emaus A, Veierod MB, Tretli S, et al. Metabolic profile, physical activity, and mortality in breast cancer patients. Breast Cancer Res Treat. 2010;121(3):651–660. [DOI] [PubMed] [Google Scholar]
- 7. Pritchard KI, Shepherd LE, Chapman JA, et al. Randomized trial of tamoxifen versus combined tamoxifen and octreotide LAR Therapy in the adjuvant treatment of early-stage breast cancer in postmenopausal women: NCIC CTG MA.14. J Clin Oncol. 2011;29(29):3869–3876. [DOI] [PubMed] [Google Scholar]
- 8. Goodwin PJ, Pritchard KI, Ennis M, Clemons M, Graham M, Fantus IG. Insulin-lowering effects of metformin in women with early breast cancer. Clin Breast Cancer. 2008;8(6):501–505. [DOI] [PubMed] [Google Scholar]
- 9. Hadad S, Iwamoto T, Jordan L, et al. Evidence for biological effects of metformin in operable breast cancer: a pre-operative, window-of-opportunity, randomized trial. Breast Cancer Res Treat. 2011;128(3):783–794. [DOI] [PubMed] [Google Scholar]
- 10. Bonanni B, Puntoni M, Cazzaniga M, et al. Dual effect of metformin on breast cancer proliferation in a randomized presurgical trial. J Clin Oncol. 2012;30(21):2593–2600. [DOI] [PubMed] [Google Scholar]
- 11. Niraula S, Dowling RJ, Ennis M, et al. Metformin in early breast cancer: a prospective window of opportunity neoadjuvant study. Breast Cancer Res Treat. 2012;135(3):821–830. [DOI] [PubMed] [Google Scholar]
- 12. Bonora E, Targher G, Alberiche M, et al. Homeostasis model assessment closely mirrors the glucose clamp technique in the assessment of insulin sensitivity: studies in subjects with various degrees of glucose tolerance and insulin sensitivity. Diabetes Care. 2000;23(1):57–63. [DOI] [PubMed] [Google Scholar]
- 13. Salpeter SR, Buckley NS, Kahn JA, Salpeter EE. Meta-analysis: metformin treatment in persons at risk for diabetes mellitus. Am J Med. 2008;121(2):149–157. [DOI] [PubMed] [Google Scholar]
- 14. Dowling RJ, Niraula S, Stambolic V, Goodwin PJ. Metformin in cancer: translational challenges. J Mol Endocrinol. 2012;48(3):R31–R43. [DOI] [PubMed] [Google Scholar]
- 15. Goodwin PJ, Ennis M, Fantus IG, et al. Is leptin a mediator of adverse prognostic effects of obesity in breast cancer? J Clin Oncol. 2005;23(25):6037–6042. [DOI] [PubMed] [Google Scholar]
- 16. Khandekar MJ, Cohen P, Spiegelman BM. Molecular mechanisms of cancer development in obesity. Nat Rev Cancer. 2011;11(12):886–895. [DOI] [PubMed] [Google Scholar]
- 17. Shu Y, Brown C, Castro BA, et al. Effect of genetic variation in the organic cation transporter 1, OCT1, on metformin pharmacokinetics. Clin Pharm Therapeut. 2008;83(2):273–280. [DOI] [PMC free article] [PubMed] [Google Scholar]
- 18. Kahn BB, Alquier T, Carling D, Hardie DG. AMP-activated protein kinase: ancient energy gauge provides clues to modern understanding of metabolism. Cell Metabolism. 2005;1(1):15–25. [DOI] [PubMed] [Google Scholar]
- 19. Zhou G, Myers R, Li Y, et al. Role of AMP-activated protein kinase in mechanism of metformin action. J Clin Invest. 2001;108(8):1167–1174. [DOI] [PMC free article] [PubMed] [Google Scholar]
- 20. El-Mir MY, Nogueira V, Fontaine E, Avéret N, Rigoulet M, Leverve X. Dimethylbiguanide inhibits cell respiration via an indirect effect targeted on the respiratory chain complex 1. J Biol Chem. 2000;275(1):223–228. [DOI] [PubMed] [Google Scholar]