

Abstract
Electrochemical Impedance Spectroscopy (EIS) was used to study the behavior of MC3T3-E1cells cultured in αMEM+FBS solution on two Ti-based alloys (Ti-6Al-4V and γTiAl) during 4, 7 and 14 days. EIS measurements were carried out at the open-circuit potential in the 1 mHz to 100 kHz frequency range. Results indicate a general increase in impedance on the Ti alloy surfaces with cells as a function of time. Bode plots indicate changes corresponding to the passive oxide film, adsorption of proteins and cell tissue on surfaces with the passage of time. Normal cellular activity based on the polygonal morphology, with long and fine cytoplasmic prolongations of the cells on Ti-6Al-4V and γTiAl was observed from SEM images. Similarly, mineralization nodules corresponding to cell differentiation associated with the osseogenetic process were observed confirmed by Alizarin Red S staining. Immunofluorescence analysis to detect the presence of collagen Type I showed an increase in the segregation of collagen as a function of time. The impedance values obtained from EIS testing are indicative of the corrosion protection offered to the Ti alloy substrates by the cell layer. This study shows that γTiAl has better corrosion resistance than Ti-6Al-4V in the αMEM+FBS environment in the presence of MC3T3-E1 cells.
Keywords: Electrochemical characterization, MC3T3-E1 cells, EIS, Ti alloys
1. INTRODUCTION
Existing designs of implants with conventional metallic materials for orthopedic replacements, bone fixators, artificial joints and external fixators are constantly evolving for better comfort and functional reliability [1,2]. In the human environment, the surface of the implant material makes the first contact with cells, which normally adhere to the material through adhesive cell proteins such as integrin, fibronectin, vitronectin, and collagen. Reactions between the metallic implant surface and the cells are important because the biomolecules that migrate to the implant possibly form a protective layer and in turn influence the cell’s capacity to proliferate and differentiate. On the other hand, body fluid can dissolve metal ions from the implant resulting in corrosion products which may show toxicity when they interact with biomolecules and cells [2–5]. It then becomes important to understand in detail the contribution of the components of the ECM which protect the surface of the implant from body fluids, as well as enhance the biocompatibility and osseointegration processes. In addition, knowledge of basic mechanisms of cell-material interaction and better understanding of ongoing processes at the cellular level during the interaction of anchorage dependent cells can aid in the development of new biomaterials or in improvement of current implant materials [6]. Furthermore, an understanding of the proteins involved in osteoblast adhesion can also open up new possibilities for the grafting of proteins onto materials, to increase their in vivo bioactivity or to promote cell integration with the material. Electrochemical responses at the implant site as a consequence of protein adsorption, cell adhesion and growth may enable understanding of the different processes that occur at the implant surface/cell interface through electrochemical techniques, such as the evaluation of corrosion potential and electrochemical impedance response with time [7].
With the advent of titanium based alloys into the hard tissue implant market, the response of cellular interaction with titanium, must be clearly understood. The osteoblast cells at the tissue/implant interface use proteins to adhere to the surface of the titanium alloy and produce an ECM with a characteristic composition [8]. The various factors that influence the response of this interface including surface morphology, pH, ionic composition, strength of the solution, functional groups of proteins and the Ti alloy substrate which determine protein adsorption must be well understood since the adhesion and subsequent proliferation of osteoblast cells on different Ti-based alloys has been shown to be altered substantially by the topography and the composition of the materials used [9–12].
Parallel to biocompatibility studies conducted on Ti-based alloys [9], data obtained through electrochemical methods have been reported by various authors who have obtained polarization resistance (Rp) values of Ti-based alloys with and without cell culture to be in the order of 0.1 –100 MΩ.cm2 [4,5,7,13–18]. Increased corrosion resistance of titanium has been attributed to the enhanced cellular deposition of proteins and calcium phosphate in the ECM. This deposit inhibits the electrochemical reaction and increases the Rp by covering the electrode surface by blocking mass transport of oxygen and/or reaction products to and from the electrode surface [19]. Hodgson et al and Ouerd et al studied the influence of calcium and phosphate ions in physiological media by immersing titanium samples and confirmed the existence of adsorption phenomena as well as the formation of a passive film which protected the titanium surface [20,21]. Healy et al also revealed that titanium oxide incorporates both Ca and P elements from the extracellular fluid while increasing in thickness as a function of time [22].
Further understanding of the interaction between the cell layer and implant is important to prolong implant life. The focus of this research is to study the effect of adherent cells and subsequent formation of collagen in the extracellular matrix (ECM) over Ti-6Al-4V and γTiAl alloy surfaces as a function of time and compare the degree of protection provided by this cell layer against corrosion through the use of electrochemical impedance spectroscopy (EIS) and cyclic voltammetry. In a parallel set of experiments, cell adhesion and morphology of MC3T3-E1 osteoblast-like mouse cells cultured on Ti-6Al-4V and γTiAl surfaces, will be evaluated by scanning electron microscopy (SEM) and Confocal Microscopy to ascertain normal cell growth in support of the electrochemical data.
2. EXPERIMENTAL
For this study, an electrolytic cell was designed to evaluate the electrochemical properties of MC3T3-E1 cells (osteoblast-like mouse cells) cultured on substrate metal as a function of incubation time. Two metal alloys, Ti-6Al-4V and gamma titanium aluminide (γTiAl) were used as substrate materials. γTiAl, has a composition of 48 at.% Ti, 48 at.% Al, 2% at.% Cr and 2 at.% Nb while Ti-6Al-4V has a composition of 87.73 wt.% Ti, 6.85 wt.% Al and 5.42 wt.% V (ASTM F136). The MC3T3-E1 cells were incubated on these alloys during 4, 7 and 14 days in a simulated solution consisting of alpha-MEM (90%) and 10% fetal bovine serum (FBS). Cells were also seeded on a glass cover slip as control to monitor cell growth.
2.1 Preparation of metallic samples
Sample disks with a thickness of 0.13 cm were cut from 0.76 cm diameter cylindrical Ti-alloy rods using a Buehler® Isomet slow speed diamond saw. Based on previous results [23] in which no significant differences in cell attachment and growth on Ti alloys with varying surface roughness were observed, all samples were mechanically ground using 600 grit silicon carbide paper. After surface preparation, the samples were subjected to a rigorous cleaning procedure in order to avoid contamination. The metal disks were cleaned by sonication in Alconox® for 5 minutes. The same procedure was carried out using distilled water followed by ethanol. This cleaning procedure was repeated twice. Samples were later rinsed using distilled water and dried with a blow dryer. Finally, disks were sterilized by autoclaving at 15 psi and 121°C. Three (3) samples were tested for each experimental condition.
2.2 Cell Culture Method
Mouse preosteoblast MC3T3-E1 cells (ATCC CRL-2593) were chosen since the cell line represents a good model for studying in vitro osteoblast differentiation, particularly ECM signaling. This cell line behaves similar to primary calvarial osteoblasts, which are ideal for modeling bone cells. Cells were cultured in Alpha Minimum Essential Medium (αMEM) with ribonucleotides, deoxyribonucleotides, 2mM L-glutamine and 1 nM sodium pyruvate but without ascorbic acid. The cells were cultured in 90% αMEM, (Sigma- Aldrich, St. Louis, Missouri) with 2.5 mM L-Glutamine and 15 mM Hepes, without phenol red, supplemented with 0.3 mg/mL G-418 (Calbiochem, San Diego, California) and 10% Fetal Bovine Serum (FBS) (Hyclone, Logan, Utah). Cells were grown on Ti-alloy surfaces (γTiAl and Ti-6Al-4V) in a specially designed electrochemical cell for 4, 7 and 14 days of incubation while on the control surfaces (glass coverslip) cells were cultured in plastic culture flasks. Incubator conditions were maintained with 5% CO2 at 37°C. The electrolytic cell was designed and fabricated in-house and is shown in Figure 1. Transparent acrylic was used for the body of the electrolytic cell while nylon was used for the bottom and cover sections. An AISI 316 stainless steel bolt was incorporated into the bottom nylon section and when screwed into the cell wall allowed for the sample disk to make contact with the electrode. A cover was used for the electrolytic cell to prevent contamination of cells in the incubator. Reference and auxiliary electrodes were placed through holes in the cover. The electrolytic cell was cleaned with Alconox® and ethanol and subsequently sterilized by ultraviolet (UV) light for two hours. A 28 mm2 area corresponding to a 6-mm diameter of each sample disk was exposed to the α-MEM+FBS solution.
Figure 1.

Schematic diagram of the electrolytic cell.
2.3 Sample preparation for microscopy
Scanning electron microscopy (SEM) was employed to confirm the attachment and proliferation of cells on the substrates and the presence of mineralization nodules. In the same manner, and based on the understanding that cells are continuously connecting with each other through proteins in the ECM covering the surface, the analysis focused on the deposition of collagen for the interaction between ECM and materials. The titanium alloy samples (with and without cells) after incubation for 4, 7 and 14 days, were washed with PBS and fixed overnight in a 4% glutaraldehyde buffer in PBS at 4°C. After washing three times with PBS, the samples were dehydrated in graded ethanol (10–100%) for 10 min each. 100% ethanol solution was changed every 10 minutes for a total of three times. Just before analysis, critical point drying (EMS 850, Electron Microscopic Science, Washington) of the samples was carried out, after which they were mounted on stubs and sputter-coated with a thin gold film in EMS 550X (Electron Microscopic Science, Washington). Samples were then examined with a JEOL JSM-5410 LV SEM (JEOL, Japan).
To study the expression of the collagen in extracellular matrix, both qualitatively and quantitatively, samples cultured as a function of time, were observed using confocal microscopy. Samples were subsequently removed from the cell culture medium and washed three times with PBS. Immediately, cell tissue on the samples was fixed with 4% formaldehyde in PBS at room temperature for 20 min and washed twice in 0.05% Tween20 in PBS buffer. Cells were permeabilized using 0.15% Triton X-100 in PBS at room temperature for 5 min and washed twice with wash buffer. Subsequently, blocking solution (1%BSA in PBS) was added at room temperature for 1 hour. The blocking solution was removed and the primary antibody, diluted in the blocking solution was added. The primary antibody used was monoclonal anti-human collagen type I (mouse) (Calbiochem, San Diego, California). After 1 hour at room temperature, samples were washed three times with wash buffer for 10 min each, followed by the addition of the secondary antibody. The secondary antibody used was Alexa Fluor with TRITC-Phalloidin conjugate (Calbiochem, San Diego, California). Samples were incubated in the dark for 1 hour at room temperature and washed three times with wash buffer also in the dark, for 10 min each. DAPI solution in PBS was added for 10 min at room temperature and later washed three times with wash buffer in the dark. Samples were mounted in coverslips with ProLong® and stored at 4°C in the dark. Samples were observed using a Confocal Laser Scanning Microscope (Fluo View™ 300 Confocal Microscope, Olympus, USA).
Cells were grown on cover slips, Ti-6Al-4V and γTiAl disks at 5% CO2 and 37°C. After 4, 7 and 14 days of incubation, cells were washed with PBS 1X and fixed with 10% formalin (Fisher Chemical, PA) for 45 minutes. Cells were washed with distilled water and exposed to a 2% Alizarin Red S (Sigma-Aldrich, MO) solution at room temperature in the dark for 1hour. After staining, the cover slips and the metals were exposed to acetone (20 dips), acetone-xylene (1:1) (20 dips) and xylene (for five minutes). Cell culture was observed in a Nikon Eclipse 50i optical microscope to identify mineral deposits stained by Alizarin Red.
2.4 Electrochemical Impedance Spectroscopy Testing
Electrochemical testing, with and without cells, were carried out using a Gamry® galvanostat/potentiostat. Electrochemical impedance spectroscopy (EIS) was used to measure and analyze the electrochemical signals of specimens at different incubation periods using the three-electrode electrolytic cell fabricated for this study. Before each use, the parts of the cell were left overnight in a solution with Alconox®, after which they were washed with distilled water and ethanol. To ensure that the cell had no residues of ethanol and that the sterilization process was complete, the cell was further exposed to UV radiation for two hours. After the cell was assembled with the sample disk, the MC3T3-E1 cells were seeded on the disks and cultured for the required time period in an incubator set at 37 °C with a 5% CO2 environment. Medium was changed every 3 days. The electrolytic cell was covered with the lid with the electrodes in place in their respective apertures during the incubation period. After the required incubation periods of 4, 7 and 14 days, the electrolytic cell was removed from the incubator, the electrodes connected and EIS testing carried out after the open circuit potential was allowed to stabilize for 30 minutes. The EIS measurements were carried out at the open-circuit potentials with sinusoidal potential of 10mV amplitude. The testing frequency ranged from 100 kHz to 1 mHz. Saturated calomel electrode (SCE) and platinum were used as the reference electrode and counter electrode respectively. Cell culture medium was used as the electrolyte. Each run lasted between 4–5 hours during which no contamination was observed nor was cell debris visible after the testing. For comparison, similar runs were carried out on bare Ti alloy disks on which cells were not seeded. Table 1 is a compendium of the experimental design of the present study. The analysis of the EIS data was performed using the Gamry EChem Analyst Software®.
Table 1.
Experimental design used for SEM imaging, immunofluorescence labeling and EIS testing. Glass coverslips were not tested using EIS.
| Incubation Time | Culture conditions | Samples |
|---|---|---|
| 4 days | Without cells | Ti6Al4V |
| γTiAl | ||
| Glass coverslip | ||
|
| ||
| With cells | Ti6Al4V | |
| γTiAl | ||
| Glass coverslip | ||
|
| ||
| 7 days | Without cells | Ti6Al4V |
| γTiAl | ||
| Glass coverslip | ||
|
| ||
| With cells | Ti6Al4V | |
| γTiAl | ||
| Glass coverslip | ||
|
| ||
| 14 days | Without cells | Ti6Al4V |
| γTiAl | ||
| Glass coverslip | ||
|
| ||
| With cells | Ti6Al4V | |
| γTiAl | ||
| Glass coverslip | ||
2.5 Cyclic Voltammetry Testing
Cyclic voltammetry testing (CV), with collagen, without cells and with cells was carried out using an Epsilon BASI C-3 Cell Stand. CV was used to measure the current variation when the potential is modified for different incubation periods using a three-electrode cell. Glassy Carbon electrode was used as the working electrode while Ag/AgCl and platinum were used as the reference electrode and counter electrode respectively. The electrolyte was the culture medium. Medium alone and medium with collagen were used as the control samples. The latter was used to identify the voltage corresponding to the current peak associated with the presence of collagen for identification of this protein in the cell culture on the Ti-based alloy substrates. The samples were incubated at 37°C using a control group (glass cover slip incubated with and without cells), negative control group (metal disks incubated without cells in culture media) and experimental group (cells cultured on Ti-based alloys). After incubating the Ti-6Al-4V and γTiAl samples for 4, 7 and 14 days with cells, the cellular tissue from the metal surfaces were thoroughly dissolved in the electrolyte for subsequent analysis. The CV measurements were carried out in a range from 1000mV to −1000mV with a 100mV/s scan rate in nitrogen gas.
Since it is reported that sample surface roughness affects cell proliferation and collagen synthesis, the present study was performed at a constant roughness for all the titanium alloy substrates to avoid variability in the data due to this factor [24]. Variation in pH of the medium is another factor which could affect the experimental study and hence the cell culture medium was changed every three days to prevent acidification of the electrolyte and subsequent cell death [8].
3. RESULTS
3.1 Scanning Electron Microscopy imaging
Normal cellular activity on all three material surfaces (glass coverslips, γTiAl, Ti-6Al-4V) was corroborated by the presence of cellular deposits and growth, attachment, and proliferation of cells over time, during in vitro conditions. After 4 days, MC3T3-E1 osteoblast attachments were clearly seen on the different surfaces that were studied. Also, there were no significant variations in cell morphology and adhesion on the different substrates for the different incubation times observed. In Figures 2 and 3, representative images obtained by SEM are shown with and without cell culture for 4 to 14 incubation days on both, Ti-6Al-4V and γTiAl surfaces. Small mineral deposits on the surfaces can clearly be observed (Figure 2). The mineral deposits (shown by red arrows in Figures 2a and 2c) can be attributed to precipitated inorganic constituents (inorganic salts), specifically to crystalline compounds contained in alpha-MEM and FBS, used for the growth of osteoblasts in vitro. For metals with cells (Figures 2b and 2d) both inorganic salts and a layer of mineralized globules were seen. This layer is believed to contain these nodules of mineralization (blue arrows) in the form of spherical deposits in the extracellular matrix composed of C, O, P, Ca and Ti waste as reported by Advincula et al [25]. Usually the presence of these mineral deposits can be attributed to the normal activity of osteoblasts in one of their functional stages of the extracellular matrix after maturation and expected to increase with longer culture periods. An energy dispersive spectrum obtained from a mineralized nodule is shown in Figure 2. Surprisingly, Na was observed instead of calcium from the spectrum. This may be due to the fact that the amount of Na found in the electrolyte far exceeds the amount of Ca supporting the absence of the Ca peak. It is believed that a Ca peak would appear for a much longer acquisition time of the EDS spectra. Attempts to capture this information were unsuccessful and resulted in damage to the layers from the electron beam due to prolonged exposure. The other elements were clearly expected similar to the observations of Advincula et al [25] confirming the appearance of sodium/calcium-based phosphates during mineralization as part of the cell differentiation process.
Figure 2.

SEM images of (a) Ti-6Al-4V without cells, (b) Ti-6Al-4V with cells at 4 days, (c) γTiAl without cells and (d) γTiAl with cells at 4 days. Red arrow heads indicate inorganic constituents and blue arrow heads indicate nodules of mineralization. A high magnification image of the mineralized nodule (e) and its corresponding energy dispersive spectrum (f) are also shown.
Figure 3.

SEM images of (a) Ti-6Al-4V with cells for 4 day incubation, (b) Ti-6Al-4V with cells for 14 day incubation, (c) γTiAl with cells for 4 day incubation and (d) γTiAl with cells for 14 day incubation. F: Filopodia, L: Lamellipodia, B: Blebs; Semicircles represent intercellular connections. Samples at 7 days of incubation were not included since they exhibit similar morphology.
In general on all surfaces, cells showed polygonal morphology, with long and fine cytoplasmic prolongations, which is typical of osteoblast cells which are growing normally. This polygonal cell morphology corresponds to the start of the cell-surface interaction processes resulting in good attachment through anchorage and adhesion of the cells on substrates. This behavior was validated by the spread out aspect of cells, multiple microvilli and long cytoplasmic extensions that were seen on surfaces of both Ti-6Al-4V and γTiAl (Figure 3) and control glass cover slips [9,23]. Filopodia (F) spread and grew in the form of thin membranes as the cell adhesion continues and the cells become flattened on the surface of the substrate material consistent with the biocompatibility of the implant material [4]. Also, the osteoblasts exhibited lamellipodia (L) that are also part of the cytoskeleton which involves transport phenomena, traffic and cell division, also suggesting normal cell activity. As highlighted by the yellow semicircles, intercellular connections between neighboring cells can frequently be observed in the extracellular matrix for metallic surfaces which is also an indication of cell viability [6].
SEM images of both γTiAl and Ti-6Al-4V surfaces (Figure 2) clearly show the regular parallel orientation on the metallic surfaces remaining after the grinding process during preparation of these disks. The surfaces of Ti-6Al-4V and γTiAl after 4 days of incubation, presented cells oriented parallel to the grinding marks (Figures 2b and 2d) attributed to contact guidance. After 7 days of cell culture on metal disks, a cellular multilayer appeared on the substrate (not shown) while at 14 days cell alignment was still appreciated (see Figures 3b and 3d). For both Ti-6Al-4V and γTiAl alloys, the presence of multiple cell extensions “microvilli” that help extend the cell surface and improve the exchange of nutrients were clearly seen. In addition for both alloys, it can be seen that at 14 days of incubation it is difficult to capture the morphology of the individual cells because a compact tissue with cytoplasmic extensions formed on the surfaces. Despite their similarities, additional features of the cell-substrate interaction such as folds and blebs (B) can be seen with more detail for the γTiAl micrographs, (Figure 3c) [26]. Alizarin Red S staining also confirmed normal cell growth by the presence of mineral deposits as observed by pinkish regions on all substrates although darker particles which appear to be mineralized nodules are seen on the two titanium alloys in Figure 4. It appears that mineralization occurs earlier in Ti-6Al-4V (4 days) accompanied by the presence of a higher density of particles compared to γTiAl (7 days) although the latter manifests abundance of mineralization by the plethora of dark particles with greater intensity.
Figure 4.

Alizarin Red S staining of cell culture incubated on glass coverslip (control) for (a) 4 days, (d) 7 days, (g) 14 days, on Ti-6Al-4V for (b) 4 days, (e) 7 days, (h) 14 days and on γTiAl for (c) 4 days, (f) 7 days and (i) 14 days. Pinkish stains are generally observed on all surfaces. Dark particles appear to correspond to mineralized nodules.
3.2 Immunofluorescent labeling
The use of fluorescence labels to investigate the formation of type I collagen on metal implants in bone-forming activity and osteoblast differentiation processes has been reported earlier [27]. In this study, the metal disks and glass control surfaces were observed with and without cell culture with Rhodamine and DAPI labels using confocal microscopy. For all the samples with cell culture, the signal corresponding to nucleus of the cell (DAPI labeled, blue) and collagen type I (Rhodamine labeled, red) were clearly seen (Figure 5). In the MC3T3-E1 cultures, different stages of cell behavior exist as a function of time [28]. Differentiation normally initiates between the second and third day of incubation and hence it is believed that at the fourth day of incubation, cell proliferation has clearly ended and cell differentiation is promulgated. Therefore the samples at the fourth day of incubation indicate a value of cell density (cell density based on nuclei count using DAPI) on the surface corresponding to the end of proliferation and the initiation of cell differentiation [26,27]. At 60X magnification, a manual count of nuclei in randomly selected areas was performed for each of the samples to determine the cell density on the different substrates. A narrow range between 30 and 36 nuclei per area of analysis (51300μm2) were accounted for, confirming that a similar number of cells are attached on all the surfaces and therefore confirming the assumption that cell differentiation processes began with approximately the same number of cells on all materials. For samples where cellular tissue formation occurs to long periods of incubation, cell counting is more complicated since the overlapping cells makes quantification difficult.
Figure 5.
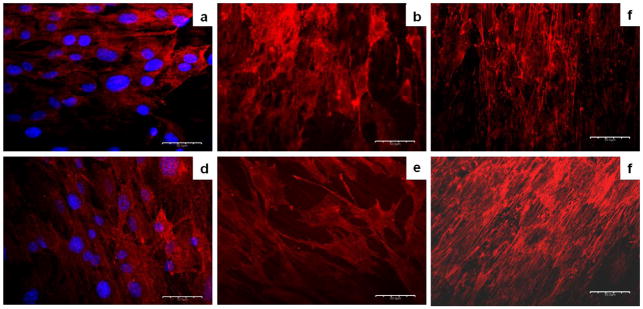
Confocal Laser Scanning Microscopy images corresponding to nucleus of the cell (DAPI labeled, blue) and collagen type I (Rhodamine labeled, red) in surfaces with MC3T3-E1 cells cultured at 5% CO2 in air atmosphere and at 37°C on Ti-6Al-4V for (a) 4 days, (b) 7 days and (c) 14 days and γTiAl for (d) 4 days, (e) 7 days and (f) 14 days. Magnification 60X.
In an effort to characterize the presence of collagen in a semi-quantitative manner, ImageJ®, commercial software was used to process the images obtained from confocal microscopy. All sample images at 60X magnification were analyzed with ImageJ. The image was separated into two extreme levels of intensity (white and black) according to the pixels of the sample images obtained by confocal microscopy. A histogram of these levels was obtained from the software, in which, the number of black and white regions on each image can be clearly quantified. This is expected to give an idea of the amount of collagen secreted in each of the samples. Increased collagen deposition was measured for longer incubation times as shown in Figure 6 and previously confirmed [26–28]. The bare metallic disks of the Ti-alloy samples cultured for 4 and 7 days generated fluorescence in response to the excitation of the laser in the confocal microscope. To counteract the effects generated by this interference, intensities corresponding to this fluorescence from the bare metal substrates were obtained from two significant areas of the images, for post analysis in ImageJ. These intensities correspond to 20.91% and 31.55% for bare Ti-6Al-4V and γTiAl substrate disks respectively. This brightness is then subtracted in the calculation of the image areas corresponding to collagen deposited on the titanium disks. Intensity data confirm the presence of collagen on the entire surface for a 4 day incubation period for all three materials. A higher percentage of collagen segregation was registered for the glass samples (control) compared to the metallic samples, while a small difference is observed between the two Ti-based alloys. For metallic substrates, Figure 5 shows the typical morphology of osteoblasts, corroborating the results obtained by SEM. Similarly, an increase in cell density over time can be observed by fluorescence. In the case of the metal samples for all periods of incubation, a dense cell layer was easily identified. This layer is basically formed by the extracellular matrix which contains the majority of segregated collagen from the cells and is likely responsible for stimulating further matrix formation and cell differentiation in osteoblasts [26–28]. Thus the formation of the extracellular matrix by the action of MC3T3-E1 cells, evidenced by the presence of collagen also confirms normal physiological activity on Ti-6Al-4V and γTiAl materials.
Figure 6.

Intensity of rhodamine fluorescence corresponding to the segregation of collagen on glass coverslip, Ti-6Al-4V and γTiAl.
Collagen expression in the cell culture on the Ti alloy surfaces is visible for 4, 7 and 14 incubation days. Intracellular collagen appears to be concentrated around the vicinity of the nucleus. The images in Figure 5 show that over time, the cells maintained normal morphology without any damage to the nuclei nor significant change in size, thus showing continued physiological cellular activity in the tissue over the Ti alloy surfaces. It is noteworthy that cells incubated on γTiAl disks showed better polygonal morphology than disks of Ti-6Al-4V after 7 days of incubation, which could possibly point to better biocompatibility of γTiAl when compared to Ti-6Al-4V [6].
Figure 6 shows the increase in collagen over time for all the surfaces. The increase observed is in accord with previous studies reported [9,23]. While a slight increase in the percentage of segregation of collagen as a function of time was registered with glass, for the Ti-6Al-4V and γTiAl samples, a significant increase is observed over the incubation period. The rate of collagen expression on γTiAl during the entire incubation period is high compared to the other substrates. While the expression of collagen is a good indication of the viability of the osteoblasts in contact with the Ti alloy surfaces, increased collagen production over time is synonymous with excellent cellular activity and confirms the biocompatibility of these titanium materials. This is further corroborated by increase in accompanying mineralization from images exhibiting pinkish staining of calcium-based minerals with Alizarin Red S.
3.3 Electrochemical measurements and analysis
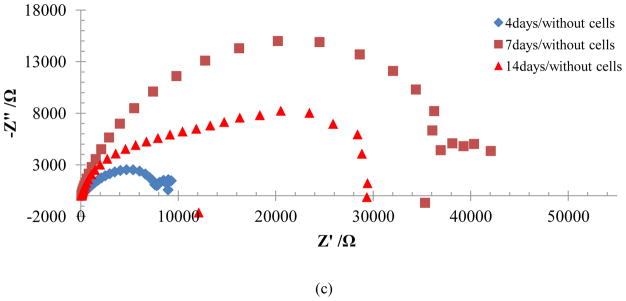
Electrochemical impedance spectroscopy was employed principally to investigate changes in the Ti alloy-electrolyte interface when cells are deposited on the surfaces of these materials. Bode plots for Ti-6Al-4V and γTiAl, with and without MC3T3-E1 cells cultured on their surfaces in αMEM are presented in this study. Figure 7 illustrates the behavior of Ti-6Al-4V samples incubated without cells in αMEM+FBS for periods of 4, 7, and 14 days at 37°C and with 5%CO2. The Bode impedance diagram (Figure 7a) clearly shows two plateaus for the samples at different incubation periods. One plateau is found between 1000 and 100000 Hz, while the other, located at low frequencies, is found between 0.01 and 0.1 Hz. These plateaus were accompanied by two slope changes between 10 to 1000 Hz and 0.001 to 0.01 Hz for periods of incubation greater than 4 days. The changes in slope are attributed to capacitive behavior resulting from a protective film of oxide formed over the material and by the amino acid and protein deposited by the electrolyte-surface interaction [3]. Corresponding Nyquist plots indicate the presence of one to two domes for these experimental conditions. The first dome is attributed to the substrate oxide which forms very quickly on are titanium surfaces. It must be highlighted that corrosion was observed as of the seventh day of incubation in Ti-6Al-4V, which can be reflected in the changes registered in the impedance spectrum at the lowest frequencies possibly corresponding to some type of mass transfer. Impedance values seen in the Bode diagram for samples with intermediate incubation periods were slightly lower, attributed to the porous nature of the oxide film formed on Ti-6Al-4V [29] which later increases as the oxide film is consolidated with increased time of exposure. Therefore, it appears that the time of contact and the electrolyte itself may influence the electrolyte-Ti-6Al-4V interaction, as reported by Hiromoto et al [3]. Corresponding data for γTiAl alloy without cell culture in αMEM for 4, 7 and 14 days is seen in Figure 8 where only one clearly defined dome is visible in the Nyquist plots. While the overall behavior of the two alloys is similar, differences indeed exist when compared to the impedance spectrum for Ti-6Al-4V. The impedance of the γTiAl samples not only demonstrates an increasing trend with incubation time, but the impedance values are higher than those for Ti-6Al-4V, suggesting better corrosion protection of the former in the α-MEM+FBS solution. The oxide layer formed in Ti-6Al-4V does not appear to be very protective, resulting in corrosion of this alloy at longer incubation times. The similarity at high frequencies for both Ti alloys confirms the fact that impedance is dominated by the solution resistance, since phase angle values close to 0° are registered as seen in Figure 7b and Figure 8b. The slope close to −1 in the intermediate zones of the Bode impedance plot confirms the capacitive behavior attributed to a film on the surface of the material. These results are confirmed by Hanawa [2] who adjudicates this behavior to the proteins found in the αMEM+FBS electrolyte which form a layer over the surface oxide film of Ti alloy. The resistance and capacitance values at 105–103 Hz, 100–10−2 Hz, and 10−3 Hz were obtained for the three incubation periods corresponding to the solution resistance (Rs), the substrate metal/oxide film (R1, C1) and a porous titanium oxide layer/adsorbed protein layer (R2, C2) respectively. The EEC data is summarized in Table 2.
Figure 7.

Bode impedance (a) Bode phase angle (b) and Nyquist (c) plots for Ti-6Al-4V without cells in αMEM+FBS solution.
Figure 8.

Bode impedance (a) Bode phase angle (b) and Nyquist (c) plots for γTiAl without cells in αMEM+FBS solution.
Table 2.
EIS data for the different experimental conditions used in this study.
| EXPERIMENTAL DATA OBTAINED FROM IMPEDANCE DIAGRAMS | ||||||||||||
|---|---|---|---|---|---|---|---|---|---|---|---|---|
| Materials | Ti6Al4V without cells | Ti6Al4V with cells | γTiAl without cells | γTiAl with cells | ||||||||
| Time(days) | 4 | 7 | 14 | 4 | 7 | 14 | 4 | 7 | 14 | 4 | 7 | 14 |
| Rs (Ω.cm2) | 59.3 | 87 | 107 | 117 | 106 | 39.3 | 125 | 59.7 | 66.2 | 101 | 107 | 108 |
| R1(MΩ.cm 2) | 0.016 | 0.004 | 0.003 | 0.007 | 0.001 | 0.026 | 0.008 | 0.037 | 0.009 | 0.001 | 0.003 | 0.046 |
| C1(μF/cm2) | 0.20 | 14.37 | 6.83 | 17.18 | 23.57 | 16.69 | 57.08 | 22.38 | 3.34 | 16.36 | 9.07 | 3.34 |
| R2(MΩ.cm 2) | X | 0.004 | 0.014 | 0.007 | 0.013 | X | X | X | 0.020 | 0.012 | 0.010 | X |
| C2(μF/cm2) | X | 190 | 219.93 | 163.11 | 246.59 | X | X | X | 29.68 | 92.31 | 61.22 | X |
| R3(MΩ.cm2) | X | X | X | 0.012 | 0.013 | X | X | X | X | 0.012 | X | X |
| C3(μF/cm2) | X | X | X | 102.18 | 6292.1 | X | X | X | X | 9870 | X | X |
The impedance data for Ti-6Al-4V with the cellular tissue immersed in αMEM+FBS is observed in Figure 9. A third element pair (R3, C3) was added to some of the data for this case. It is believed, that even as early as 4 and 7 days of incubation MC3T3-E1 preosteoblasts, cell differentiation occurs, accompanied by the formation of mineral deposits in the cell culture [30,31], which act as conducting paths resulting in a decrease in the impedance of the cell layer. Capacitive behavior at medium frequencies with phase angle values close to −70° is observed similar to Ti-6Al-4V samples without cells. Three domes were observed in the Nyquist plots (Figure 9c) with progressively increasing impedance after 4 and 7 days of incubation with cells respectively. In contrast, only one single dome is observed after 14 days of incubation suggesting that the cell culture has become a thin tissue-like layer covering the sample surface completely and protecting against corrosion phenomena. This confirms that electrochemical changes do occur in response to cell proliferation and differentiation. The EIS data obtained for samples of γTiAl for 4, 7 and 14 days of incubation with cell culture are shown in Figure 10 and it clearly indicates the relatively greater impedance of the cell layer cultured on γTiAl after 14 days of incubation. For this alloy, mineral deposition resulting from the differentiation of the MC3T3-E1 preosteoblasts and manifested as decreased impedance appears to be more pronounced after 7 days of incubation. The large impedance values in the case of the γTiAl alloy are a result of a protective, compact oxide layer and an even more protective tissue-like layer formed on the samples after 14 days of incubation. Comparing the two alloys with cell culture observation, the EIS data appears to indicate that at 14 days of incubation with MC3T3-E1 cells, a greater value of impedance is demonstrated for γTiAl compared to Ti-6Al-4V. It is plausible that this may be due to the presence of vanadium in the latter oxide which may be disadvantageous for cell growth as reported earlier [4,32]. However, such behavior can only be confirmed with a high level of reliability for longer periods of incubation or with in vivo experimentation.
Figure 9.

Bode impedance (a) Bode phase angle (b) and Nyquist (c) plots for Ti-6Al-4V incubated with cells in αMEM+FBS solution.
Figure 10.

Bode impedance (a) Bode phase angle (b) and Nyquist (c) plots for γTiAl incubated with cells in αMEM+FBS solution.
The resistance polarization was compared as a result of the segregation of collagen for both metallic samples with cell culture aided by the results obtained through confocal microscopy. Cleary collagen segregation in γTiAl increases over longer times of incubation as observed from Figure 5 and Figure 6. Figure 11 shows a set of cyclic voltammograms at 4, 7 and 14 days of incubation for glassy carbon (GC). The voltammetric features for GC in the medium (orange line) and in medium with collagen (blue line) show a significant difference, represented at the peak seen at negative potentials, attributed to the presence of collagen in the sample. This reduction peak, attributed to collagen in the −0.6 and −0.8V potential region, was also seen for all samples with cells at all incubation times. At 4 days of incubation, the peak assigned to the activity of collagen was seen for both γTiAl as well as Ti6Al4V in the same range of potentials (Figure 11a). Similar peaks were seen for the other incubation periods confirming the strong presence of collagen in all the cell cultures incubated on the Ti alloy samples.
Figure 11.

Cyclic voltammograms for collagen detection in MC3T3 mouse preosteoblasts cultured on Ti-6Al-4V and γTiAl samples for (a) 4 days, (b) 7 days and (c) 14 days. Data for control sample of collagen and αMEM+FBS solution are also shown for comparison. Glassy carbon was used as working electrode and Ag/AgCl as reference electrode.
4. DISCUSSION
It is clear from the results presented above that MC3T3-E1 mouse preosteoblast cell function occurs normally on both Ti-6Al-4V and γTiAl substrates. The SEM images show clear evidence that these cells indeed attach, proliferate and differentiate during the incubation period. Cell morphology indicates spread out shapes which is testimony to the excellent attachment to the substrates. The formation of an extracellular matrix is a lso obvious, with both collagen fibers and mineralized nodules populating this structure. Collagen expression inside and outside the cell is another indication that cell growth appears to be normal. In the case of these mouse preosteoblasts, collagen formation is expected to increase as a function of the incubation period as demonstrated by Boada-Lopez el al [33]. Cell structure and function is also very similar to that on control glass coverslips indicating excellent cytocompatibility of these Ti alloys. Collagen content in the cell cultures on both the glass coverslips and the Ti alloys substrates, appears to be similar as appreciated in Figure 5. In a sense, the specific immunofluorescent labeling of collagen and corresponding intensity measurements using laser confocal microscopy of collagen abundance in the cell cultures taken together with the expected results from glass coverslips appear to ratify the method utilized in this study. For longer incubation periods, collagen expression is highest on γTiAl indicating the promise of this material for hard tissue implants. Similarly, based on the Alizarin Red S staining, it also appears that mineralization in the cell culture occurs earlier (~4 days) in Ti-6Al-4V alloys, but its degree is much greater after 7 days on γTiAl.
Electrochemical characterization of these mouse preosteoblasts cell cultures provides some interesting insights into cell function. The type of Ti alloy substrate and the incubation period appear to be important in cell function of MC3T3-E1 cells. Ti-6Al-4V appears to form surface oxide rather quickly in the αMEM+FBS environment, although this oxide is not as compact and hence not protective even for longer incubation periods. Nevertheless, this oxide may be instrumental in inducing cell differentiation manifested as early mineralization in the ECM. Even though the mouse preosteoblasts attach and proliferate normally on this surface, adequate protection is still not attained and impedance due to this combined oxide-cellular layer is not as high. This indicates that although a Ti-6Al-4V implant may induce normal cell attachment and elicit normal cell function earlier, which results in extensive coverage of the implant surface, it may fail to protect the implant from impending corrosion phenomena in the long term. This may be detrimental to the host tissue and lead to osteolysis and finally implant loosening. On the other hand, a compact and protective oxide layer is observed on γTiAl and even though it develops relatively slowly, it will offer more protection against corrosion and increase the longevity of the implant. Also, the slower evolution of cell growth and differentiation (mineralization) observed through the EIS data may actually be beneficial for γTiAl implants in the long run. Further studies are needed to clearly compartmentalize the individual contributions of each layer (oxide, protein, cell culture) which is quite complex considering the interactions between these components.
Although the interpretation of EIS data may be complex for these cases, this technique is obviously sensitive in detecting nuances in the cell culture which are reflected in impedance values of the cell layer.
5. CONCLUSIONS
SEM images showed MC3T3-E1cells attached on both Ti-6Al-4V and γTiAl alloy surfaces and displayed normal polygonal morphology and similar growth suggesting that these surfaces are optimal for cellular activity and hence cytocompatible. Normal mineralization was also confirmed using Alizarin Red S staining with earlier mineralization on Ti-6Al-4V and later but larger degree of mineralization on γTiAl.
Immunofluorescence analysis confirmed the presence of cellular tissue and increased segregation of collagen Type I on both Ti alloy surfaces with increasing incubation time, although γTiAl showed greater aggregation of collagen at longer periods of incubation, indicating that this alloy over time promotes more prolific cellular activity on its surface.
The electrochemical results indicate that proteins and cells formed another protective layer over the surface oxide film of Ti alloys, thus increasing the resistance polarization.
γTiAl demonstrated greater impedance in αMEM+FBS solution and hence probably will provide better protection of the implant surface compared to Ti-6Al-4V for longer implant periods.
Highlights.
Ti-6Al-4V and γTiAl alloy surfaces are cytocompatible for MC3T3-E1cells.
Collagen Type I expression increases on Ti alloy surfaces with incubation time.
Proteins and cells increase the resistance polarization of Ti alloy surfaces.
γTiAl alloy surface is better protected by cell layer compared to Ti-6Al-4V in SBF.
Acknowledgments
We gratefully acknowledge the help of Mr. Jose Almodovar, Department of Biology at the University of Puerto Rico in SEM and Confocal Microscopy imaging. Partial funding for this research was provided by the UPRM-Purdue CIBER grant and grant no. SO6GM-08103 from the National Institutes of Health through the MBRS-SCORE program.
Footnotes
We have no conflict of interest based on this work with any person or entity.
Publisher's Disclaimer: This is a PDF file of an unedited manuscript that has been accepted for publication. As a service to our customers we are providing this early version of the manuscript. The manuscript will undergo copyediting, typesetting, and review of the resulting proof before it is published in its final citable form. Please note that during the production process errors may be discovered which could affect the content, and all legal disclaimers that apply to the journal pertain.
References
- 1.Bhat SV. Biomaterials. 2. Alpha Science; Middlesex, UK: 2005. [Google Scholar]
- 2.Hanawa T. Evaluation techniques of metallic biomaterials in vitro. Sci Technol Adv Mater. 2002;3:289–295. [Google Scholar]
- 3.Hiromoto S, Noda K, Hanawa T. Development of electrolytic cell with cell-culture for metallic biomaterials. Corros Sci. 2002;44:955–965. [Google Scholar]
- 4.Huang HH. In situ surface electrochemical characterizations of Ti and Ti-6Al-4V alloy cultured with osteoblast-like cells. Biochem Biophys Res Co. 2004;314:787–792. doi: 10.1016/j.bbrc.2003.12.173. [DOI] [PubMed] [Google Scholar]
- 5.García-Alonso MC, Saldaña L, Vallés G, González-Carrasco JL, González-Cabrero J, Martínez ME, Gil-Garay E, Munuera L. In vitro corrosion behaviour and osteoblast response of thermally oxidised Ti6Al4V alloy. Biomaterials. 2003;24:19–26. doi: 10.1016/s0142-9612(02)00237-5. [DOI] [PubMed] [Google Scholar]
- 6.Kumari TV, Vasudev U, Kumar A, Menon B. Cell surface interactions in the study of biocompatibility. Trends Biomater Artif Organs. 2002;15:37–41. [Google Scholar]
- 7.García-Alonso MC, Saldaña L, Alonso C, Barranco V, Muñoz-Morris MA, Escudero ML. In situ cell culture monitoring on a Ti-6Al-4V surface by electrochemical techniques. Acta Biomater. 2009;5:1374–1384. doi: 10.1016/j.actbio.2008.11.020. [DOI] [PubMed] [Google Scholar]
- 8.Hiromoto S. Corrosion of metallic biomaterials in cell culture environments. Interface. 2008;17:41–44. [Google Scholar]
- 9.Anselme K. Osteoblast adhesion on biomaterials. Biomaterials. 2000;2:667–681. doi: 10.1016/s0142-9612(99)00242-2. [DOI] [PubMed] [Google Scholar]
- 10.Oh S, Daraio C, Chen LH, Pisanic TR, Fiñones RR, Jin S. Significantly accelerated osteoblast cell growth on aligned TiO2 nanotubes. J Biomed Mater Res A. 2006;78:97–103. doi: 10.1002/jbm.a.30722. [DOI] [PubMed] [Google Scholar]
- 11.Wang CC, Hsu YC, Hsieh MC, Yang SP, Su FC, Lee TM. Effects of nano-surface properties on initial osteoblast adhesion and Ca/P adsorption ability for titanium alloys. Nanotechnology. 2008;19:335709. doi: 10.1088/0957-4484/19/33/335709. [DOI] [PubMed] [Google Scholar]
- 12.Resende CX, Lima IR, Gemelli E, Granjeiro JM, Soares GdA. Cell adhesion on different titanium-coated surfaces. Matéria. 2010;15:386–391. [Google Scholar]
- 13.Milosev I, Metikos-Hukovic M, Strehblow HH. Passive film on orthopaedic TiAlV alloy formed in physiological solution investigated by X-ray photoelectron spectroscopy. Biomaterials. 2000;21:2103–2113. doi: 10.1016/s0142-9612(00)00145-9. [DOI] [PubMed] [Google Scholar]
- 14.Aziz-Kerrzo M, Conroy KG, Fenelon AM, Farrell ST, Breslin CB. Electrochemical studies on the stability and corrosion resistance of titanium-based implant materials. Biomaterials. 2001;22:1531–1539. doi: 10.1016/s0142-9612(00)00309-4. [DOI] [PubMed] [Google Scholar]
- 15.Ibris N, Mirza Rosca JC. EIS study of Ti and its alloys in biological media. J Electroanal Chem. 2002;526:53–62. [Google Scholar]
- 16.Mustafa K, Wroblewski J, Hultenby K, Silva Lopez B, Arvidson K. Effects of titanium surfaces blasted with TiO2 particles on the initial attachment of cells derived from human mandibular bone. Clin Oral Implan Res. 2000;11:116–128. [PubMed] [Google Scholar]
- 17.Marino CEB, Mascaro LH. EIS characterization of a Ti-dental implant in artificial saliva media: dissolution process of the oxide barrier. J Electroanal Chem. 2004;568:115–120. [Google Scholar]
- 18.Huang HH, Pan SJ, Lu FH. Surface electrochemical impedance in situ monitoring of cell- cultured titanium with a nano-network surface layer. Scripta Mater. 2005;53:1037–1042. [Google Scholar]
- 19.Cheng X, Roscoe SG. Corrosion behavior of titanium in the presence of calcium phosphate and serum proteins. Biomaterials. 2005;26:7350–7356. doi: 10.1016/j.biomaterials.2005.05.047. [DOI] [PubMed] [Google Scholar]
- 20.Hodgson AWE, Mueller Y, Forster D, Virtanen S. Electrochemical characterisation of passive films on Ti alloys under simulated biological conditions. Electrochim Acta. 2002;47:1913–1923. [Google Scholar]
- 21.Ouerd A, Alemany-Dumont C, Berthome G, Normand B, Szunerits S. Reactivity of titanium in physiological medium. J Electrochem Soc. 2007;154:C593–C601. [Google Scholar]
- 22.Healy KE, Ducheyne P. The mechanisms of passive dissolution of titanium in a model physiological environment. J Biomed Mater Res. 1992;26:319–338. doi: 10.1002/jbm.820260305. [DOI] [PubMed] [Google Scholar]
- 23.Rivera-Denizard O, Diffoot-Carlo N, Navas V, Sundaram PA. Biocompatibility studies of human fetal osteoblast cells cultured on gamma titanium aluminide. J Mater Sci- Mater M. 2007;19:153–158. doi: 10.1007/s10856-006-0039-4. [DOI] [PubMed] [Google Scholar]
- 24.Martin JY, Schwartz Z, Hummert TW, Schraub DM, Simpson J, Lankford J, Jr, Dean DD, Cochran DL, Boyan BD. Effect of titanium surface roughness on proliferation, differentiation, and protein synthesis of human osteoblast-like cells (MG63) J Biomed Mater Res. 1995;29:389–401. doi: 10.1002/jbm.820290314. [DOI] [PubMed] [Google Scholar]
- 25.Advincula MC, Rahemtulla FG, Advincula RC, Ada ET, Lemons JE, Bellis SL. Osteoblast adhesion and matrix mineralization on sol–gel-derived titanium oxide. Biomaterials. 2006;27:2201–2212. doi: 10.1016/j.biomaterials.2005.11.014. [DOI] [PubMed] [Google Scholar]
- 26.Linez-Bataillon P, Monchau F, Bigerelle M, Hildebrand H. In vitro MC3T3 osteoblast adhesion with respect to surface roughness of Ti6Al4V substrates. Biomol Eng. 2002;19:133–141. doi: 10.1016/s1389-0344(02)00024-2. [DOI] [PubMed] [Google Scholar]
- 27.Findlay DM, Welldon K, Atkins GJ, Howie DW, Zannettino AC, Bobyn D. The proliferation and phenotypic expression of human osteoblasts on tantalum metal. Biomaterials. 2004;25:2215–2227. doi: 10.1016/j.biomaterials.2003.09.005. [DOI] [PubMed] [Google Scholar]
- 28.Al-Jallad HF, Nakano Y, Chen JL, McMillan E, Lefebvre C, Kaartinen MT. Transglutaminase activity regulates osteoblast differentiation and matrix mineralization in MC3T3-E1 osteoblast cultures. Matrix Biol. 2006;25:135–148. doi: 10.1016/j.matbio.2005.11.001. [DOI] [PubMed] [Google Scholar]
- 29.Delgado-Alvarado C, Sundaram PA. A study of the corrosion behavior of gamma titanium aluminide in 3.5 wt% NaCl solution and seawater. Corros Sci. 2007;49:3732–3741. [Google Scholar]
- 30.Xiao G, Gopalakrishnan R, Jiang D, Reith E, Benson MD, Franceschi RT. Bone morphogenetic proteins. extracellular matrix, and mitogen-activated protein kinase signaling pathways are required for osteoblast-specific gene expression and differentiation in MC3T3-E1 cells. J Bone Miner Res. 2002;17:101–110. doi: 10.1359/jbmr.2002.17.1.101. [DOI] [PubMed] [Google Scholar]
- 31.Nakashima K, de Crombrugghe B. Transcriptional mechanisms in osteoblast differentiation and bone formation. Trends Genet. 2003;19:458–466. doi: 10.1016/S0168-9525(03)00176-8. [DOI] [PubMed] [Google Scholar]
- 32.Rodríguez-Mercado JJ, Roldán-Reyes E, Altamirano-Lozano M. Genotoxic effects of vanadium (IV) in human peripheral blood cells. Toxicol Lett. 2003;144:359–369. doi: 10.1016/s0378-4274(03)00255-8. [DOI] [PubMed] [Google Scholar]
- 33.Boada-Lopez JA, DeJesus-Maldonado I, Jerez JI, Romañach RA, Diffoot-Carlo N, Sundaram PA. Determining collagen abundance in mouse osteoblast cultures using Near Infrared Microscopy. J Biomech. 2013;46:2442–2450. doi: 10.1016/j.jbiomech.2013.07.023. [DOI] [PubMed] [Google Scholar]