Abstract
The beginning stages of liver damage induced by various etiologies (i.e. high fat diet, alcohol consumption, toxin exposure) are characterized by abnormal accumulation of lipid in liver. Alterations in intracellular lipid transport, storage, and metabolism accompanied by cellular insult within the liver play an important role in the pathogenesis of liver disease, often involving a sustained inflammatory response. The intracellular lipid transporter, fatty acid binding protein 5 (FABP5), is highly expressed in macrophages and may play an important role in the hepatic inflammatory response after endotoxin exposure in mice. This study tested the hypothesis that FABP5 regulates macrophage response to LPS in male C57bl/6 (wild type) and FABP5 knockout mice, both in vitro and in vivo. Treatment with LPS revealed that loss of FABP5 enhances the number of hepatic F4/80+ macrophages in the liver despite limited liver injury. Conversely, FABP5 knock out mice display higher mRNA levels of anti-inflammatory cytokines IL-10, arginase, YM-1, and Fizz-1 in liver compared to wild type mice. Bone marrow derived macrophages stimulated with inflammatory (LPS and IFN-γ) or anti-inflammatory (IL-4) mediators also showed significantly higher expression of anti-inflammatory/regulatory factors. These findings reveal a regulatory role of FABP5 in the acute inflammatory response to LPS-induced liver injury, which is consistent with the principle finding that FABP5 is a regulator of macrophage phenotype. Specifically, these findings demonstrate that loss of FABP5 promotes a more anti-inflammatory response.
Keywords: Fatty acid binding protein-5 (FABP5), Macrophage polarization, pro-inflammatory macrophage (M1), anti-inflammatory macrophage (M2)
1. Introduction
Altered lipid composition in the liver may affect the biological activity of macrophages in acute hepatic inflammation. Fatty acid-binding proteins (FABPs), central regulators of both metabolic and inflammatory pathways, may be important targets for understanding the immune response during liver disease (1),(2). While Adipose FABP (FABP4, FABP-A) and Epidermal FABP (FABP5, FABP-E) are the only known isoforms co-expressed in the macrophage, we report here that macrophage expression of FABP5 limits the anti-inflammatory response in a model of hepatic inflammation and in macrophage polarization studies, in vitro.
In the past decade, several studies have uncovered diverse macrophage phenotypes. The once thought of homogeneous population is now known to exhibit an array of functional phenotypes categorized into two broad categories of polarized macrophages: M1, or classically activated, and M2, or alternatively activated (3). The pro-inflammatory (i.e. M1) response is largely activated by interferon gamma (IFN-γ) and/or lipopolysaccharide (LPS) and characterized by an increase in pro-inflammatory cytokines such as tumor necrosis factor alpha (TNF-α, interleukin 12 (IL-12), and interleukin 6 (IL-6) and a decrease in Transforming Growth Factor beta (TGF-β) (4). Alternatively, a non-classical anti-inflammatory (i.e. M2) response was originally induced by interleukin 4 (IL-4) but other stimuli have been shown as well, such as interleukin 13 (IL-13) and interleukin 10 (IL-10) (4). Phenotypically, the anti-inflammatory/regulatory response includes increased expression of TGF-β and a decreased IL-12 and IL-6 expression, as well as increased chemokines and scavenger and phagocytic activity which are important players of polarized M2 macrophages (5). Given the altered metabolic response and the excess lipid accumulation associated with the beginning stages of liver disease, it is important to understand the interaction between lipid and macrophage function.
While some work has been done to elucidate the role of FABP5 in atherosclerosis and obesity, little has been done to investigate the role of FABP in macrophages function. Male wild type (C57Bl/6) and FABP5 knockout mice were used for in vivo and in vitro experiments to investigate the role of FABP5 in the macrophage response. Livers and bone marrow derived macrophages from FABP5−/− express an increase in anti-inflammatory markers associated with liver disease yet exhibit resistance to LPS induced liver injury. Therefore, further understanding of how FABP5 regulates macrophage polarization during liver injury is required to better understand liver disease and pathogenesis.
2. Materials and methods
2.1. Animals
Male wild type C57Bl/6j (Jackson Laboratory, 22–25 g, males) and age- and weight-matched FAPB5-null mice (David Borhlohr, University of Minnesota) on C57Bl/6 background animals were caged under identical housing conditions, given humane care, and maintained in compliance with institutional guidelines (6).
2.2. Endotoxin treatment
Mice were given a single exposure to LPS (1 mg/kg, ip) or vehicle (saline). Livers were resected at 0, 3, 9, or 24 hours after LPS administration. All treatments with LPS were performed simultaneously in wild type and FABP5−/− animals. Following sacrifice, serum was collected for ALT evaluation and tissue was collected for subsequent analysis. Liver specimens were fixed in phosphate-buffered formalin and embedded in paraffin, and 7 μm sections were stained with hematoxylin and eosin, F4/80, and MPO for histological/immunohistochemical evaluation.
2.3. Clinical chemistry
Serum was collected 0, 3, 9, or 24 h after injection of saline (control) or endotoxin (LPS, 1 mg/kg). Serum alanine transaminase (ALT) levels were measured by standard biochemical assay (7).
2.4. Histology/immunohistochemical staining
Double fluorescent staining localizes FABP5 and F4/80 in hepatic tissue. FABP5 staining was performed as described briefly. Formalin fixed hepatic tissue sections (7 μm) were deparaffinized with xylene and rehydrated to water. Antigen retrieval was achieved by proteinase K in 10mM Tris-HCL. Slides were treated with H2O2 for 10 min at room temperature, washed, and primary FABP5 (H-45) rabbit polyclonal IgG antibody (Santa Cruz Biotechnologies) was applied (1:100) overnight at 4°C. Slides were subsequently washed and anti-mouse F4/80 antigen pan macrophage marker, BM8 (eBioscience) was applied (1:100) for 1 hr at room temperature. Biotinylated anti-rat IgG secondary was applied to tissue for 45 min followed by simultaneous addition of anti-rabbit IgG Alexa fluor 488 (green) and Alexafluor 546 (red) (1:200) (Cell signaling) for 45 minutes and coverslipped.
Standard H&E staining was performed as described (8). Tissue was dehydrated in 100% EtOH and coverslipped. F4/80 protocol was performed as described elsewhere (7). Tissues were incubated with anti-mouse F4/80 antigen (1:100) obtained from eBioscience (San Diego, CA) for 30 min at RT followed by anti-rat biotinylated (Vectastain ABC kit, Burlingame, CA) for 30 minutes. The hepatic macrophages of each mouse were identified and the F4/80 positive area (× 20 objective) was measured using ImageJ. The average for each mouse was determined. Myeloperoxidase staining was performed by using anti-MPO antibody (ThermoFisher Scientific, Waltham, MA). Briefly, tissues were deparaffinized, rehydrated, and incubated in 10 mM Tris-HCL containing 20μg/mL proteinase K (Thermo Scientific, Waltham, MA) at 37C for 30 minutes. Sections were blocked with 3% H2O2 for 10 minutes at room temperature and overnight application of MPO primary antibody (1:200) was applied. Anti-rabbit biotin labeled (1:200) secondary antibody (Cell signaling, Danvers, MA) was applied for one hour at room temperature. DAB was added to the tissue for 2 minutes. Sections were dehydrated and cover slipped. Quantitative histological evaluation was performed by counting MPO+ cells.
2.5. Bone marrow preparation and culture
Bone marrow cells were harvested from femurs of wild type and FABP5−/− mice. Cells (5×10⁶ cells/ml) were cultured in RPMI+10% FBS+1% PSG. Cells were treated (day 0) within a 5-day culture with M-CSF (10ng/ml, Peprotech). M-CSF was used to induce macrophage differentiation of F480+ cells prior to stimulation. On day 4 of culture, cells were moved to a 24-well plate (0.2 × 10⁶ cells/mL) and allowed to settle for 24 hours. After day-5 of culture, cells were treated for 4 or 24 hours with LPS (0.25 mg/ml) and/or IFN-γ (40 ng/ml) to induce an M-1 phenotype or IL-4 (20 ng/ml) to induce an M-2 phenotype.
2.6. RNA isolation and quantitative gene expression
Total RNA from liver tissue (~50mg), RNA from isolated liver macrophages, or BMDMs were isolated using Trizol (Invitrogen, Carlsbad, CA) reagent according to manufactures specifications. Total RNA (~1μg) was reverse transcribed using the high capacity reverse transcriptase kit (Invitrogen) according the manufacturers protocol. Gene expression was subsequently quantified using Maxima SYBR Green (ThermoFisher Scientific) and expression normalized to the house keeping gene 18s rRNA using the ΔΔcT method. Relative expression was normalized to untreated controls. The sequences of the primers used are listed in Table 1.
Table 1.
RT-PCR Primer Sequences.
| Primer | Sequence |
|---|---|
| 18s | 5′-CTTAGAGGGACAAGTGGCG-3′ (forward) 5′-ACGCTGAGCCAGTCAGTGTA-3′ (reverse) |
| TNF-α | 5′-AGCCCACGTAGCAAACCACCAA-3′ 5′-ACACCCATTCCCTTCACAGAGCAAT-3′ |
| iNOS | 5′-GAGATTGGAGGCCTTGTG-3′ 5′-TCAAGCACCTCCAGGAACGT-3′ |
| IL-12 | 5′-CTCACCTGTGACACGCCTGA-3′ 5′-CAGGACACTGAATACTTCTC-3′ |
| IL-6 | 5′-GAGGATACCACTCCCAACAGACC-3′ 5′-AAGTGCATCATCGTTGTTCATACA-3′ |
| TGF-α | 5′-TGACGTCACTGGAGTTGTACGG-3′ 5′-GGTTCATGTCATGGATGGTGC-3′ |
| YM-1 | 5′-TCTGGTGAAGGAAATGCGTAAA-3′ 5′-GCAGCCTTGGAATGTCTTTCTC-3′ |
| Fizz-1 | 5′-CAGCTGATGGTCCCAGTGAA-3′ 5′-TTCCTTGACCTTATTCTCCACGAT-3′ |
| Arginase | 5′-TTGGGTGGATGCTCACACTG-3′ 5′-TTGCCCATGCAGATTCCC-5′ |
| IL-10 | 5′-GGTTGCCAAGCCTTATCGGA-3′ 5′-ACCTGCTCCACTGCCTTGCT-3′ |
| IRF-4 | 5′-GACCAGTCACACCCAGAAATCCC-3′ 5′-GTTCCTGTCACCTGGCAAC-3′ |
| CCL-2 | 5′-TTCACAGTTGCCGGCTGG-3′ 5′-TGAATGAGTAGCAGCAGGTGAGTG-3′ |
| CCL-17 | 5′-TCACTTCAGATGCTGCTCCT-3′ 5′-TCACCAATCTGATGGCCTTC-3′ |
| Albumin | 5′-GACAAGGAAAGCTGCCTGAC-3′ 5′-TTCTGCAAAGTCAGCATTGG-3′ |
| F4/80 | 5′-CTGTAACCGGATGGCAAACT-3′ 5′-CTGTACCCACATGGCTGATG-3′ |
| CD3 | 5′-GGACAGTGGCTACTACGTCTGCTA-3′ 5′-TGATGATTATGGCTACTGCTGTCA-3′ |
| CD31 | 5′-GGTGGTTGTCATTGGAGTGG-3′ 5′-GAAGCAGCACTCTTGCAGTC-3′ |
| FABP5 | 5′-AGAGCACAGTGAAGACGAC-3′ 5′-CATGACACACTCCACGATCA-3′ |
2.7. Cell isolation
Isolation of hepatic stellate cells (HSC), Hepatocytes (HC), T-cells (TC), Liver sinusoidal endothelial cells (LSECs) and liver macrophages were performed as previously described (8–10) with slight modifications described below. Briefly, liver macrophages were perfused and fresh liver tissue was digested for 1 hr. at 37°C in a balanced salt solution containing 0.02% collagenase D (Roche, Indianapolis, IN). The digested suspension was separated by centrifugation 3 time at 50×g for 3 min to separate parenchymal cell populations. Non-parenchymal cells were purified by 15% Nycodenz (Accurate Chemical & Scientific Corp. Westbury, NY) density centrifugation at 1380 × g for 15 minutes. The layer above the Nycodenz gradient phase contains endothelial cells, Kupffer cells, small hepatocytes, and HSCs. This layer was collected and pelleted by centrifugation at 500 × g for 10 min. Cells were cultured on plastic tissue culture plates in RPMI-1640 medium supplemented with 10% FBS and 1% PSG in a 5% CO2 atmosphere. After 2 hours, non-adherent non-parenchymal cells (lymphocytes, hepatic stellate cells, and endothelial cells) were separated from adherent macrophages. Cells were collected for RNA isolation by trizol.
2.8. Data analysis and statistics
Statistical analysis and generation of graphs were performed using SigmaPlot 11.0 (Systat Software Inc, San Jose, CA). Statistical significance of difference between WT and FABP5−/−, and control and LPS exposed were assessed by comparison of the mean using the independent samples t test. Values are expressed as mean ± SEM. Differences were considered significant if P < .05.
3. RESULTS
Cell purity and co-localization of FABP5 expression with expression of the hepatic macrophage marker F4/80
Cell populations harvested from the livers of C57Bl/6 mice were isolated to purity using established protocols described in the Materials and Methods section. Validation of cell purity was determined by expression of cell-specific mRNAs for hepatocyte albumin, hepatic macrophage/Kupffer cell marker F4/80, hepatic stellate cell α-SMA, T-cell CD3, and endothelial cell marker CD31. Importantly, the expression of FABP5 in each of the purified hepatic cell populations was interrogated. FABP5 expression was most notably expressed in hepatic Kupffer cells (Figure 1 A), with traceable amounts in CD3+ lymphocytes as reported elsewhere (11).
Figure 1. Cell purity and co-localization of FABP5 expression with expression of the hepatic macrophage marker F4/80.
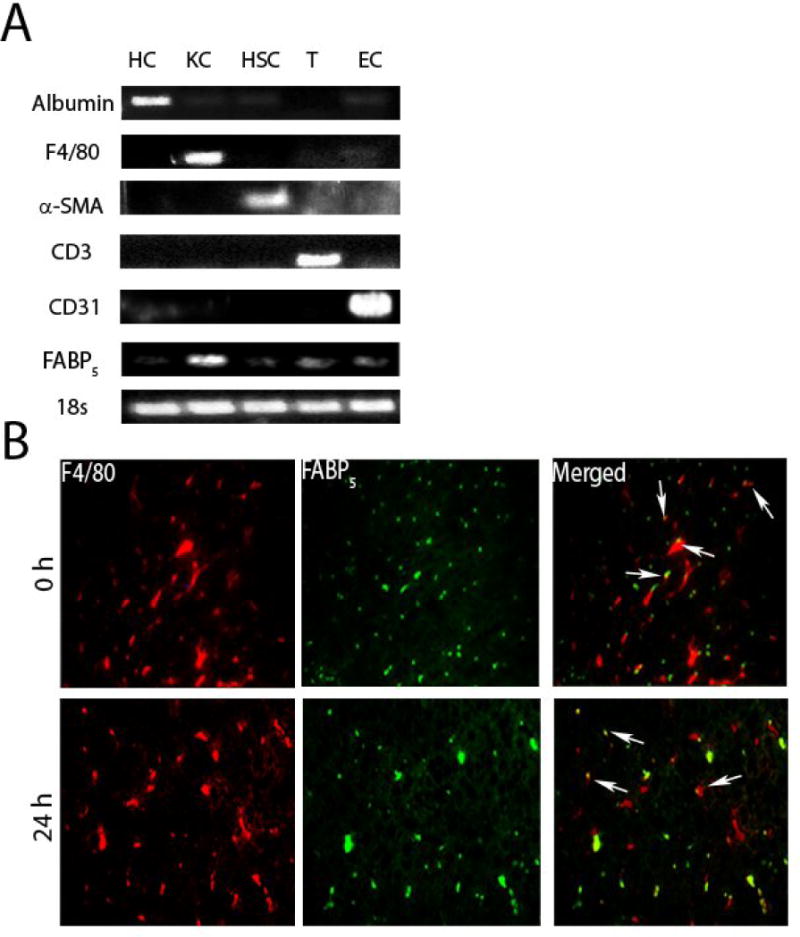
A: Cell colonies were obtained from the livers of C57Bl/6 mice as described in materials in methods. The mRNAs of hepatocyte (HC) marker albumin, hepatic Kupffer cell (KC) marker F4/80, hepatic stellate cell (HSC) marker α -SMA, T-cell (T) marker CD3, endothelial cell (EC) marker CD31, and FABP5 were detected by reverse transcription polymerase chain reaction. B: Immunohistochemistry was performed on sections of liver from C57Bl/6 (WT) mice treated with saline as control (0 h) or LPS for 24 hours. Antibodies to the hepatic macrophage marker F4/80 and FABP5 were used. Merged image shows colocalization of F4/80 and FABP5 expression. Micrographs are at 40x magnification. Arrows point to hepatic macrophages.
To further investigate the macrophage localization of FABP5 in liver, immunofluorescence of the hepatic macrophage marker F4/80 and FABP5 was performed on liver sections of control livers and in livers of mice treated with LPS for 24 hours. Both in liver of untreated and LPS-treated mice, FABP5 expression largely co-localized to F4/80+ cells. (Figure 1B).
3.1. LPS promotes hepatic macrophage expression
Relative FABP5 mRNA gene expression was measured from whole liver of wild type mice at each time point (0, 3, 9 or 24 hours) post LPS by qPCR. Treatment with endotoxin shows a time dependent increase in FABP5 gene expression (Figure 2A). To determine FABP5 expression pattern in the macrophage, cells were isolated and purified from livers of wild type mice as described in methods. Liver macrophages were isolated from wild type controls (Saline) or LPS treated mice for 3, 9 or 24 hours (Figure 2 B) demonstrating further that there is a time dependent increase in FABP5 expression in the hepatic macrophage.
Figure 2. LPS promotes hepatic FABP5 expression.
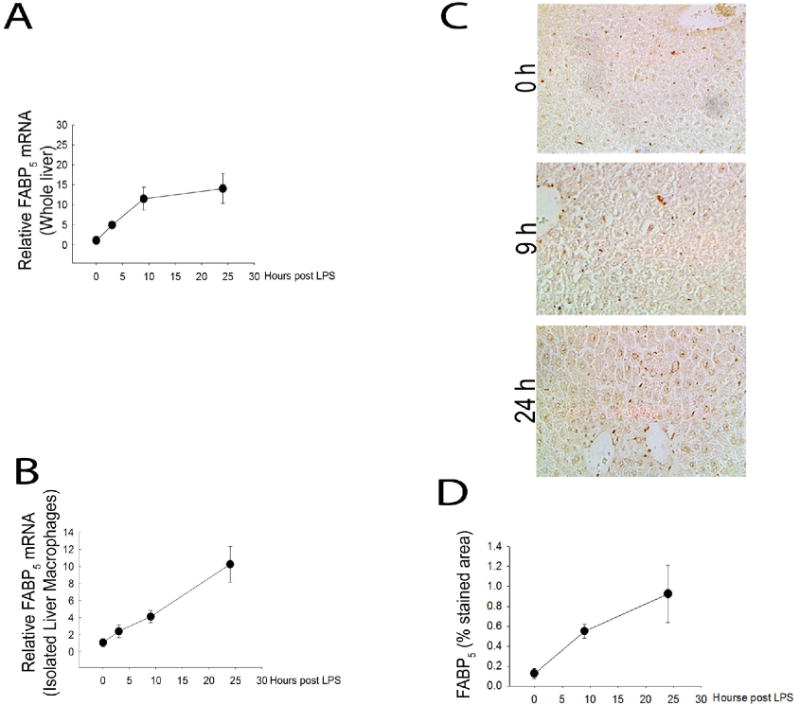
Wildtype and FABP5−/− mice were treated with saline (control) or LPS for 3, 9 or 24 hours. A: Control whole liver FABP5 mRNA expression was analyzed via quantitative PCR and normalized to the housekeeping gene 18S rRNA. B: WT liver macrophages were isolated as stated earlier and FABP5 mRNA expression was analyzed via quantitative qPCR and normalized to 18s rRNA. C: Immunohistochemistry was performed on sections of liver tissue from WT mice treated with LPS for 0, 9, or 24 hours using an antibody to FABP5. D: Percent stained area was determined by image J analysis in three separate measurements from each time point.
3.2. FABP5−/− mice have blunted liver injury yet an increase in hepatic macrophages following acute injury
To confirm the total knockout of FABP5, whole liver mRNA from wild type and FABP5−/− mice were analyzed by qPCR to measure FABP5 gene expression (Figure 3A). Next, the role of FABP5 in liver injury was assessed. Wild type and FABP5−/− mice were exposed to saline as a control or LPS (1 mg/kg, IV) for 0, 3, 9, or 24 hours. Body weight (BW) and liver weight (LW) were measured at time of sacrifice from control and LPS treated mice. Absence of FABP5 did not alter LW/BW ratios following LPS exposure (Figure 3B). Serum ALT was measured to assess the extent of liver injury in wild type and FABP5−/− strains at 0, 3, 9, and 24 hours after either saline or LPS exposure (1 mg/kg, IP). There was no difference between wild type and FABP5−/− serum ALT at 0, 3, and 9 hours post LPS exposure. (Figure 3C). In wild type mice, a time dependent increase in serum ALT levels after LPS exposure was observed. However, the peak of serum ALT levels after 24 hours seen in wild type mice was reduced in serum from FABP5−/− mice. Histological analysis also revealed that there was no difference in liver pathology between the two strains under control conditions. After twenty four hours following treatment with LPS, the livers from wild type mice had a substantial increase in liver injury (Figure 3D). Interestingly, this increase in pathology was not observed in livers from FABP5−/− mice treated with LPS. These data are consistent with histological measures of liver injury, suggesting that FABP5 plays an important role in the hepatic injury response to LPS. Since it was shown in the experiments above that FABP5 is found primarily in the macrophage, the numbers of macrophages that accumulated in the liver following LPS exposure were measured by immunohistochemistry using F4/80, a marker of mature macrophages (Figure 4A); Quantitative histological analysis determined by percent stained area of F4/80 and show a significant increase in F4/80+ cells in FABP5−/− livers treated with LPS after 9 and 24 hours compared to similarly treated wild type mice (Figure 4B). Further assessment of the immune cell population, specifically neutrophils, was conducted using myeloperoxidase (MPO) staining. Twenty four hours post LPS exposure, wild type livers show an increase in neutrophil infiltration. Interestingly, this increase in MPO+ cells is not seen in the FABP5−/− livers (Figure 5A) as quantified in Figure 5B. This data combined with cytokine data further suggests that the blunted liver injury seen in the FABP5−/− livers is not due to neutrophils, however more likely, a specific macrophage phenotype.
Figure 3. Assessment of wild type and FABP5−/− mice.
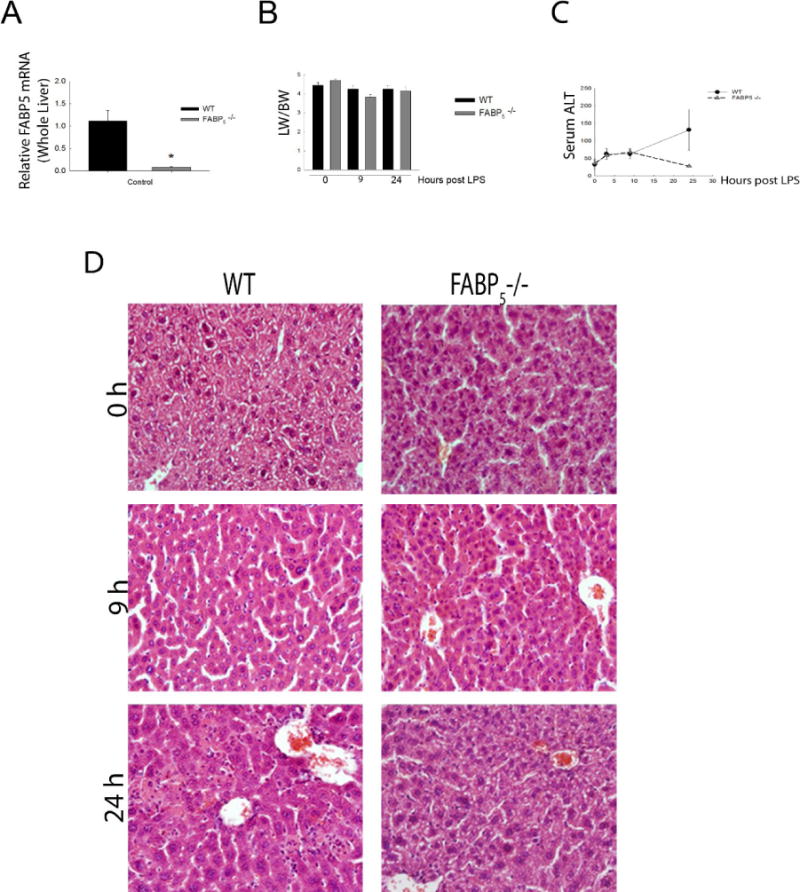
A: Control whole liver FABP5 mRNA expression was analyzed in WT and FABP5−/− mice via quantitative PCR and normalized to the housekeeping gene 18S rRNA. B: Initial body weights were recorded and again recorded post LPS. LW/BW ratios are from control (saline), or 9 and 24 hours post LPS in WT and FABP5−/− mice. C: Serum ALT levels were measured in C57bl/6J and FABP5−/− mice treated with 0, 3, 9, or 24 hours LPS. Values are expressed as means ± SE. ≥4 animals per group. D: Immunohistochemical staining for H&E on C57Bl/6 and FABP5−/− livers treated with LPS for 0, 9, or 24 hours. Magnification 20×.
Figure 4. Increased infiltration of macrophages in FABP5−/− mice versus wildtype.
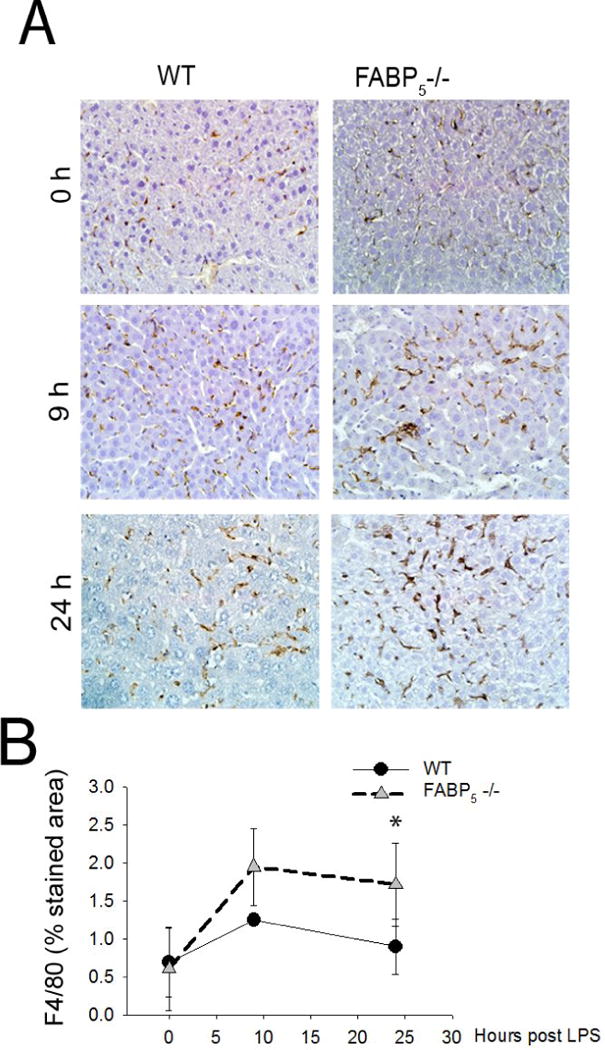
Measurement of F4/80+ cells in liver of C57Bl/6 and FABP5−/− mice treated 0, 9, or 24 hours with LPS. A: Immunohistochemical analysis of the F4/80+ cells. Magnification 20×. B: Percent stained area was determined by image J analysis in three separate measurements.
Figure 5. Neutrophil infiltration blunted in FABP5−/− liver.
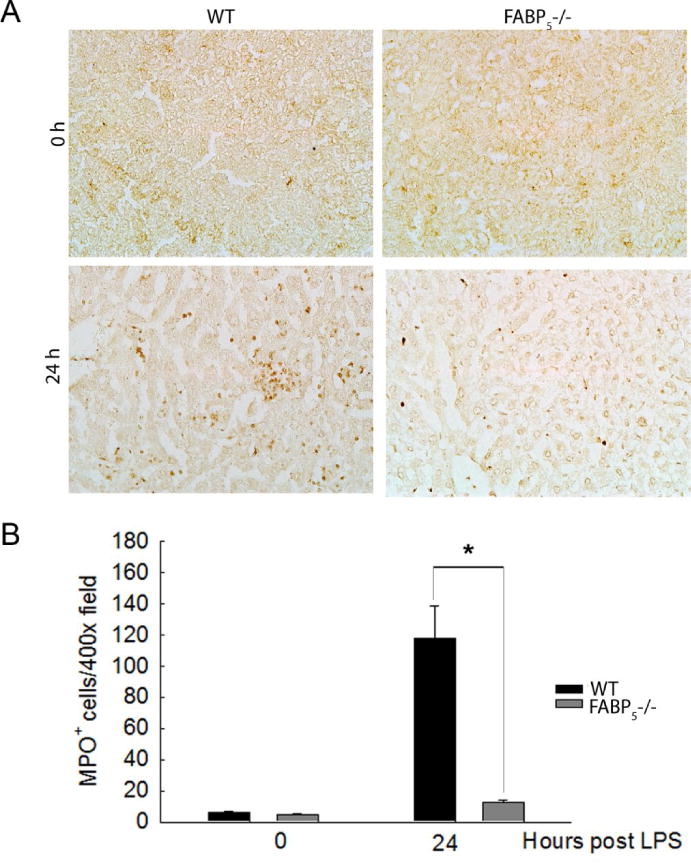
A: Immunohisochemical staining for MPO in C57Bl/6 and FABP5−/− liver treated for 0 or 24 hours with LPS. Magnification 40×. B: The numbers of MPO+ stained cells of the four groups.
3.3. Pro-inflammatory and anti-inflammatory associated macrophage markers in whole liver LPS time course
To further study the paradox of less liver injury yet increased macrophage infiltration in FABP5−/− mice, whole liver mRNA expression of pro- and anti-inflammatory related genes were evaluated. Wild type and FABP5−/− mice were treated with control or LPS for 0, 3, 9, or 24 hours and liver samples were collected immediately after sacrifice as described in Methods. Quantitative PCR on whole liver mRNA revealed that the pro-inflammatory cytokines TNF-α, iNOS, IL-12, IL-6, and CCL-2 are increased in both strains 3 hours post LPS with their expression decreasing thereafter (Figure 6A). Whole liver mRNA expression of increased iNOS and IL-6 were statistically significant in FABP5−/− mice after 3 hours exposure to LPS as well as IL-12 and CCL-2 9 hours post LPS exposure. TNF-α was the only M1 marker statistically different after 24 hours of LPS exposure. Anti-inflammatory cytokines TGF-β, YM-1, Fizz-1, Arginase, IL-10, IRF-4, and CCL-17 were all increased at either 9 and/or 24 hours post LPS in wild type animals however TGF-β, Arginase, and CCL-17 expression levels had statistically significant increases seen as early as 3 hours post LPS exposure in FABP5−/− compared to wild type mice (Figure 6B). CD-54 (ICAM-1) and CD-14 mRNA levels were also increased in FABP5−/− (data not shown). Thus, FABP5 appears to suppress the anti-inflammatory M2 response within the LPS exposed liver.
Figure 6. LPS time course and related M1/M2 gene expression in whole liver.
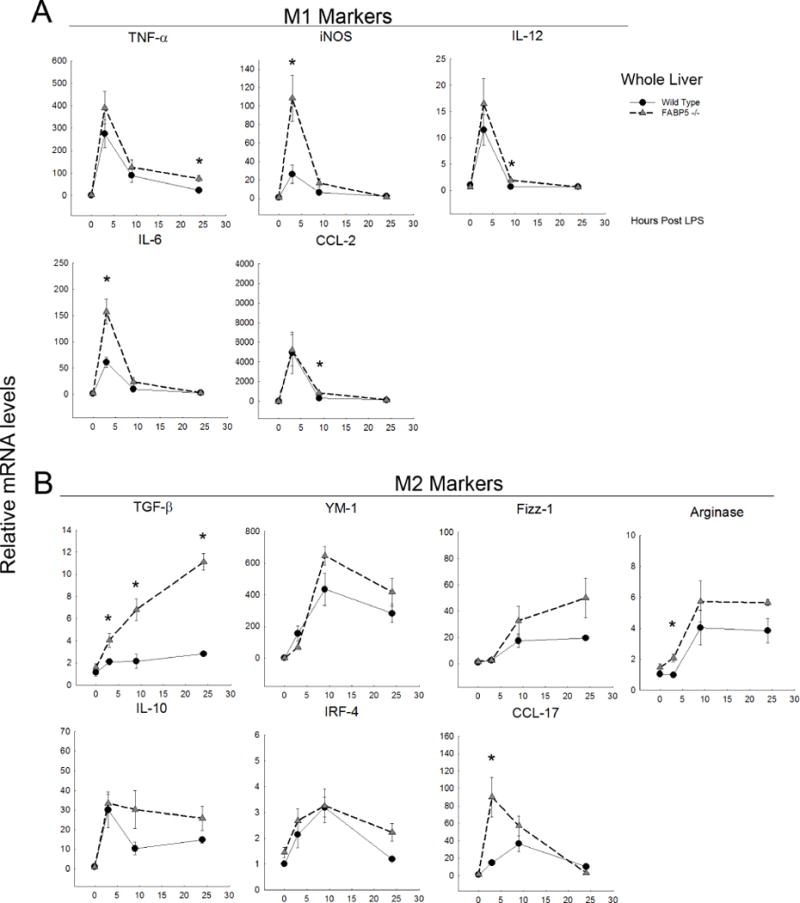
Relative mRNA levels of cytokines in wild type and FABP5−/− whole liver treated with LPS for 0, 3, 9, or 24 hours. Cytokine expression was analyzed by real-time PCR and normalized to the housekeeping gene 18S rRNA. Data are expressed as means ± SE. A: M1-associated markers. B: M2-associated markers.
3.1. Isolated liver macrophages exhibit parallel mRNA expression profiles seen in whole liver
In addition to the whole liver pro-inflammatory and anti-inflammatory mRNA expression profile assessed above, liver macrophages (Kupffer cells) were isolated from wildtype and FABP5−/− mice exposed to saline as controls or LPS for 3 hours. This experiment was performed in order to determine if the macrophage population was responsible for the expression profile seen in whole liver experiments. As hypothesized, relative mRNA levels of M1(Figure 7A) and M2 (Figure 7B) markers from isolated macrophages were increased 3 hours after LPS in both strains with TGF-β being the only marker that was statistically increased in the FABP5−/− macrophages. Similar profiles were seen between the whole liver and isolated macrophage experiments which suggest that the macrophages present in the liver at the 3 hour time point are responsible for the expression profile seen in whole liver.
Figure 7. Isolated liver macrophages express an M1/M2 gene expression profile similar to whole liver.
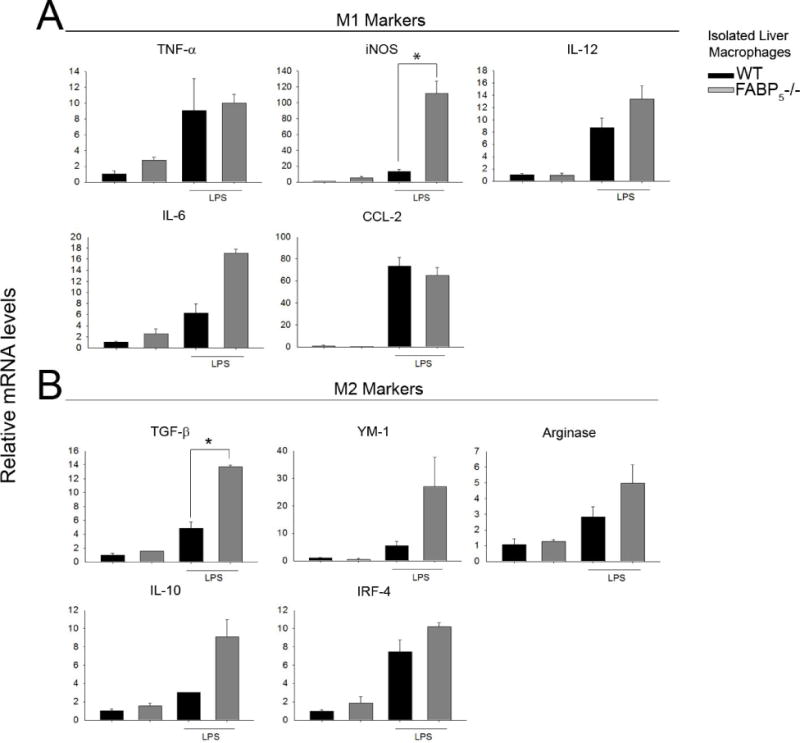
Wild type and FABP5−/− mice were exposed to LPS for 3 hours as described in methods section 2.2. Isolated liver macrophages from control (saline) and LPS treated mice were collected in Trizol and gene expression was analyzed by qPCR. Cytokine expression was normalized to the housekeeping gene 18S rRNA. Data are expressed as means ± SE. A: M1-associated markers. B: M2-associated markers.
3.2. FABP5 inhibits the anti-inflammatory response in bone marrow derived macrophages
The phenotypic shift toward an anti-inflammatory profile seen in the FABP5−/− whole liver study as well as seen in isolated liver macrophages provoked further investigation of the effect of FABP5 on macrophage phenotype development. To study the macrophage response and further investigate the anti-inflammatory macrophage phenotype, bone marrow derived macrophages (BMDMs) were isolated from wildtype and FABP5−/− mice and challenged with M1 (LPS+IFN-γ) or M2 (IL-4) polarizing conditions as previously described. Pro-inflammatory cytokines TNFα, iNOS, IL12, and IL6 were increased in both strains after 4 hours when treated with M1 stimulating LPS+IFN-γ. TNF-α, IL-12 and IL-6 were statistically higher in FABP5−/− as well as CCL-2 following 24 hours post M1 stimulus (Figure 8A). As expected, after 24 hour stimulation with IL-4, anti-inflammatory cytokines TGF-β, YM-1, Fizz-1, Arginase, IL-10, and IRF-4 were all significantly increased. Importantly, absence of FABP5 further elevated this response in BMDMs compared to the WT response (Figure 8 B). This data suggests that FABP5 not only plays a role in the macrophage phenotype but specifically, loss of FABP5 promotes a stronger M2 phenotype able to limit or alter hepatic pathology.
Figure 8. Impact of polarization on gene expression in BMDMs.
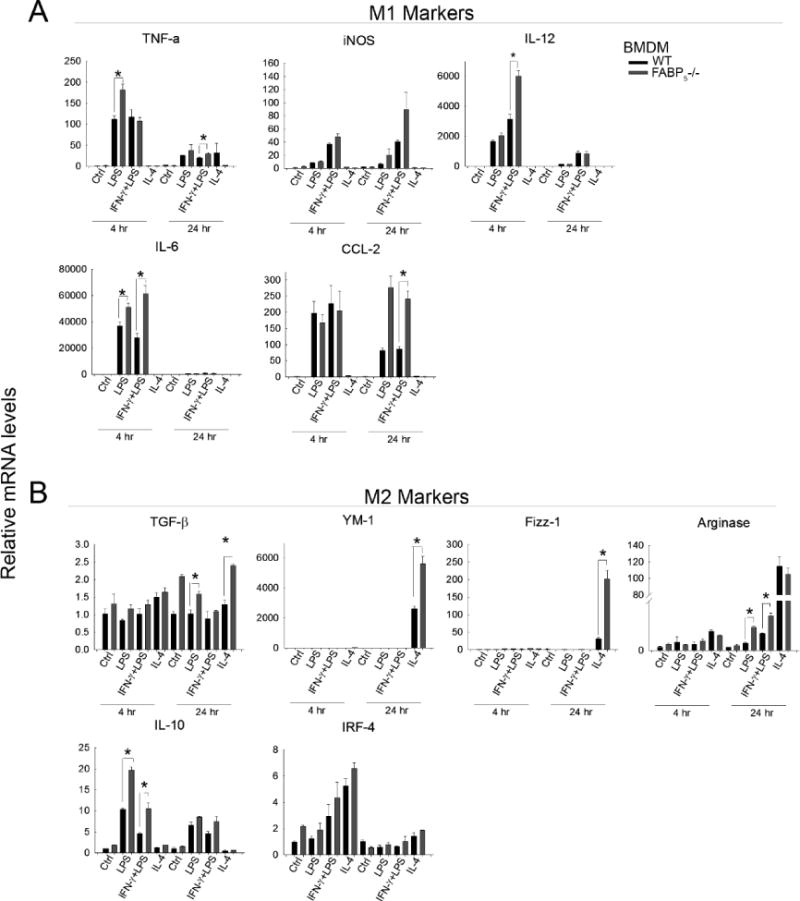
Wild type and FABP5−/− bone marrow derived macrophages (BMDMs) treated with LPS, IFN-γ +LPS (M1 stimulus), or IL-4 (M2 stimulus) for 4 or 24 hours as described in methods. mRNA was harvested from cells and gene expression was analyzed quantitatively using qPCR and normalized to the housekeeping gene 18S rRNA. Data are expressed as means ± SE. A: M1-associated markers. B: M2-associated markers
4. DISCUSSION
It has been reported that FABPs play central roles in regulating metabolic and inflammatory pathways in various metabolic and autoimmune diseases (1, 2); however their role in liver disease as well as in macrophage polarization has not been fully assessed. There is commonality between metabolic regulators in adipocytes and macrophages as both cell types express cytokines, chemokines, nuclear hormone receptors (i.e. Peroxisome proliferator-activated receptors, PPAR; liver X receptor, LXRs) (12), and many other factors including fatty acid-binding proteins. FABPs are a small family of 14–15 kDa, abundantly expressed cytoplasmic proteins that transport hydrophobic ligands such as long chain fatty acids, eicosanoids, and other lipids to specific cellular compartments based on the cellular needs of the cell. In addition to this function, FABPs are uniquely expressed in a cell restricted manner. From the nine known isoforms in the FABP family, FABP4 (FABP-A) and FABP5 (FABP-E) are the only known isoforms co-expressed in adipocytes and in macrophages (13) and thus, are potentially important for understanding innate immune cell function. Among the roles of fatty acids including energy and membrane structure, they are also important signaling molecules in differentiation and development thus, FABPs, or more specifically FABP5, is of particular interest in studying the balance of M1 and M2 macrophages during hepatic injury. The focus of this paper was on the role of FABP5 in the hepatic macrophage. Major findings of this paper include the co-localization of F4/80 and FABP5 as well as the increase in FABP5 expression in mice exposed to endotoxin, consistent with the increase of F4/80+ macrophages in livers exposed to the same conditions. We also demonstrate a role of FABP5 in regulating macrophage function. Further, deletion of FABP5 protects against LPS induced liver injury and favors an anti-inflammatory response. Taken together, these data support the hypothesis that FABP5 is largely expressed in the macrophage and suggests that FABP5 is a major regulator of the pro-inflammatory response.
The combination of inflammation with dyslipidemia exacerbates the progression of fatty liver disease (14). Here it is hypothesized that FABP5 limits the anti-inflammatory response in the context of acute liver injury. Milner et al. demonstrated elevated levels of FABP4 in nonalcoholic fatty liver disease and that this increase was a predictor of increasing inflammation and fibrosis (15). Furthermore, Li demonstrated that FABPs are important in immune cell regulation by finding that FABP5 regulates T-cell subset differentiation via influencing both transcriptional and metabolic programs that control T cell differentiation and effector functions (16). It is possible that FABP5 may also be playing a similar role in macrophage differentiation. Here it is demonstrated that FABP5 does play a role in the inflammatory process associated with liver pathologies, specifically in regulating the macrophage M1 and M2 cytokine response. This paper further demonstrates that FABP5 is important for macrophage response in vitro. The deletion of FABP5 significantly changed several macrophage associated cytokines and also decreased the level of LPS induced liver injury indicated by lower serum ALT levels and less necrosis. The key observation of this work was that early pro-inflammatory cytokine expression was not significantly different between wild type and FABP5 knockout mice however the anti-inflammatory response was significantly higher in FABP5 knockouts during in vivo and in vitro studies in combination with an increase in F4/80+ cells. It is unclear whether the abnormal increase in F4/80+ cells seen in the FABP5−/− livers are proliferating within the liver or are macrophages recruited to the liver. Further investigation on macrophage biology is indeed needed on this subject. However, evidence suggests that these macrophages may suppress injury by exerting an anti-inflammatory phenotype and further explaining why there may be less injury in these livers with FABP5 deleted. We speculate that the increase of F4/80 macrophages in the injured liver is of the M2 population and it is this shift toward a M2 macrophage phenotype that protects the livers of FABP5−/− endotoxin treated mice. While we cannot rule out the possibility of other cell types participating in the overall anti-inflammatory response of the hepatic macrophage of FABP5−/− mice, we do show that FABP5 is highly expressed in our isolated liver F4/80+ macrophages. This data is similar with other work demonstrating FABP5−/− mice infected with influenza A virus had increased macrophage infiltration in lung compared with WT mice however FABP5−/− lung tissues displayed more damage compared to WT tissue yet the lung injury observed by the virus may be linked to the presence of neutrophils also increased in FABP5−/− (17). This study along with our current data suggests that the increased number of macrophages seen in FABP5−/− livers may actually contribute to the protection of these tissues and further suggests that FABP5 is involved in macrophage function or recruitment in more than one tissue. Interestingly, the absence of neutrophils in LPS treated FABP5−/− livers compared to the dramatic increase in LPS treated wild type livers may be a major finding in determining how FABP5 functions in the role of liver disease since an important aspect of hepatic inflammation involves the infiltration of neutrophils (18). While WT and FABP5−/− livers have very little to no neutrophils present in control conditions, the lack of infiltrating neutrophils post LPS of FABP5−/− livers is of interest. During an acute inflammatory response to LPS in the liver, the migration of polymorphonuclear neutrophils (PMNs) is controlled by several factors including pro-inflammatory mediators (i.e. cytokines and chemokines), with the largest source of these factors derived from liver macrophages (19) supporting the idea that the influx of neutrophils is secondary to the pro-inflammatory response of macrophages. In addition, depletion of macrophages by gadolinium chloride (GdCl3) or clodronate prevents endotoxin induced liver injury as well as neutrophil influx (20, 21), supporting the hypothesis that neutrophil participation is subsequent to the macrophage response. In the current study, it is considered that the lack of neutrophils in FABP5−/− livers is due to the disturbance in the fatty acid binding protein resulting in an improper balance of pro-inflammatory and anti-inflammatory cytokines and thus, neutrophils are not attracted to the liver by appropriate chemotactic factors.
This work demonstrates that the deletion of FABP5 attenuates LPS induced hepatic injury, despite the paradoxical observation of increased F4/80+ macrophages and cytokine profiling. The conclusion is that the anti-inflammatory response seen by increased M2 macrophage profiling is responsible for decreased liver injury seen in the FABP5−/− mice indicating that M1 and M2 polarization might directly influence the outcome in hepatic injury. FABPs are proposed to maintain control of lipid balance in inflammatory cells (e.g. macrophages) and in metabolic cells (e.g. adipocytes) through lipid sensitive targets linked to inflammatory signaling such as nuclear factor kappa B (NFκB), PPARγ, and LXR-α (22) In fact, obesity is associated with altered immune cell function, including increased monocyte phagocytosis and increased nuclear binding of NFκB in mononuclear cells (23). Additionally, hyperlipidemia in mice activates an inflammatory response by the same signaling pathways through which LPS activates the innate immune response (24).
Homeostasis of macrophage phenotypes are a key component in inflammation (25, 26) and are essential mediators between inflammation and disease. The deletion of an FABP5, a key regulator of cell metabolism, is hypothesized here to have changed the homeostatic role of the alternative macrophage and its metabolic activity related to liver pathologies by producing an elevated level of M2 associated cytokines and genes.
This is a significant contribution since FAPB5 is at the interface between lipid metabolism and inflammatory response. In summary, this work shows for the first time an important role of fatty acid-binding protein 5 in the hepatic inflammatory response after endotoxin exposure in the mouse. Loss of FABP5 results in increased levels of anti-inflammatory (M2) cytokines in whole liver, isolated liver macrophages, as well as in bone marrow derived macrophages. Together, these data demonstrate that FABP5 is a regulator in macrophage plasticity and may in part, play a larger role in the pathogenesis of liver disease.
Supplementary Material
Highlights.
FABP5 has a role in the hepatic inflammatory response after LPS
Loss of FABP5 enhances F4/80+ macrophage recruitment to the liver
Loss of FABP5 inhibits hepatic MPO neutrophil recruitment with limited liver injury
Loss of FABP5 results in increased levels of anti-inflammatory cytokines
FABP5 is a regulator of macrophage phenotype
Acknowledgments
This work was supported, in part, by grants from NIAAA (AA019559) FABP5−/− mice were the kind gift from David Borhlohr, University of Minnesota
Abbreviations
- FABP
Fatty acid binding protein
- WT
Wild type
- KO
Knockout
- IL-10
Interleukin 10
- YM-1
mouse macrophage secretory glycoprotein
- Fizz-1
found in inflammatory zone-1
- LPS
Lipopolysaccharide
- IFN-γ
interferon gamma
- IL-4
interleukin 4
- M1
pro-inflammatory
- M2
anti-inflammatory
- TNF-α
tumor necrosis factor alpha
- IL-12
interleukin 12
- IL-6
interleukin 6
- TGF-β
transforming growth factor beta
- IL-13
interleukin 13
- ALT
alanine transaminase
- BMDM
bone marrow derived macrophages
- Hp
hepatocytes
- HSC
hepatic stellate cells
- TC
t-cells
- KC
Kupffer cells
- iNOS
inducible nitric oxide
Footnotes
Publisher's Disclaimer: This is a PDF file of an unedited manuscript that has been accepted for publication. As a service to our customers we are providing this early version of the manuscript. The manuscript will undergo copyediting, typesetting, and review of the resulting proof before it is published in its final citable form. Please note that during the production process errors may be discovered which could affect the content, and all legal disclaimers that apply to the journal pertain.
Competing interests
The authors declare that they have no competing interests.
Authors’ contributions
All authors have contributed to this work. M.D.W. was principal investigator and designed research; M.D.W., I.N.H., S.M.M., V.V.H., and L.R.M. conducted research; S.M.M. analyzed data and wrote the paper. M.D.W. had primary responsibility for final content. All authors read and approved the final manuscript.
Supplemental figure: isolated hepatic macrophages in culture
Contributor Information
Sherri M. Moore, Email: Mooresh06@students.ecu.edu.
Vivian V. Holt, Email: Holtv14@students.ecu.edu.
Lillie R. Malpass, Email: Malpassl14@students.ecu.edu.
Ian N. Hines, Email: Hines1@ecu.edu.
Michael D. Wheeler, Email: Wheelerm@ecu.edu.
References
- 1.Furuhashi M, Tuncman G, Gorgun CZ, Makowski L, Atsumi G, Vaillancourt E, et al. Treatment of diabetes and atherosclerosis by inhibiting fatty-acid-binding protein aP2. Nature. 2007 Jun 21;447(7147):959–65. doi: 10.1038/nature05844. [DOI] [PMC free article] [PubMed] [Google Scholar]
- 2.Maeda K, Cao H, Kono K, Gorgun CZ, Furuhashi M, Uysal KT, et al. Adipocyte/macrophage fatty acid binding proteins control integrated metabolic responses in obesity and diabetes. Cell Metab. 2005 Feb;1(2):107–19. doi: 10.1016/j.cmet.2004.12.008. [DOI] [PubMed] [Google Scholar]
- 3.Martinez FO, Sica A, Mantovani A, Locati M. Macrophage activation and polarization. Front Biosci. 2008 Jan 1;13:453–61. doi: 10.2741/2692. [DOI] [PubMed] [Google Scholar]
- 4.Ambarus CA, Krausz S, van Eijk M, Hamann J, Radstake TR, Reedquist KA, et al. Systematic validation of specific phenotypic markers for in vitro polarized human macrophages. J Immunol Methods. 2012 Jan 31;375(1–2):196–206. doi: 10.1016/j.jim.2011.10.013. [DOI] [PubMed] [Google Scholar]
- 5.Mia S, Warnecke A, Zhang XM, Malmstrom V, Harris RA. An optimized protocol for human M2 macrophages using M-CSF and IL-4/IL-10/TGF-beta yields a dominant immunosuppressive phenotype. Scand J Immunol. 2014 May;79(5):305–14. doi: 10.1111/sji.12162. [DOI] [PMC free article] [PubMed] [Google Scholar]
- 6.Kremer M, Thomas E, Milton RJ, Perry AW, van Rooijen N, Wheeler MD, et al. Kupffer cell and interleukin-12-dependent loss of natural killer T cells in hepatosteatosis. Hepatology. 2010 Jan;51(1):130–41. doi: 10.1002/hep.23292. [DOI] [PMC free article] [PubMed] [Google Scholar]
- 7.Kremer M, Hines IN, Milton RJ, Wheeler MD. Favored T helper 1 response in a mouse model of hepatosteatosis is associated with enhanced T cell-mediated hepatitis. Hepatology. 2006 Jul;44(1):216–27. doi: 10.1002/hep.21221. [DOI] [PubMed] [Google Scholar]
- 8.Son G, Hines IN, Lindquist J, Schrum LW, Rippe RA. Inhibition of phosphatidylinositol 3-kinase signaling in hepatic stellate cells blocks the progression of hepatic fibrosis. Hepatology. 2009 Nov;50(5):1512–23. doi: 10.1002/hep.23186. [DOI] [PMC free article] [PubMed] [Google Scholar]
- 9.Smedsrod B, Pertoft H. Preparation of pure hepatocytes and reticuloendothelial cells in high yield from a single rat liver by means of Percoll centrifugation and selective adherence. J Leukoc Biol. 1985 Aug;38(2):213–30. doi: 10.1002/jlb.38.2.213. [DOI] [PubMed] [Google Scholar]
- 10.Li Z, Soloski MJ, Diehl AM. Dietary factors alter hepatic innate immune system in mice with nonalcoholic fatty liver disease. Hepatology. 2005 Oct;42(4):880–5. doi: 10.1002/hep.20826. [DOI] [PubMed] [Google Scholar]
- 11.Rolph MS, Young TR, Shum BO, Gorgun CZ, Schmitz-Peiffer C, Ramshaw IA, et al. Regulation of dendritic cell function and T cell priming by the fatty acid-binding protein AP2. J Immunol. 2006 Dec 1;177(11):7794–801. doi: 10.4049/jimmunol.177.11.7794. [DOI] [PubMed] [Google Scholar]
- 12.Lu B, Moser AH, Shigenaga JK, Feingold KR, Grunfeld C. Type II nuclear hormone receptors, coactivator, and target gene repression in adipose tissue in the acute-phase response. J Lipid Res. 2006 Oct;47(10):2179–90. doi: 10.1194/jlr.M500540-JLR200. [DOI] [PubMed] [Google Scholar]
- 13.Maeda K, Uysal KT, Makowski L, Gorgun CZ, Atsumi G, Parker RA, et al. Role of the fatty acid binding protein mal1 in obesity and insulin resistance. Diabetes. 2003 Feb;52(2):300–7. doi: 10.2337/diabetes.52.2.300. [DOI] [PMC free article] [PubMed] [Google Scholar]
- 14.Lalor PF, Faint J, Aarbodem Y, Hubscher SG, Adams DH. The role of cytokines and chemokines in the development of steatohepatitis. Semin Liver Dis. 2007 May;27(2):173–93. doi: 10.1055/s-2007-979470. [DOI] [PubMed] [Google Scholar]
- 15.Milner KL, van der Poorten D, Xu A, Bugianesi E, Kench JG, Lam KS, et al. Adipocyte fatty acid binding protein levels relate to inflammation and fibrosis in nonalcoholic fatty liver disease. Hepatology. 2009 Jun;49(6):1926–34. doi: 10.1002/hep.22896. [DOI] [PubMed] [Google Scholar]
- 16.Zhang Y, Sun Y, Rao E, Yan F, Li Q, Zhang Y, et al. Fatty acid-binding protein E-FABP restricts tumor growth by promoting IFN-beta responses in tumor-associated macrophages. Cancer Res. 2014 Jun 1;74(11):2986–98. doi: 10.1158/0008-5472.CAN-13-2689. [DOI] [PMC free article] [PubMed] [Google Scholar]
- 17.Gally F, Kosmider B, Weaver MR, Pate KM, Hartshorn KL, Oberley-Deegan RE. FABP5 deficiency enhances susceptibility to H1N1 influenza A virus-induced lung inflammation. Am J Physiol Lung Cell Mol Physiol. 2013 Jul 1;305(1):L64–72. doi: 10.1152/ajplung.00276.2012. [DOI] [PMC free article] [PubMed] [Google Scholar]
- 18.Gujral JS, Farhood A, Bajt ML, Jaeschke H. Neutrophils aggravate acute liver injury during obstructive cholestasis in bile duct-ligated mice. Hepatology. 2003 Aug;38(2):355–63. doi: 10.1053/jhep.2003.50341. [DOI] [PubMed] [Google Scholar]
- 19.Bautista AP. Neutrophilic infiltration in alcoholic hepatitis. Alcohol. 2002 May;27(1):17–21. doi: 10.1016/s0741-8329(02)00206-9. [DOI] [PubMed] [Google Scholar]
- 20.Hisama N, Yamaguchi Y, Ishiko T, Miyanari N, Ichiguchi O, Goto M, et al. Kupffer cell production of cytokine-induced neutrophil chemoattractant following ischemia/reperfusion injury in rats. Hepatology. 1996 Nov;24(5):1193–8. doi: 10.1053/jhep.1996.v24.pm0008903397. [DOI] [PubMed] [Google Scholar]
- 21.Knudsen E, Benestad HB, Seierstad T, Iversen PO. Macrophages in spleen and liver direct the migration pattern of rat neutrophils during inflammation. Eur J Haematol. 2004 Aug;73(2):109–22. doi: 10.1111/j.1600-0609.2004.00263.x. [DOI] [PubMed] [Google Scholar]
- 22.Furuhashi M, Hotamisligil GS. Fatty acid-binding proteins: role in metabolic diseases and potential as drug targets. Nat Rev Drug Discov. 2008 Jun;7(6):489–503. doi: 10.1038/nrd2589. [DOI] [PMC free article] [PubMed] [Google Scholar]
- 23.Nieman DC, Henson DA, Nehlsen-Cannarella SL, Ekkens M, Utter AC, Butterworth DE, et al. Influence of obesity on immune function. J Am Diet Assoc. 1999 Mar;99(3):294–9. doi: 10.1016/S0002-8223(99)00077-2. [DOI] [PubMed] [Google Scholar]
- 24.Bjorkbacka H, Kunjathoor VV, Moore KJ, Koehn S, Ordija CM, Lee MA, et al. Reduced atherosclerosis in MyD88-null mice links elevated serum cholesterol levels to activation of innate immunity signaling pathways. Nat Med. 2004 Apr;10(4):416–21. doi: 10.1038/nm1008. [DOI] [PubMed] [Google Scholar]
- 25.Yona S, Kim KW, Wolf Y, Mildner A, Varol D, Breker M, et al. Fate mapping reveals origins and dynamics of monocytes and tissue macrophages under homeostasis. Immunity. 2013 Jan 24;38(1):79–91. doi: 10.1016/j.immuni.2012.12.001. [DOI] [PMC free article] [PubMed] [Google Scholar]
- 26.Liu K, Victora GD, Schwickert TA, Guermonprez P, Meredith MM, Yao K, et al. In vivo analysis of dendritic cell development and homeostasis. Science. 2009 Apr 17;324(5925):392–7. doi: 10.1126/science.1170540. [DOI] [PMC free article] [PubMed] [Google Scholar]
Associated Data
This section collects any data citations, data availability statements, or supplementary materials included in this article.


