

Abstract
Autism Spectrum Disorder (ASD) is a neurodevelopmental condition with a clear, but heterogeneous, genetic component. Germline mutations in the tumor suppressor PTEN are a well-established risk factor for ASD with macrocephaly, and conditional Pten mouse models have impaired social behavior and brain development. Some mutations observed in patients disrupt the normally balanced nuclear-cytoplasmic localization of the PTEN protein, and we developed the Ptenm3m4 model to study the effects of a cytoplasm-predominant Pten. In this model, germline mislocalization of Pten causes inappropriate social behavior with intact learning and memory, a profile reminiscent of high-functioning ASD. These animals also exhibit histological evidence of neuroinflammation and expansion of glial populations by six-weeks of age. We hypothesized that the neural transcriptome of this model would be altered in a manner that could inform human idiopathic ASD, a constitutional condition. Using total RNA-sequencing, we found progressive disruption of neural gene expression in Ptenm3m4 mice from two- to six-weeks of age, involving both immune and synaptic pathways. These alterations include downregulation of many highly co-expressed human-ASD-susceptibility genes. Comparison to a human cortical development coexpression network revealed that genes disrupted in Ptenm3m4 mice were enriched in the same areas as those of human ASD. While PTEN-related ASD is relatively uncommon, our observations suggest that the Ptenm3m4 model recapitulates multiple molecular features of human-ASD, and that Pten operates far upstream of common pathways within ASD pathogenesis.
Introduction
Autism Spectrum Disorder (ASD) is a highly heritable neurodevelopmental condition, characterized by deficits in social communication and restricted, repetitive behaviors1, 2. Genetic studies of non-syndromic ASD over the last 15 years have identified hundreds of rare genetic variants that may increase susceptibility, many identified only in single reports3–7. By contrast, multiple genetic syndromes include high rates of ASD in addition to other phenotypes such as epilepsy (Tuberous Sclerosis, 40%), motor dysfunction (Rett Syndrome, 25–40%) or cancer (PTEN Hamartoma Tumor Syndrome, PHTS, 23%)8, 9. Germline genetic alterations, including rare variants and Mendelian genetic syndromes with high rates of ASD, provide an etiology for approximately 20% of all cases of ASD10. PHTS and other syndromic causes of ASD are powerful avenues for reducing the heterogeneity of the human disorder in order to focus on its common etiologies. Mouse models based on clinically relevant genetic alterations, with overt symptom overlap, are among the best available mechanisms for realizing this potential.
Several studies indicate that germline PTEN mutations occur in up to 10% of children with ASD and macrocephaly. The lifetime risks for multiple cancers in PHTS make genetic testing for PTEN mutations crucial within the macrocephalic subgroup of ASD, which represents up to 20% of all ASD cases11–13. We recently described a new mouse model of Pten dysfunction based on germline missense mutations that disrupt the intracellular localization of the protein, shifting its normally even distribution toward cytoplasm predominance14, 15. Germline mutations that shift protein localization have been reported in PHTS patients, such as the nuclear-predominant K62R mutation and the cytoplasm-predominant K289E mutation. Mice homozygous for the Ptenm3m4 mutation display social behavior and balance abnormalities without deficits in learning or memory, a profile reminiscent of children with high-functioning ASD. At the cellular level, the mice exhibit increased glial production and significant neuroinflammation by six weeks old15.
As the Ptenm3m4 mouse shows promising cellular and behavioral phenotypes relevant to idiopathic human ASD as well as those associated with PHTS, our goal was to identify the effects of this mutation on the neural transcriptome. RNA-sequencing of the brain at both two- and six-weeks of age allowed us to measure the development of genome-wide transcriptional changes in an unbiased fashion with high sensitivity. We hypothesized that germline disruption of this ASD-susceptibility gene could provoke neural gene expression changes reflective of the broader idiopathic ASD transcriptome, suggesting that PTEN may operate high up above many signaling pathways relevant to human ASD.
Methods
Animals and experimental design
The Ptenm3m4 model is based on germline mutations to the 3rd and 4th localization sequences of the mouse Pten gene. Pten protein Mislocalization and expression were previously confirmed in brain tissue lysates and cultured neurospheres15. Male wild-type, Ptenwt/m3m4, and Ptenm3m4/m3m4 mice on the CD-1 genetic background were generated via heterozygous crossings and aged until two or six-weeks old. The 2-week old cohort was taken from a single litter, while the 6-week old cohort represented 2 separate litters. Three animals per genotype and age were used as biological replicates, as we estimated that this would provide reasonable power to detect large expression changes when combined with sequencing of approximately 66 million reads per sample (Supplemental Table 1). We found that at n = 3 and 0.1 coefficient of variance (determined using R package CummeRbund), we could detect fold differences of 1.97 at a power of 0.8 (Bioconductor package RNASeqPower). No randomization was used to select animals for each group, and investigators were not blinded to genotype. Animals were sacrificed by CO2 asphyxiation followed by cervical dislocation (two-week cohort), or exsanguination with phosphate buffered saline (six-week cohort). Single hemispheres (two weeks) and microdissected cortices (six weeks) were flash frozen immediately following sacrifice.. All procedures carried out were approved by the Cleveland Clinic Institutional Animal Care and Use Committee. The RNA-sequencing data is available through the NCBI Gene Expression Omnibus, using accession number GSE59318.
Tissue preparation and RNA isolation
Flash frozen tissues were homogenized in 1 ml Trizol (Life Technologies, Carlsbad, CA) using 5 mm stainless steel beads for two minutes at 25 Hz with a TissueLyserII (Qiagen, Valencia, CA). Total RNA was isolated using Trizol according to the manufacturer’s protocol. Ambion PureLink RNA Mini Kit (Life Technologies, Carlsbad, CA) was utilized for RNA Clean-Up and DNase. In short, 15 ug total RNA mixed with lysis buffer:ethanol (1:3) was applied to the column and rinsed with Wash Buffer II (70% ethanol). DNA was digested on column for 15 minutes with PureLink DNase (Life Technologies, Carlsbad, CA) and RNA was rinsed twice with Wash Buffer II (70% ethanol). RNA quality was assessed via Bioanalyzer, and 5 ug DNased-RNA was shipped to Genome Quebec for library prep and sequencing.
Library preparation and RNA sequencing
Sequencing libraries were prepared using the Illumina TruSeq Stranded Total RNA with Ribo Zero kit (Illumina, San Diego, CA). The libraries were multiplexed three to a lane, grouped in biological triplicates. 100 base pair, paired-end sequencing was performed using the Illumina HiSeq platform.
Read mapping and quantification of gene expression
Sequencing reads were aligned to the mouse mm10 reference genome using Tophat (versions 2.0.8-2.0.11)/Bowtie (versions 2.0.2-2.2.0), and assembled into RNA transcripts using the Cufflinks package (versions 2.0.2-2.2.0)16, 17. Following calculation of FPKM values (fragments per kilobase of exon model per million mapped fragments), we calculated differential expression using Cuffdiff 2 (versions 2.0.2-2.2.0). Following predetermined contrasts, we calculated differential expression by comparing wild-type FPKM values to those of Ptenwt/m3m4 or Ptenm3m4/m3m4 mice individually for each age. Transcripts were considered differentially expressed at q < 0.05 following Benjamini-Hochberg multiple testing correction of the original p-values16. Multidimensional scaling was performed using the R-project package cummeRbund (version 2.4.1), while the correlation between differential expression levels at two- and six-weeks of age was calculated using the R-project package stats (version 3.0.2).
Pathway analysis and comparison with AutDB
Differentially expressed genes within each comparison group were analyzed using Ingenuity Pathway Analysis (Ingenuity® Systems, Redwood City, CA, www.ingenuity.com). AutDB is a manually curated public database of genes associated with Autism Spectrum Disorder (http://autism.mindspec.org/AutDB/HG_Home.do, accessed 6/20/2014)18. We used all genes listed in the database for comparison to differentially expressed genes in the Ptenm3m4 mouse by two-tailed Fisher’s exact test using the R-project package stats (version 3.0.2). The minimal distance network was based on the set of 69 genes within AutDB that were differentially expressed in at least one comparison group. Additional nodes (smaller font size) were introduced if they directly linked two AutDB genes (larger font size), and the network was generated using the R-project package igraph (version 0.7.1). Incorporation of differential expression data from the six-week old wild-type vs. Ptenm3m4/m3m4 comparison, and gene ontology analysis was performed using Cytoscape (version 3.3.1), and the plugin BiNGO (version 3.0.2).
Comparison to coexpression network from Parikshak, et al., 2013
The expression modules identified by Parikshak and colleagues were based on analysis of RNA-seq data from the Brainspan database of human neural gene expression from ages post-conception week eight through one year, using weighted gene coexpression network analysis19–21. Ptenm3m4 differentially expressed genes were first converted to their corresponding human orthologs using BioMart (accessed 3/4/14)22. Genes associated with each module were accessed via the original article’s supplemental information, available online (http://www.cell.com/cell/abstract/S0092-8674(13)01349-4, accessed 3/23/14), and compared to the differentially expressed genes identified in Ptenm3m4 mice using two-tailed Fisher’s exact test (R-project package stats, version 3.0.2).
Results
RNA-sequencing reveals progressive alteration in gene expression in Ptenm3m4 mice
We utilized RNA-sequencing to study the neural transcriptome of Ptenm3m4 mice across their development in an unbiased fashion. Total RNA was isolated from hemibrains at age two weeks, and from microdissected cortex at age six weeks – when this model demonstrates both social and neuroinflammatory phenotypes15. In mice, these ages represent an early juvenile stage and adolescence, respectively, periods in human development when ASD symptoms can be readily identified. At both ages, we compared samples from wild-type (Wt) mice with those from heterozygous (Ptenwt/m3m4) and homozygous (Ptenm3m4/m3m4) mice, using three biological replicates in each group (Figure 1a).
Figure 1.

The Ptenm3m4 mutation causes progressive and dose-dependent changes in neural gene expression. (a) Schematic of the experimental design. Drawings represent the differences in general size and shape of the brain between genotypes, while purple shading indicates the brain area used for RNA isolation. (b) Pten expression levels are unchanged from wild-type across genotypes and ages (t-tests, FDR corrected p-value > 0.05, n = 3 biological replicates per genotype and age). Error bars represent one standard error of the mean (s.e.m.). (c) Venn diagram illustrating the extent of overlap amongst the differentially expressed genes observed in each genotype at each age. (d) Multidimensional scaling shows separation of samples by age (M1), then by genotype (M2). (e) For genes that are differentially expressed at both two and six weeks, the log2(fold-change) in gene expression is correlated between ages (Pearson).
RNA-sequencing generated an average of 66 million paired-end reads per sample, an average of 89% mapping to the mouse mm10 genome (Supplemental Table 1). Pten was not differentially expressed in any of the comparison groups, as appropriate (Figure 1b)15. Using multidimensional scaling to reduce the variation between sample groups to a single point in two-dimensional space, wild-type and Ptenwt/m3m4 samples clustered tightly together within an age, but separated greatly between ages (Figure 1d). By contrast, the Ptenm3m4/m3m4 samples separated from the wild-type and Ptenwt/m3m4 samples at both ages. These genotypic and age differences seen were reflected in the total numbers of differentially expressed genes (false-discovery rate corrected p-value of < 0.05). By two weeks of age, there were 364 differentially expressed genes in the Ptenm3m4/m3m4 brain compared to wild-type (48 downregulated), and 181 for Ptenwt/m3m4 samples (53 downregulated. Compared to wild-type mice at six weeks of age, there were 1377 differentially expressed genes in the Ptenm3m4m3m4 cortex (484 downregulated), and only 75 for Ptenwt/m3m4 mice (28 downregulated). This is consistent with the much smaller extent of cellular and behavioral phenotypes seen in the Ptenwt/m3m4 animals15.
Three genes were differentially expressed across both genotypes at both ages, Fcrls (Fc receptor-like S, scavenger receptor), Agxt2l1 (ethanolamine phosphate phospholyase), and Egr2 (early growth response 2), although there were 152 genes differentially expressed in both the two-week and six-week Ptenm3m4/m3m4 samples compared to wild-type (Figure 1c). Within genes that were differentially expressed at both ages, the fold-changes in expression at each age were positively correlated for both genotypes, but only statistically significant in Ptenm3m4/m3m4 mice due to reduced overlap between ages for Ptenwt/m3m4 (Pearson’s, Ptenwt/m3m4 r = 0.67, p-value =0.21, Ptenm3m4/m3m4 r = 0.74, p-value = 2.2×10⁻¹⁶, Figure 1e).
Increasing alteration of ASD-linked pathways with age and dose of mutant Pten
We next questioned what biological functions were most associated with these differences in gene expression, and whether such disruptions became more apparent with time. As the Ptenm3m4/m3m4 animals display the greatest alterations in gene expression, we focused on differentially expressed genes in this genotype compared to wild-type animals of the same age. We used Ingenuity Pathway Analysis to determine the top canonical pathways implicated by genes that were either upregulated (Figure 2, purple bars) or downregulated (Figure 2, green bars) at two- and six-weeks. Within upregulated pathways, the significance of the overall pathway involvement increased between two- and six-weeks of age.
Figure 2.

By six weeks of age, canonical pathway alterations in Ptenm3m4/m3m4 cortex reflect those seen in transcriptome studies of human ASD. Canonical pathway analysis was performed using Ingenuity Pathway Analysis, the top 20 pathways implicated by upregulated genes are shown in purple (top), and those implicated by downregulated genes are shown in green (bottom). The axes indicate the significance of the pathway involvement, and lighter colored inset bars represent the pathway’s significance in the two-week old samples.
Several of the most upregulated canonical pathways involved inflammatory or immune processes such as IL-8 and NF-κB signaling, leukocyte extravasation, and dendritic cell maturation (Figure 2)15. The downregulated genes in Ptenm3m4/m3m4 cortex fell largely into pathways relating to synaptic activity (Figure 2)20. Specifically, both glutamate and serotonin receptor signaling pathways were downregulated, as well as calcium signaling and a multitude of g-protein coupled receptor pathways.
Many ASD susceptibility genes are downregulated in the Ptenm3m4 cortex
We compared the differentially expressed genes from each of the four comparison groups to ASD susceptibility genes reported in AutDB, a manually curated database of more than 500 genes considered associated with ASD via genetic or functional studies18. There was significant enrichment of AutDB genes within the differentially expressed genes of the Ptenm3m4/m3m4 cortex (Fisher’s exact test, OR = 1.59, p-value = 0.0013), with 62 ASD-related genes differentially expressed (Table 1 and Supplemental Table 2). AutDB genes were not enriched within the differentially expressed genes of the Ptenwt/m3m4 samples or the two-week old Ptenm3m4/m3m4 samples. Despite this, the overlapping ASD-susceptibility genes identified in patients through deletions or nonsense mutations were largely downregulated in the Ptenm3m4/m3m4 cortex (69%, Table 1). One additional gene, SLC16A3, was upregulated in Ptenm3m4/m3m4 mice, although both deletions and duplications are reported in the ASD literature7.
Table 1.
Many genes reported as deleted in human ASD are downregulated in Ptenm3m4/m3m4 mice at 6-weeks of age. See Supplemental Table 2 for the full list of altered susceptibility genes, their primary references, and differential expression information for the 2-week old cohort.
| AutDB Description | Ptenm3m4 Expression | |||
|---|---|---|---|---|
|
| ||||
| Gene | Alteration in ASD | Variant categories observed | Log2(FC) | q-value |
| CELF6 | Genetic association/Rare single gene variant/Functional | Deletions | −0.465 | 0.025 |
| GALNT13 | Rare single gene variant | −0.429 | 0.004 | |
|
| ||||
| ARHGAP15 | Rare single gene variant | Deletions, other | −0.529 | 0.003 |
| CHRNB3 | Rare single gene variant | −0.962 | 0.046 | |
| NELL1 | Genetic association | −0.386 | 0.008 | |
| PCDH15 | Genetic association | 0.637 | 0.001 | |
|
| ||||
| ADCY5 | Rare single gene variant | Deletions, missense mutations | −0.365 | 0.016 |
| AGMO | Genetic association | 0.501 | 0.042 | |
| DOCK10 | Rare single gene variant | 0.529 | 0.001 | |
| PTCHD1 | Rare single gene variant | −0.350 | 0.049 | |
| SYN2 | Genetic association | 0.401 | 0.016 | |
|
| ||||
| CADPS2 | Rare single gene variant | Deletions, missense mutations, other | −0.325 | 0.049 |
| GPR37 | Rare single gene variant | 0.524 | 0.001 | |
| GRIK2 | Genetic Association | −0.531 | 0.001 | |
| IL1RAPL1 | Rare single gene variant | −0.402 | 0.012 | |
| KANK1 | Rare single gene variant | 0.586 | 0.001 | |
|
| ||||
| AHI1 | Rare single gene variant | Deletions, duplications, missense mutations, other | −0.648 | 0.001 |
| CHD2 | Multigenic CNV | −0.374 | 0.039 | |
| CNTN5 | Rare single gene variant | −0.533 | 0.001 | |
| CNTNAP2 | Syndromic | −0.341 | 0.037 | |
| CREBBP | Syndromic | −0.324 | 0.050 | |
| CTTNBP2 | Rare single gene variant | −0.405 | 0.005 | |
| DCX | Rare single gene variant | −0.590 | 0.001 | |
| DHCR7 | Syndromic | 0.818 | 0.001 | |
| DMD | Genetic association | −0.372 | 0.011 | |
| FOXG1 | Syndromic | −0.410 | 0.031 | |
| FOXP1 | Rare single gene variant | −0.391 | 0.007 | |
| FOXP2 | Rare single gene variant | −1.019 | 0.001 | |
| HEPACAM | Rare single gene variant | 0.433 | 0.006 | |
| LAMC3 | Rare single gene variant | 0.600 | 0.007 | |
| RELN | Genetic association | −0.414 | 0.007 | |
| SLC16A3 | Rare single gene variant | 0.912 | 0.006 | |
To determine if these genes represent a unique signature of ASD or a broader neurodevelopmental or neuroinflammatory signal, we looked for enrichment of the differentially expressed genes seen in our homozygous Ptenm3m4 6-week old samples within several databases of genes linked to other neurological disorders. After comparison to AlzGene (Alzheimer’s disease), MSGene (multiple sclerosis), SZGene (schizophrenia), and ADHDGene (attention deficit hyperactivity disorder), we found a significant enrichment for all but the MSGene list. Assessing the overlap between the Ptenm3m4 genes found within each list, more than half of the AutDB genes (34/62) were unique. To determine if these candidate gene lists had a high degree of overlap, we compared each of the other neurological disorder databases to AutDB. Enrichment of AutDB genes within these other neurological databases was very high (Supplemental Table 3), consistent with reports showing overlap in candidate genes between Alzheimer’s and multiple sclerosis, as well as autism spectrum disorder and schizophrenia23, 24.
Six of the 62 ASD-genes were differentially expressed at both two- and six-weeks of age. Among those was Foxp2, a transcription factor considered important in the evolution of language and speech25. In Ptenm3m4 mice, Foxp2 was downregulated at both ages, with effect size becoming greater with age (Figure 3a). Additionally, we found significant upregulation of Msn, a gene targeted by a non-coding RNA (ncRNA) overexpressed in ASD. In contrast to the typical silencing effect of ncRNAs, this targeting lead to upregulation of the MSN gene in cell lines, indicating that the upregulation of Msn in Ptenm3m4/m3m4 mice is directionally appropriate (Figure 3b)26. Expanding this list to include all AutDB genes differentially expressed in at least one comparison group, we generated a minimal distance interaction network that was densely connected (Figure 3c). Gene ontology analysis of the entire network revealed enrichment of network genes within the ontologies synaptic transmission (GO: 0007268, circles outlined in orange) and immune system process (GO: 0002376, circles outlined in light blue). Validation that decreased gene expression measured via RNAseq corresponds to decreased protein levels is presented for Foxp2 and Cntnap2 in Supplemental Figure 1.
Figure 3.

Multiple ASD-susceptibility genes are differentially expressed at both two and six weeks of age, in the direction suggested by the type of variant (t-tests, n = 3 biological replicates per genotype and age, * indicates FDR corrected p-value < 0.05, ** indicates p < 0.01, error bars represent s.e.m.). (a) Foxp2 is downregulated in Ptenm3m4/m3m4 mice, and deletions of the human gene are reported in ASD. (b) Msn levels are increased, and functional validation of a ncRNA upregulated in ASD indicates that its targeting of the human MSN gene leads to upregulation. (c) Minimal distance interaction network representing all AutDB genes differentially expressed in at least one comparison group (larger font size). Interaction partners that connect two AutDB genes are shown in small font sizes, and the log2(fold-change) between wild-type and Ptenm3m4/m3m4 mice at 6 weeks is shown as node fill colors ranging from purple (upregulated) to green (downregulated). Membership in the gene ontology categories synaptic transmission and immune system process are indicated with node outline colors of orange and light blue, respectively.
DEG in Ptenm3m4 cortex are enriched in gene expression modules of the neurotypical developing human brain corresponding to immune and ASD related functions
To determine the parallels between gene expression changes in the Ptenm3m4 brain with those of human ASD, we needed to examine the murine alterations in the context of normal human brain development. To accomplish this, we utilized the weighted gene coexpression network of human brain development published by Parikshak, et al (Methods)21. We first identified the human orthologs of the mouse differentially expressed genes for each age and genotype using BioMart22. Next, we looked for enrichment of those genes within each expression module in the human brain coexpression network. Differentially expressed genes from Ptenm3m4/m3m4 mice at both two- and six-weeks of age were significantly enriched in module M13, which was previously found to be enriched for both ASD-susceptibility genes and genes differentially expressed in ASD cortical samples (Figure 4)21. Two human cortex gene expression modules related to immune system activity, M15 and M18, were also enriched in both Ptenm3m4/m3m4 and Ptenwt/m3m4 samples at both two and six-weeks of age. The differentially expressed genes in heterozygous mice were enriched in M13 at two-, but not six-weeks.
Figure 4.
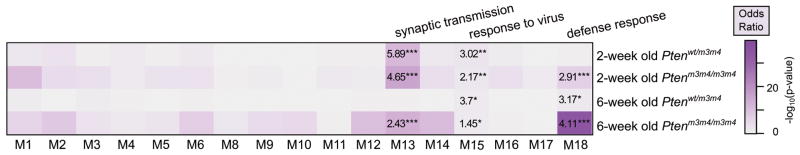
Differentially expressed genes in Ptenm3m4 mice are enriched in gene expression modules of the developing human brain that represent immune responses and synaptic transmission. The heatmap represents the −log10(p-value) of the two-tailed Fisher’s exact test for enrichment of differentially expressed genes within each individual module of the weighted gene coexpression network published by Parikshak, et al., 2013. Numbers within a cell correspond to the Fisher’s test odds ratio. Gene ontology terms most enriched in the significant modules are listed above. * indicates p-values < 0.05, ** < 0.01, and *** < 0.001.
Discussion
In this study, we utilized RNA-sequencing to identify the major pathogenic processes in a mouse model based on alteration of an ASD-susceptibility gene that regulates a host of cellular processes. Consistent with our previous finding that cellular and behavioral phenotypes were largely restricted to the Ptenm3m4/m3m4 animals, this genotype displayed more than ten times the number of differentially expressed genes seen in Ptenwt//m3m4 mice15. Two themes stood out amongst the altered genes, namely, increased expression of immune pathways and decreased expression of synaptic pathways. That the Ptenm3m4 mutation disrupted functional areas consistently altered in studies of idiopathic ASD, including the downregulation of many ASD susceptibility genes, is at first surprising, but suggests that PTEN-related pathways may have a major role in ASD pathogenesis. This hypothesis, and potential of PTEN disruption as a model for idiopathic ASD, is supported by its regulation of synaptic plasticity, neuronal migration, and dendritic arborization via the PI3K/AKT/mTOR pathway and other, less understood, mechanisms27–29.
In the 6-week old Ptenm3m4/m3m4 animals, many of the gene expression changes were linked to immune system activation. That this process was detectable in the 2-week old Ptenm3m4 brain (Figures 2, 4), extends our earlier findings of reactive astrogliosis and microglial activation in the Ptenm3m4/m3m4 brain at 6-weeks15. Although the results confirmed immune system activation in the model, they did not point to a specific initial stimulus. Rather, the data suggested upregulation of immune processes that were either nonspecific (e.g. IL-1 and NFκB responses), or pointed toward multiple potential starting points (e.g. upregulation of both TLR1 and TLR3). Histological studies of post-mortem ASD brains found similar evidence for neuroinflammation in patients as young as 3 years of age30, 31. More recent transcriptome studies support the histological reports, demonstrating increased expression of immune system related genes across multiple reports and methodologies20, 32.
The downregulation of multiple pathways related to the normal function of synapses in the Ptenm3m4 model provokes several questions (Figure 2). These effects occur despite normal neuron number and minimal effects of the Ptenm3m4 mutation on neuronal morphology, suggesting causative mechanisms beyond PI3K/mTOR induced hypertrophy15. This hypothesis is supported by a report showing that cellular hypertrophy was unconnected to synaptic changes in a mouse model of neuron-specific Pten loss27. We speculate that many of these downregulation events are an indirect effect of PTEN disruption, occurring downstream of increased expression of transcription factors or activation of pathways normally inhibited by PTEN activity. Overproduction of astrocytes in the Ptenm3m4 brain should not be overlooked as a potential driver of synaptic dysfunction, a major area of ASD research15, 33–35. Functional magnetic resonance imaging studies report decreased functional connectivity across multiple regions of the ASD brain, and decreased expression of synaptic genes was a major finding in the ASD cortical transcriptome20, 36, 37. As that same study reported disruption of glial gene expression signatures, how changes to glial activity in response to inflammatory stimuli affect their regulation of synapses is an open question20.
The decreased expression of >60 ASD-susceptibility genes in the Ptenm3m4/m3m4 cortex by 6-weeks of age indicates that the normal activity of these genes is regulated by PTEN-related pathways (Table 1 and Figure 3). Enrichment of Ptenm3m4/m3m4 DEGs within the susceptibility genes of other neurological disorders may point to a common set of gene expression differences that occur in cases of neuroinflammation (Alzheimer’s/MS) or synaptic dysfunction (ASD/Schizophrenia). Most of the Ptenm3m4/m3m4 DEGs found in AutDB were unique to ASD, and may represent a distinct set of ASD-linked processes disrupted in these animals. That these susceptibility genes were also enriched in gene ontologies relating to synaptic and immune functions underscores the importance of these pathways from the genetics to histopathology of ASD (Figure 3).
Weighted gene coexpression network analysis is a powerful tool for uncovering how clusters of genes relate to each other (e.g trajectory of expression during development) and to specific phenotypes (e.g. ASD or intellectual disability). Utilizing this tool to explore how the gene expression differences we observed in Ptenm3m4 mice relate to human cortical development, we found striking parallels to idiopathic ASD. The Ptenm3m4 alterations mapped to the expression network of the neurotypical human brain in some of the same ways as alterations observed in ASD at both the transcriptional and susceptibility gene levels (Figure 4)21. That these points of divergence from normal development related to synaptic transmission and immune responses supports our conclusion that the Ptenm3m4 mutation alters multiple neural cell types in ways functionally important to the pathogenesis of ASD.
There are limitations to the current study that should be noted. The Ptenm3m4 mutation produces diminished levels of a mislocalized protein, potentially better tolerated by mice than humans. Such differences may underlie the subtle phenotype of heterozygous Ptenm3m4 mice, and represent a common limitation of mouse models of human disease. Our ability to detect differences in the 2-week samples was likely reduced by the increased heterogeneity of whole brain tissue compared to microdissected cortex. It is possible that ASD susceptibility genes or those related broadly to synaptic activity are significantly disrupted at this earlier stage. Larger sample sizes would have aided detection of such differences. Despite these limitations, the presence of so many ASD-susceptibility genes within the altered landscape of the Ptenm3m4 transcriptome suggest that the model exhibits fundamental similarities to human ASD arising from both syndromic (PHTS) and non-syndromic (idiopathic, rare variant) causes.
This study places PTEN far upstream in the pathogenesis of ASD, as germline alterations to its function produced transcriptional changes impacting central aspects of the disorder. With recent advances in our understanding of the ASD transcriptome, we can now focus on animal model-based studies on the mechanisms behind the behavioral phenotypes and their amenability to treatment and in time, prevention. The greatest benefit will come from those models where ASD-like behaviors arise from the dysfunction of the same pathways that are altered in human ASD38. A logical next step for these studies will be functional analyses guided by the synaptic dysfunction suggested by our data. Additionally, investigation of embryonic and early-postnatal timepoints for evidence of neuroinflammation is warranted, as its presence can be appreciated by as early as two-weeks, before synaptic dysfunction manifests as disrupted signaling networks (Figure 2).
Supplementary Material
Acknowledgments
We are grateful to Dr. Robert Miller and Dr. Jonathan Smith for their critical assessment of the findings. This work was supported, in part, by the National Institutes of Health [R01CA118989 to C.E.], and a generous gift from Sam H. Miller. C.E. is the Sondra J. and Stephen R. Hardis Endowed Chair of Cancer Genomic Medicine at the Cleveland Clinic, and is an ACS Clinical Research Professor.
Footnotes
Conflict of Interest
The authors have no competing financial interests.
Supplementary information is available at Molecular Psychiatry’s website.
References
- 1.Freitag CM. The genetics of autistic disorders and its clinical relevance: a review of the literature. Molecular psychiatry. 2007;12(1):2–22. doi: 10.1038/sj.mp.4001896. [DOI] [PubMed] [Google Scholar]
- 2.Frazier TW, Youngstrom EA, Speer L, Embacher R, Law P, Constantino J, et al. Validation of proposed DSM-5 criteria for autism spectrum disorder. Journal of the American Academy of Child and Adolescent Psychiatry. 2012;51(1):28–40. e23. doi: 10.1016/j.jaac.2011.09.021. [DOI] [PMC free article] [PubMed] [Google Scholar]
- 3.O’Roak BJ, Vives L, Girirajan S, Karakoc E, Krumm N, Coe BP, et al. Sporadic autism exomes reveal a highly interconnected protein network of de novo mutations. Nature. 2012;485(7397):246–250. doi: 10.1038/nature10989. [DOI] [PMC free article] [PubMed] [Google Scholar]
- 4.Michaelson JJ, Shi Y, Gujral M, Zheng H, Malhotra D, Jin X, et al. Whole-genome sequencing in autism identifies hot spots for de novo germline mutation. Cell. 2012;151(7):1431–1442. doi: 10.1016/j.cell.2012.11.019. [DOI] [PMC free article] [PubMed] [Google Scholar]
- 5.Ben-David E, Shifman S. Combined analysis of exome sequencing points toward a major role for transcription regulation during brain development in autism. Molecular psychiatry. 2013;18(10):1054–1056. doi: 10.1038/mp.2012.148. [DOI] [PubMed] [Google Scholar]
- 6.Schaaf CP, Sabo A, Sakai Y, Crosby J, Muzny D, Hawes A, et al. Oligogenic heterozygosity in individuals with high-functioning autism spectrum disorders. Hum Mol Genet. 2011;20(17):3366–3375. doi: 10.1093/hmg/ddr243. [DOI] [PMC free article] [PubMed] [Google Scholar]
- 7.Pinto D, Pagnamenta AT, Klei L, Anney R, Merico D, Regan R, et al. Functional impact of global rare copy number variation in autism spectrum disorders. Nature. 2010;466(7304):368–372. doi: 10.1038/nature09146. [DOI] [PMC free article] [PubMed] [Google Scholar]
- 8.Mount RH, Charman T, Hastings RP, Reilly S, Cass H. Features of autism in Rett syndrome and severe mental retardation. Journal of autism and developmental disorders. 2003;33(4):435–442. doi: 10.1023/a:1025066913283. [DOI] [PubMed] [Google Scholar]
- 9.Sandberg AD, Ehlers S, Hagberg B, Gillberg C. The Rett Syndrome Complex: Communicative Functions in Relation to Developmental Level and Autistic Features. Autism. 2000;4(3):249–267. [Google Scholar]
- 10.Jeste SS, Geschwind DH. Disentangling the heterogeneity of autism spectrum disorder through genetic findings. Nature reviews Neurology. 2014;10(2):74–81. doi: 10.1038/nrneurol.2013.278. [DOI] [PMC free article] [PubMed] [Google Scholar]
- 11.Butler MG, Dasouki MJ, Zhou XP, Talebizadeh Z, Brown M, Takahashi TN, et al. Subset of individuals with autism spectrum disorders and extreme macrocephaly associated with germline PTEN tumour suppressor gene mutations. J Med Genet. 2005;42(4):318–321. doi: 10.1136/jmg.2004.024646. [DOI] [PMC free article] [PubMed] [Google Scholar]
- 12.McBride KL, Varga EA, Pastore MT, Prior TW, Manickam K, Atkin JF, et al. Confirmation study of PTEN mutations among individuals with autism or developmental delays/mental retardation and macrocephaly. Autism research: official journal of the International Society for Autism Research. 2010;3(3):137–141. doi: 10.1002/aur.132. [DOI] [PubMed] [Google Scholar]
- 13.Tan MH, Mester J, Peterson C, Yang Y, Chen JL, Rybicki LA, et al. A clinical scoring system for selection of patients for PTEN mutation testing is proposed on the basis of a prospective study of 3042 probands. Am J Hum Genet. 2011;88(1):42–56. doi: 10.1016/j.ajhg.2010.11.013. [DOI] [PMC free article] [PubMed] [Google Scholar]
- 14.Mester JL, Tilot AK, Rybicki LA, Frazier TW, 2nd, Eng C. Analysis of prevalence and degree of macrocephaly in patients with germline PTEN mutations and of brain weight in Pten knock-in murine model. European journal of human genetics: EJHG. 2011;19(7):763–768. doi: 10.1038/ejhg.2011.20. [DOI] [PMC free article] [PubMed] [Google Scholar]
- 15.Tilot AK, Gaugler MK, Yu Q, Romigh T, Yu W, Miller RH, et al. Germline disruption of Pten localization causes enhanced sex-dependent social motivation and increased glial production. Human molecular genetics. 2014;23(12):3212–3227. doi: 10.1093/hmg/ddu031. [DOI] [PMC free article] [PubMed] [Google Scholar]
- 16.Trapnell C, Hendrickson DG, Sauvageau M, Goff L, Rinn JL, Pachter L. Differential analysis of gene regulation at transcript resolution with RNA-seq. Nature biotechnology. 2013;31(1):46–53. doi: 10.1038/nbt.2450. [DOI] [PMC free article] [PubMed] [Google Scholar]
- 17.Trapnell C, Roberts A, Goff L, Pertea G, Kim D, Kelley DR, et al. Differential gene and transcript expression analysis of RNA-seq experiments with TopHat and Cufflinks. Nature protocols. 2012;7(3):562–578. doi: 10.1038/nprot.2012.016. [DOI] [PMC free article] [PubMed] [Google Scholar]
- 18.Basu SN, Kollu R, Banerjee-Basu S. AutDB: a gene reference resource for autism research. Nucleic acids research. 2009;37(Database issue):D832–836. doi: 10.1093/nar/gkn835. [DOI] [PMC free article] [PubMed] [Google Scholar]
- 19.Zhang B, Horvath S. A general framework for weighted gene co-expression network analysis. Statistical applications in genetics and molecular biology. 2005;4:Article17. doi: 10.2202/1544-6115.1128. [DOI] [PubMed] [Google Scholar]
- 20.Voineagu I, Wang X, Johnston P, Lowe JK, Tian Y, Horvath S, et al. Transcriptomic analysis of autistic brain reveals convergent molecular pathology. Nature. 2011;474(7351):380–384. doi: 10.1038/nature10110. [DOI] [PMC free article] [PubMed] [Google Scholar]
- 21.Parikshak NN, Luo R, Zhang A, Won H, Lowe JK, Chandran V, et al. Integrative functional genomic analyses implicate specific molecular pathways and circuits in autism. Cell. 2013;155(5):1008–1021. doi: 10.1016/j.cell.2013.10.031. [DOI] [PMC free article] [PubMed] [Google Scholar]
- 22.Kasprzyk A. BioMart: driving a paradigm change in biological data management. Database: the journal of biological databases and curation. 2011:bar049. doi: 10.1093/database/bar049. [DOI] [PMC free article] [PubMed] [Google Scholar]
- 23.Crespi B, Stead P, Elliot M. Evolution in health and medicine Sackler colloquium: Comparative genomics of autism and schizophrenia. Proceedings of the National Academy of Sciences of the United States of America. 2010;107 (Suppl 1):1736–1741. doi: 10.1073/pnas.0906080106. [DOI] [PMC free article] [PubMed] [Google Scholar]
- 24.Lambert JC, Ibrahim-Verbaas CA, Harold D, Naj AC, Sims R, Bellenguez C, et al. Meta-analysis of 74,046 individuals identifies 11 new susceptibility loci for Alzheimer’s disease. Nature genetics. 2013;45(12):1452–1458. doi: 10.1038/ng.2802. [DOI] [PMC free article] [PubMed] [Google Scholar]
- 25.Graham SA, Fisher SE. Decoding the genetics of speech and language. Current opinion in neurobiology. 2013;23(1):43–51. doi: 10.1016/j.conb.2012.11.006. [DOI] [PubMed] [Google Scholar]
- 26.Kerin T, Ramanathan A, Rivas K, Grepo N, Coetzee GA, Campbell DB. A noncoding RNA antisense to moesin at 5p14. 1 in autism. Science translational medicine. 2012;4(128):128ra140. doi: 10.1126/scitranslmed.3003479. [DOI] [PubMed] [Google Scholar]
- 27.Sperow M, Berry RB, Bayazitov IT, Zhu G, Baker SJ, Zakharenko SS. Phosphatase and tensin homologue (PTEN) regulates synaptic plasticity independently of its effect on neuronal morphology and migration. The Journal of physiology. 2012;590(Pt 4):777–792. doi: 10.1113/jphysiol.2011.220236. [DOI] [PMC free article] [PubMed] [Google Scholar]
- 28.Kwon CH, Luikart BW, Powell CM, Zhou J, Matheny SA, Zhang W, et al. Pten regulates neuronal arborization and social interaction in mice. Neuron. 2006;50(3):377–388. doi: 10.1016/j.neuron.2006.03.023. [DOI] [PMC free article] [PubMed] [Google Scholar]
- 29.Wen Y, Li W, Choudhury GR, He R, Yang T, Liu R, et al. Astroglial PTEN Loss Disrupts Neuronal Lamination by Dysregulating Radial Glia-guided Neuronal Migration. Aging and disease. 2013;4(3):113–126. [PMC free article] [PubMed] [Google Scholar]
- 30.Vargas DL, Nascimbene C, Krishnan C, Zimmerman AW, Pardo CA. Neuroglial activation and neuroinflammation in the brain of patients with autism. Annals of neurology. 2005;57(1):67–81. doi: 10.1002/ana.20315. [DOI] [PubMed] [Google Scholar]
- 31.Morgan JT, Chana G, Pardo CA, Achim C, Semendeferi K, Buckwalter J, et al. Microglial activation and increased microglial density observed in the dorsolateral prefrontal cortex in autism. Biological psychiatry. 2010;68(4):368–376. doi: 10.1016/j.biopsych.2010.05.024. [DOI] [PubMed] [Google Scholar]
- 32.Garbett K, Ebert PJ, Mitchell A, Lintas C, Manzi B, Mirnics K, et al. Immune transcriptome alterations in the temporal cortex of subjects with autism. Neurobiology of disease. 2008;30(3):303–311. doi: 10.1016/j.nbd.2008.01.012. [DOI] [PMC free article] [PubMed] [Google Scholar]
- 33.Bourgeron T. A synaptic trek to autism. Current opinion in neurobiology. 2009;19(2):231–234. doi: 10.1016/j.conb.2009.06.003. [DOI] [PubMed] [Google Scholar]
- 34.Krumm N, O’Roak BJ, Shendure J, Eichler EE. A de novo convergence of autism genetics and molecular neuroscience. Trends in neurosciences. 2014;37(2):95–105. doi: 10.1016/j.tins.2013.11.005. [DOI] [PMC free article] [PubMed] [Google Scholar]
- 35.Won H, Mah W, Kim E. Autism spectrum disorder causes, mechanisms, and treatments: focus on neuronal synapses. Frontiers in molecular neuroscience. 2013;6:19. doi: 10.3389/fnmol.2013.00019. [DOI] [PMC free article] [PubMed] [Google Scholar]
- 36.Maximo JO, Cadena EJ, Kana RK. The implications of brain connectivity in the neuropsychology of autism. Neuropsychology review. 2014;24(1):16–31. doi: 10.1007/s11065-014-9250-0. [DOI] [PMC free article] [PubMed] [Google Scholar]
- 37.Rudie JD, Shehzad Z, Hernandez LM, Colich NL, Bookheimer SY, Iacoboni M, et al. Reduced functional integration and segregation of distributed neural systems underlying social and emotional information processing in autism spectrum disorders. Cerebral cortex. 2012;22(5):1025–1037. doi: 10.1093/cercor/bhr171. [DOI] [PMC free article] [PubMed] [Google Scholar]
- 38.Sgado P, Provenzano G, Dassi E, Adami V, Zunino G, Genovesi S, et al. Transcriptome profiling in engrailed-2 mutant mice reveals common molecular pathways associated with autism spectrum disorders. Molecular autism. 2013;4(1):51. doi: 10.1186/2040-2392-4-51. [DOI] [PMC free article] [PubMed] [Google Scholar]
Associated Data
This section collects any data citations, data availability statements, or supplementary materials included in this article.