Abstract
Characteristics of the 2011 Tohoku Tsunami have been revealed by collaborative tsunami surveys extensively performed under the coordination of the Joint Tsunami Survey Group. The complex behaviors of the mega-tsunami were characterized by the unprecedented scale and the low occurrence frequency. The limitation and the performance of tsunami countermeasures were described on the basis of tsunami surveys, laboratory experiments and numerical analyses. These findings contributed to the introduction of two-level tsunami hazards to establish a new strategy for tsunami disaster mitigation, combining structure-based flood protection designed by the Level-1 tsunami and non-structure-based damage reduction planned by the Level-2 tsunami.
Keywords: 2011 Tohoku Tsunami, inundation and runup, tsunami watermark survey, two level tsunami hazards for disaster mitigation
1. Introduction
At 14:46 JST on March 11, 2011, a magnitude 9.0 earthquake struck the northeast part of Japan, generating a catastrophic tsunami, which severely impacted the Japanese Pacific coast. This tsunami represents the largest tsunami event possibly within the last one thousand years in Japan. Significant casualties (18,483 fatalities including missing as of January 9, 2015, according to National Police Agency) and tremendous damage to coastal cities were caused by this tsunami event, hereafter referred to the 2011 Tohoku Tsunami.
Even before the 2011 Tohoku Tsunami, Japan has been affected by many earthquakes and tsunamis owing to its geographical and tectonic conditions (e.g., Shuto and Fujima1)). Especially, the Sanriku District, located north Pacific Ocean side of eastern Japan, had been devastated repeatedly by huge tsunami disasters, such as 1611 Keicho Tsunami, 1896 Meiji Sanriku Tsunami and 1933 Showa Sanriku Tsunami. Trans-Pacific Chilean Tsunami 1960 affected the area as well. Consequently, comprehensive tsunami countermeasures have been introduced by shore protection structures combined with non-structure based countermeasures promoting early evacuation. The Sanriku District is therefore regarded as one of the most advanced areas in tsunami disaster prevention. However, the effectiveness of these countermeasures appeared to be limited for the mega-tsunami with a tremendous scale. This paper aims to review characteristics of the 2011 Tohoku Tsunami based on extensive post tsunami surveys conducted under the coordination of the Joint Survey Group (TTJS2)) and future directions of tsunami disaster mitigation introduced on the basis of nation-wide discussions in academic societies and governmental institutions.
2. Characteristics of the 2011 Tohoku Tsunami
2.1. Collaborative surveys of tsunami damage.
It is important to describe the tsunami behavior and damage to communities on the basis of scientific surveys. However, the scientific data of tsunami are generally very limited compared with ground shaking data recorded by a densely arranged network of seismometers. Tsunami data are only available by a few tide gages, occasionally installed sea-bottom pressure sensors and GPS buoys recently introduced by the Japanese Government. Post tsunami surveys were therefore considered to be crucial to complement the data which were essential to understand the whole picture of the tsunami, especially for features of nearshore and inland responses of the tsunami.
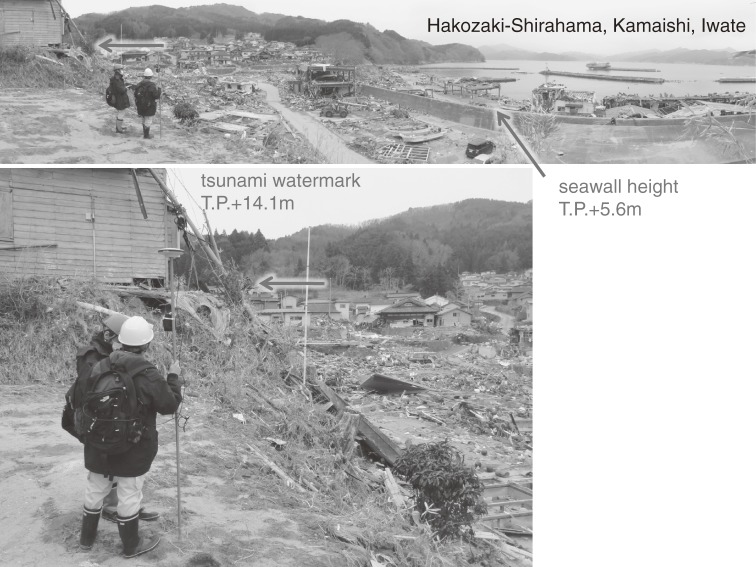
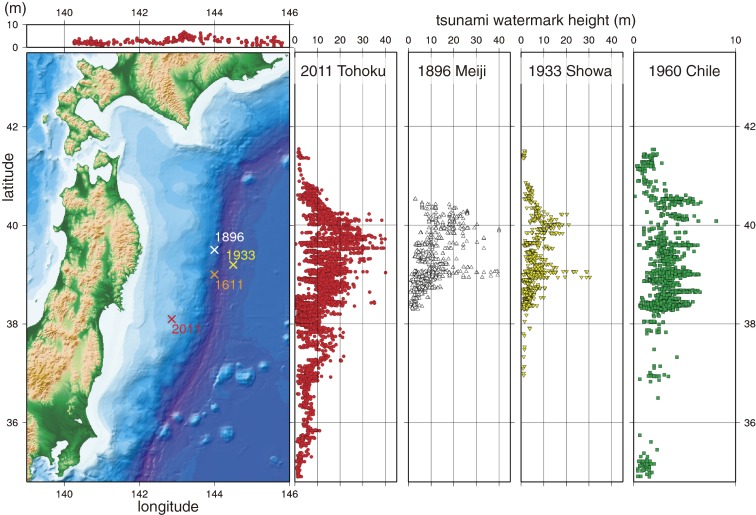
Post tsunami surveys should be performed as quickly as possible to cover the whole affected areas without interfering with initial rescue operations, but prior to perishable evidence being removed during recovery and reconstruction. For the massive tsunami affecting a wide area spanning over several hundred kilometers, such a comprehensive survey can only be achieved by collaborative efforts of multiple survey teams with various organizations, disciplines and countries. The usefulness of such collaboration has also been recognized in past mega-tsunamis, such as 1993 Okushiri Tsunami and 2004 Sumatra Tsunami. Since the respective survey team is independently organized with individual missions, a good coordination is necessary in order to avoid dropping and overlapping of survey areas. On the 2011 Tohoku Tsunami, a data sharing scheme under the same survey protocol in a unified data format was developed on the internet immediately after the event (Mori et al.3)). These activities were supported by multi-disciplinary academic societies in the field of geophysics (Japan Geoscience Union) and civil engineering (Japan Society of Civil Engineers). More than 300 Japanese and international researchers and engineers collaborated in the Tohoku Tsunami Joint Survey Group (TTJS2)). Figure 1 illustrates a typical example of tsunami survey in Kamaishi, Iwate Prefecture in which the survey team measured the inundated tsunami level at 14.1 m T.P. while the height of the seawall 5.6 m T.P., where T.P. denotes for Tokyo Peil, the standard datum of Japan topography. The evolving database updated on the Internet provided continuous public access for scientific research as well as rescue, recovery and restoration efforts in the affected areas. It is noted here that all photographs taken in tsunami surveys including those in Fig. 1 are archived and freely available in Tsunami Joint Survey Group Photo Archive.4) According to the database finalized on December 2012, the measured maximum tsunami run-up heights reached nearly 40 m above sea level as shown in Fig. 2. In Fig. 2, tsunami watermark heights in Honshu are plotted against the latitude (right panel to the map) while those in Hokkaido are plotted against the longitude (top panel). The data successfully cover the wide affected area with more than 500 km coastal stretch including the Fukushima Prefecture in which the survey was partly delayed owing to the nuclear accident.
Figure 1.
A typical example of tsunami watermark survey in Kamaishi, Iwate Prefecture (April 11, 2011).
Figure 2.
Distributions of tsunami watermark heights compared with historical tsunamis (Tohoku Tsunami Joint Survey Group,2) Tsunami Trace Database5)).
The distribution of watermark heights reflects the characteristics of the 2011 Tohoku Tsunami. Figure 2 compares distribution of watermark heights for 1896 Meiji Sanriku Tsunami, 1933 Showa Sanriku Tsunami and 1960 Chilean Tsunami. The tsunami trace database5) was utilized. It is noticed that the 1896 Meiji Tsunami and the 1933 Showa Tsunami produced large watermark heights exclusively on Sanriku Coast. On the other hand, the Chilean Tsunami affected wider areas although the tsunami height was small. Since the Chilean Tsunami is a trans-Pacific distant tsunami, the incident tsunami is considered to be more uniform than other near-field tsunamis. The wider distribution of watermark heights for the 1960 Chilean Tsunami is therefore considered to reflect the characteristics of incident tsunami. Such a wide affected area had never been reported by historical Sanriku Tsunamis but could have been produced by the Jogan Tsunami in 869, whose mega-scale has been partially revealed by recent tsunami deposit studies (e.g., Minoura et al.6)) and numerical simulation (Satake et al.7)). The 2011 Tohoku Tsunami is characterized by both large heights in Sanriku Coast and large affected areas. This suggests the two characters of this event, represented by the Sanriku type tsunami producing locally large tsunami in Sanriku District and by the Jogan type tsunami affecting a large area with a relatively large source zone as in the 869 Jogan Tsunami. Such two-sided characters were also described by Satake et al.8) on the basis of numerical simulation of tsunami by different tsunami sources. The occurrence frequency of the Sanriku type tsunami is considered to be of the order of once in a hundred years and that of the Jogan type tsunami is considered to be once in a thousand years. The 2011 Tohoku Tsunami is therefore considered to be characterized by two different features both in the low occurrence frequency and the huge scale of the tsunami source.
2.2. Performance of seawalls in tsunami damage reduction.
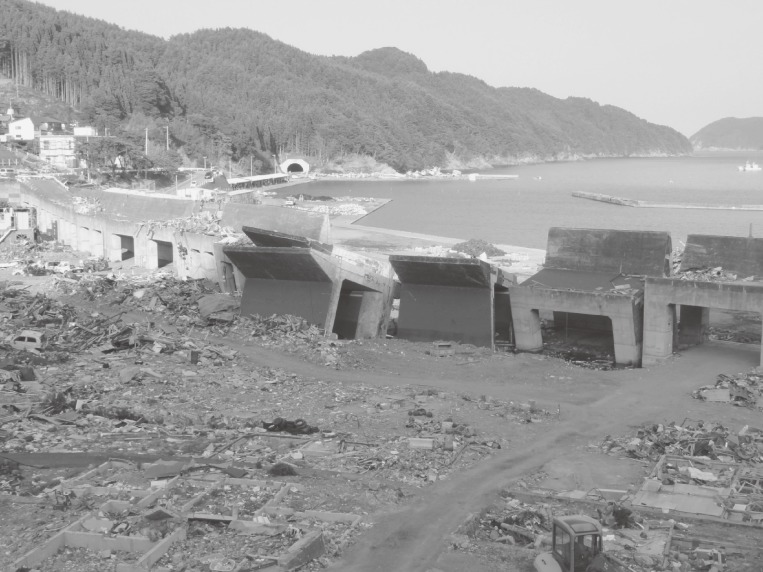
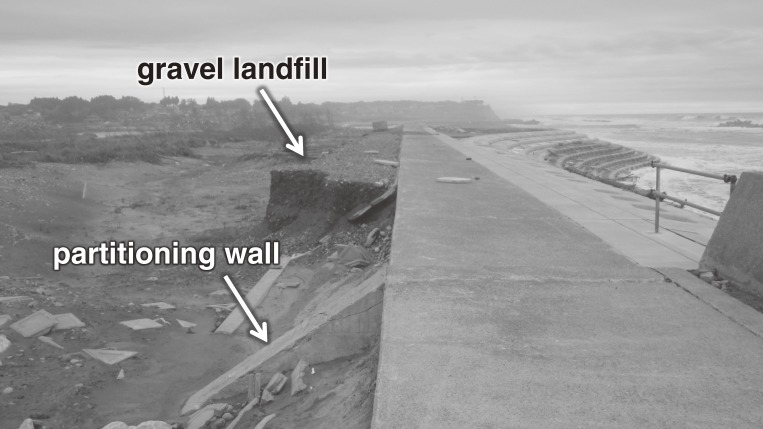
Many seawalls were collapsed by the massive tsunami where tsunami overflowed the top of the seawalls by several meters. In Iwate Prefecture, many large seawalls were broken including 10 m tall concrete seawalls in Kojira-hama, Touni as shown in Fig. 3. Such complete destruction of seawalls was also observed in Miyagi Prefecture and in the north part of Fukushima Prefecture. It was sometimes difficult there to conjecture the mechanism of seawall destruction since even remnant seawalls were washed away although some seawalls remained intact as shown in Fig. 1 in case the foundation was paved by a massive concrete plate. On the other hand, in the area south to the Fukushima Prefecture, the tsunami height was of the same order with the height of seawalls. The survey teams observed clear contrasts in damage behind collapsed seawalls and survived seawalls, which appeared to provide valuable hints for tenacious seawall structure that improves durability against tsunami overflow. Figure 4 demonstrates a typical example of tenacious seawalls observed in Minami-Soma, Fukushima Prefecture. The presence of gravel fill on the landside slope as well as the interior partitioning walls appeared to enhance the seawall tenacity.
Figure 3.
Collapsed seawalls at Kojira-hama, Touni, Iwate Prefecture (June 19, 2011).
Figure 4.
Surviving seawall at Tsukabara, Minami-Soma, Fukushima Prefecture (June 20, 2012).
Sato et al.9) investigated the role of seawalls for tsunami overflow on the basis of surveys in Nakoso, Iwaki City, located in the southernmost part of Fukushima Prefecture. In Nakoso, the seawalls in the north of the Samegawa River were constructed for a total length of 2 km with two different designed heights, i.e., 6 m T.P. on the south near the Samegawa River mouth with a length of 950 m and about 4.2 m T.P. for the remaining part. The height of the seawall appeared to be designed on the basis of run-up height calculation of storm waves since no large historic records of tsunami were available in this region. For the high seawall part, all remained intact after the tsunami attack whereas 71% of the low seawall was collapsed. This demonstrated that the tsunami damage was strongly dependent on the relative height of the seawall. Behind the 6 m seawall, the tsunami intensity and velocity were significantly reduced and the maximum inundation depth is only 0.6 m. In contrasts, tsunami intensity was catastrophic in the seawall-broken area with an inundation depth of 4 to 5 m.
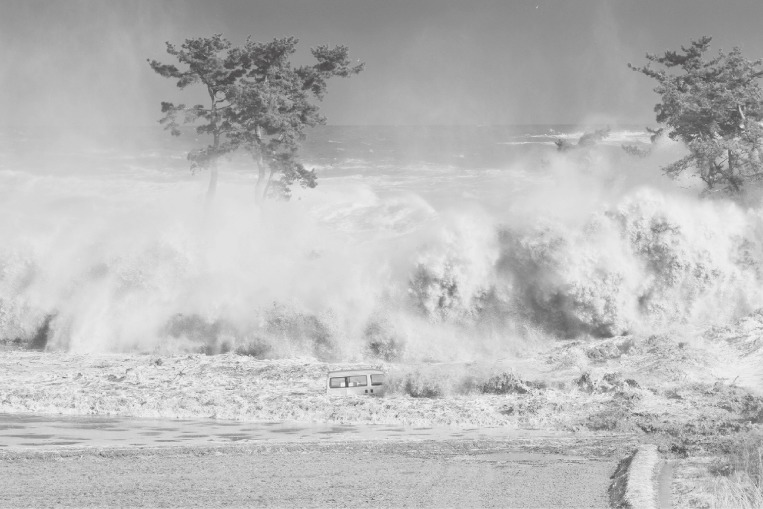
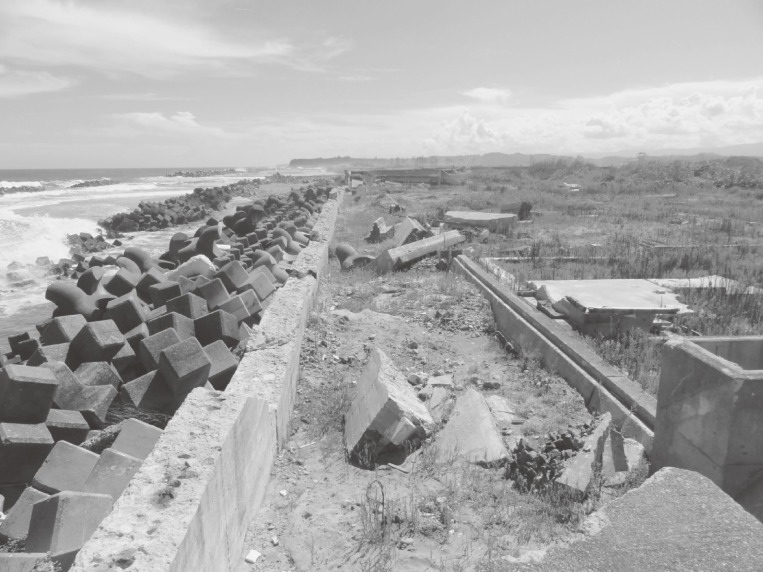
Sato et al.10) and Sato et al.11) described the tsunami characteristics in the former exclusion zone in Fukushima Prefecture, where the survey was delayed due to the nuclear accident at the Fukushima Dai-ichi Nuclear Power Plant. Figure 5 shows a snapshot of tsunami splashed on the shore in Tsukabara, Minami-Soma, 16 km north of the Power Plant. The height of the tsunami was about 10 m on the shore as compared with the 20 m tall coastal pine tree. Upright concrete seawalls in Tsukabara were completely broken off at the ground level as shown in Fig. 6. The 3 m wide capping concrete plate and the landside concrete cover plate were displaced and transported inland by the overflowing tsunami. The sand filled core inside the seawall was completely washed away. Some of the concrete armor blocks, originally placed in front of the seawall, were found more than 300 m inland.
Figure 5.
Tsunami observed at Tsukabara, Minami-Soma, Fukushima Prefecture (15:39 JST, March 11, 2011, Courtesy Mr. Tomisawa).
Figure 6.
Seawall destruction in Tsukabara (September 3, 2012).
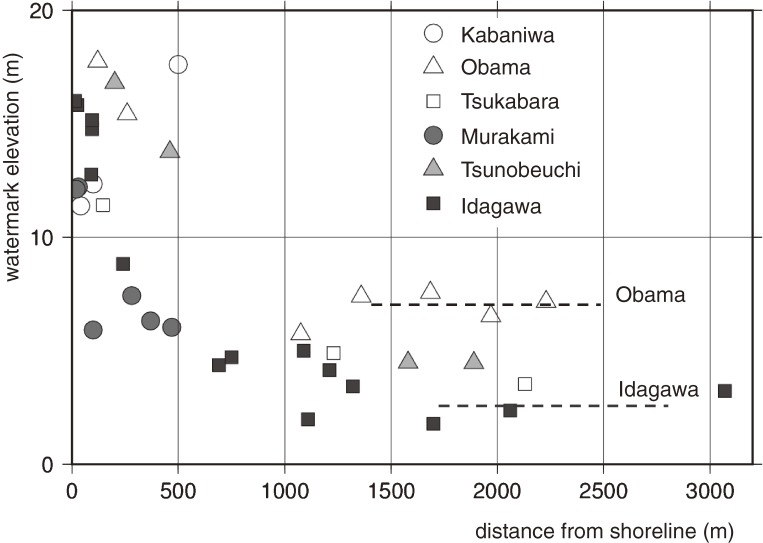
Figure 7 shows the relationship between the flooding tsunami height and the inland distance from the shoreline. Large tsunami heights were observed within 500 m from the shoreline where scattered residential houses were completely destroyed. However inland tsunami inundation heights at different locations vary in spite of comparable tsunami heights near the shore. The tsunami heights more than 1.5 km inland at Obama are as high as 7 m, while those at Idagawa are smaller than 3 m. The reason for this significant difference is considered to be associated with the difference in damage levels of seawalls. Kato et al.12) developed a comprehensive dataset of seawall destruction due to the 2011 Tohoku Tsunami. On the basis of visual inspection of aerial photographs and satellite images, they categorized the destruction of seawalls in ‘complete collapse’ when the seawall completely collapsed to the ground level, and ‘partial collapse’ when some part of seawall remained. Table 1 summarizes the data for seawalls in respective areas in Minami-Soma, where 5 m tall seawalls were constructed in Obama, Tsukabara, Murakami, Tsunobeuchi and Idagawa in order from north to south. According to Table 1, the ratio of ‘complete collapse’ is large at Obama but small at Idagawa, which explains why the inland tsunami heights near the inundation boundary at Obama were large compared to Idagawa. This demonstrates that unless the seawalls were completely destroyed, the remnant seawalls are capable of reducing the inland inundation level. Although the reason for the difference in ‘complete collapse ratio’ is still unclear, the presence of tenacious structures as shown in Fig. 4 observed in Tsukabara might affect the different level of destruction.
Figure 7.
Relationship between tsunami heights and distance from the shoreline observed in Minami-Soma, Fukushima Prefecture.
Table 1.
Total and collapsed length of seawalls in Minami-Soma compiled by Kato et al. (2013)
| Area | Total length (m) | Length (m) for ‘complete collapse’ | Ratio (%) |
|---|---|---|---|
| Obama | 1,483 | 469 | 32% |
| Tsukabara | 2,041 | 99 | 5% |
| Murakami | 201 | 0 | 0% |
| Tsunobeuchi | 1,581 | 61 | 4% |
| Idagawa | 1,652 | 0 | 0% |
2.3. Numerical simulation of tsunami propagation.
On the basis of extensive tsunami surveys combined with limited number of tide gage and buoy data, tsunami source was investigated. Many studies identified especially large seafloor deformation generated near the Japan Trench although the whole source area extended 500 km north to south by 300 km east to west. When the tsunami source is given, the propagation of tsunami in the ocean can be simulated on the basis of the linear long wave equation in the global coordinate expressed as follows:
 |
[1] |
 |
[2] |
 |
[3] |
where R is the radius of the earth, λ is the longitude, φ is the latitude, M and N are flow rates in the longitude and latitude directions and η is the water surface elevation. The symbol h denotes still water depth and g denotes the acceleration due to gravity.
Sato et al.10) conducted numerical tsunami simulation by the leap-frog finite difference scheme in the domain 140 to 146 degrees in the east longitude and 34 to 42 degrees in the north latitude. The water depths were digitized from the bathymetry chart produced by the Japan Hydrographic Association. The grid size was 0.005 degrees in both longitude and latitude directions and the time step was 1 second. The computation was conducted for the duration of 100 minutes after the earthquake. The tsunami source proposed by Fujii et al.13) (version 4.2) was used for the simulation. The validity of the computation was verified with time histories of water surface elevation recorded by GPS buoys (Kawai et al.14)).
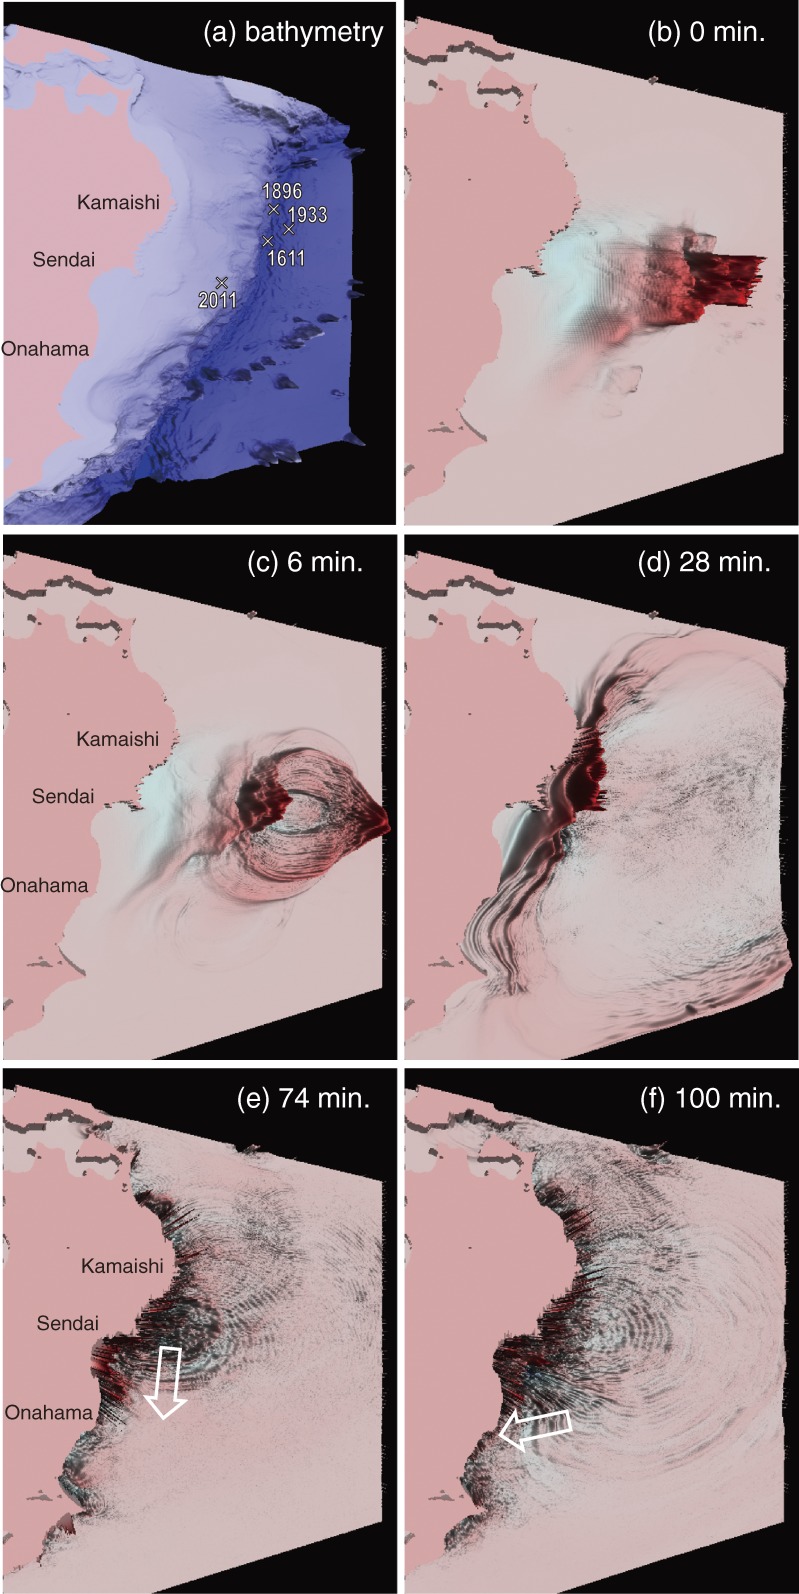
Figure 8 illustrates the results of numerical computations. Figure 8(a) illustrates bathymetry and Fig. 8(b) represents the tsunami source proposed by Fujii et al.13) Although the epicenter of the 2011 Tohoku Earthquake is located in relatively shallow area, a large seafloor deformation is developed near the Japan Trench, where the epicenters of historical tsunami-generating earthquakes are located. The initial tsunami energy transmitted by the seafloor deformation to the sea water, was spread out from the source zone. Owing to the elongated shape of the large deformation zone, the emission of tsunami energy exhibits a particular directivity as shown in Fig. 8(c). Thus the height of tsunamis propagating to the east and the west becomes larger than those to the north and the south. The tsunami hit the coast in about 30 minutes after the earthquake. Figure 8(d) shows a snapshot of tsunami 28 minutes after the earthquake, just before it arrives at Kamaishi in Iwate Prefecture and Onahama in Fukushima Prefecture. It is noted here that tsunami flooding in the Kamaishi Port was broadcast on TV at 15:14 JST, 28 minutes after the earthquake. Early arrival of tsunami at Onahama appeared to be due to the relatively deep nearshore bathymetry there. Upon reaching the coast, most of the tsunami energy are reflected back to the ocean. However, as shown in Fig. 8(e) and (f), tsunamis are partially trapped on the coastal shelf and directed back to the coast, resulting in bouncing tsunami attacks in a long duration. The entrapment of tsunami appears to be one reason why the large tsunami warning was kept issued more than 24 hours.
Figure 8.
Numerical computation of the 2011 Tohoku Tsunami.
3. Two level tsunamis introduced for tsunami disaster mitigation
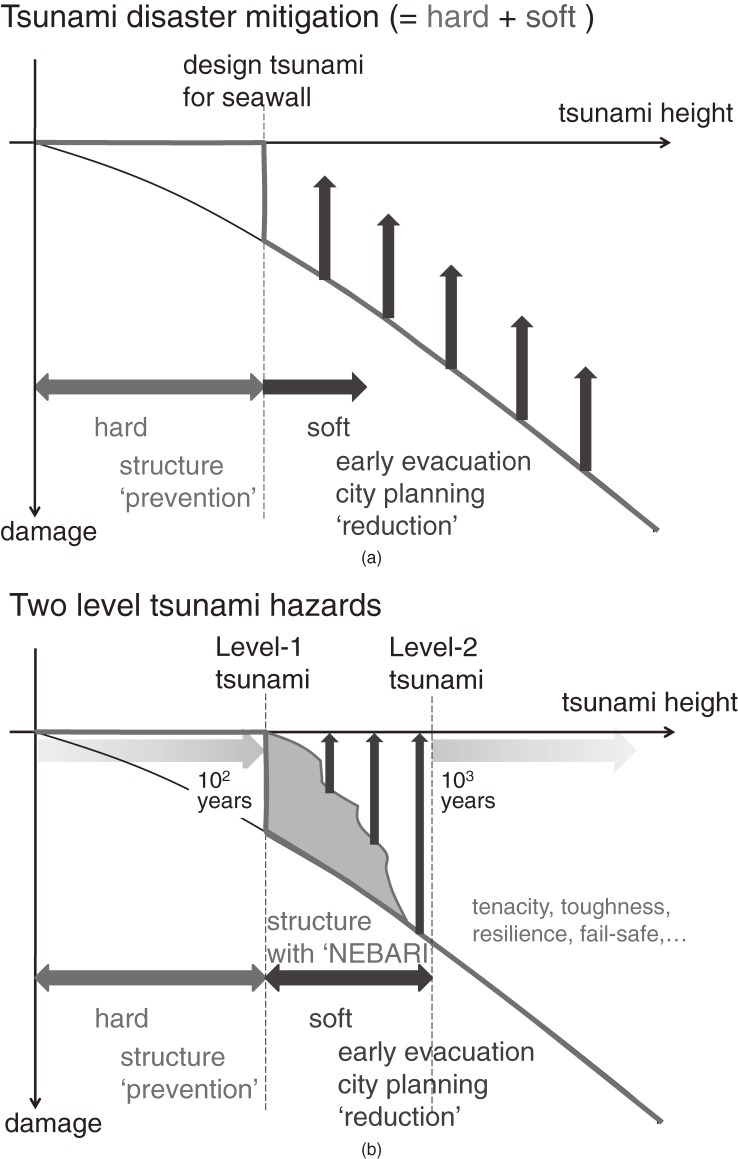
Based on analyses and discussions in academic societies and government institutions, future strategy of tsunami disaster mitigation was established on the basis of two-level tsunami hazards. Figure 9(a) and (b) shows schematic diagrams of conventional and new tsunami disaster mitigation strategies. As described by Shuto and Fujima,1) the tsunami disaster mitigation has been implemented by combining structure-based (hard) countermeasures and non-structure-based (soft) countermeasures. In the conventional mitigation strategy, as illustrated in Fig. 9(a), damage due to tsunami smaller than the design level was minimized by seawalls whose height was determined by the design tsunami level. The importance of soft countermeasures is claimed for the tsunami larger than the design level. However, no specific tsunami height had been proposed for the non-structure-based countermeasures, which resulted in inconsistent evacuation plans implemented from place to place.
Figure 9.
Schematic diagram of tsunami disaster mitigation.
In the new tsunami mitigation scheme, two tsunami levels were introduced as illustrated in Fig. 9(b). The Level-1 tsunami is determined as a frequent tsunami with return period of the order of a hundred years. The Level-1 tsunami is used to design seawalls such that the height of seawalls is decided by numerical tsunami simulation for the Level-1 tsunami. In contrasts, the Level-2 tsunami is determined to represent the maximum possible tsunami and is used to design evacuation plan. The return period of the Level-2 tsunami must be longer than a few hundred years. Flooding cannot be avoided for tsunamis larger than the Level-1 tsunami since such large tsunami will overflow seawalls designed for the lower Level-1 tsunami. It is also important to construct seawalls with the consideration of tsunamis beyond the design level (Level-1). Seawalls should be designed to maintain partial effectiveness even for “beyond-the-design-basis” conditions. This design concept is called “nebari” in Japanese, which implies tenacity, toughness and resilience or never giving up. Establishment of comprehensive disaster mitigation plan is needed to decrease damage for the future tsunami, by combining shore protection plan based on “nebari” structures and non-structure-based early evacuation plan on the basis of two-level tsunami hazards.
Profile
Shinji SATO was born in 1958 and graduated from the Graduate School of Engineering, the University of Tokyo in 1983. He worked as a research associate at Civil Engineering Department and received Dr. Eng. degree in 1987. He then moved to Yokohama National University and worked as an associate professor until 1994. He moved to Public Works Research Institute, Ministry of Construction and worked for the Coast Division until 1999. He then moved to the University of Tokyo and was appointed to a professor in 2000. His major is coastal engineering, especially sediment movement and beach evolution. His research topics include nearshore processes, large-scale long-term coastal evolution, infragravity motion, coastal disaster mitigation against storm surge and tsunami, and sustainability of coastal environment. He has done pioneering works on oscillatory boundary layer flow over bedforms, numerical model development of nonlinear dispersive waves, nearshore currents due to waves and winds, and sediment movement in the watershed scale. He was awarded with Excellent Paper Award of Japan Society of Civil Engineers in 1998, Coastal Engineering Journal Award in 2005 and JSCE Excellent Book Publication Award in 2014. He currently serves as a special advisor of ocean policy to the cabinet.
References
- 1).Shuto N., Fujima K. (2009) A short history of tsunami research and countermeasures in Japan. Proc. Japan Acad., Ser. B 85, 267–275. [DOI] [PMC free article] [PubMed] [Google Scholar]
- 2).TTJS (Tohoku Tsunami Joint Survey Group, 2011): Tsunami survey database, http://www.coastal.jp/tsunami2011/, referred on January 2015.
- 3).Mori, N. and The 2011 Tohoku Earthquake Tsunami Joint Survey Group (2011) Overview of the 2011 Tohoku earthquake tsunami survey results. Proc. Asian and Pacific Coasts 2011 (APAC2011), No. 7, World Scientific, Singapore, pp. 71–78. [Google Scholar]
- 4).Tsunami Joint Survey Group Photo Archive (2013) http://grene-city.csis.u-tokyo.ac.jp/, referred on January 2015.
- 5).Japan Tsunami Trace Database (2015) http://tsunami-db.irides.tohoku.ac.jp/, referred on March 2015.
- 6).Minoura K., Imamura F., Sugawara D., Kono Y., Iwashita T. (2001) The 869 Jogan tsunami deposit and recurrence interval of large-scale tsunami on the Pacific coast of northeast Japan. J. Nat. Disast. Sci. 23, 83–88. [Google Scholar]
- 7).Satake, K., Namegaya, Y. and Yamaki, S. (2008) Numerical simulation of the AD 869 Jogan tsunami in Ishinomaki and Sendai plains. Annual Report on Active Fault and Paleoearthquake Researches. No. 8, pp. 71–89 (in Japanese).
- 8).Satake K., Sakai S., Fujii Y., Shinohara M., Kanazawa T. (2011) Tsunami source of 2011 Tohoku Earthquake, Kagaku 81, 0407–0410 (in Japanese). [Google Scholar]
- 9).Sato, S., Takewaka, S., Liu, H. and Nobuoka, H. (2012) Tsunami damages of Nakoso Coast due to the 2011 Tohoku Tsunami, Proc. 33rd Intl. Conf. on Coastal Engineering, Santander, doi:10.9753/icce.v33.currents.2. [Google Scholar]
- 10).Sato, S., Yeh, H., Isobe, M., Mizuhashi, K., Aizawa, H. and Ashino, H. (2013) Coastal and nearshore behaviors of the 2011 Tohoku Tsunami along the central Fukushima Coast. Proc. Coastal Dynamics, Bordeaux, pp. 1461–1472. [Google Scholar]
- 11).Sato S., Okayasu A., Yeh H., Fritz H.M., Tajima Y., Shimozono T. (2014) Delayed survey of the 2011 Tohoku Tsunami in the former exclusion zone in Minami-Soma, Fukushima Prefecture. Pure Appl. Geophys. 171, 3229–3240. [Google Scholar]
- 12).Kato F., Suwa Y., Watanabe K., Hatogai S. (2013) Damages to shore protection facilities induced by the Great East Japan Earthquake Tsunami. J. Disast. Res. 8, 612–625. [Google Scholar]
- 13).Fujii Y., Satake K., Sakai S., Shinohara M., Kanazawa T. (2011) Tsunami source of the 2011 off the Pacific coast of Tohoku Earthquake. Earth Planets Space 63, 815–820. [Google Scholar]
- 14).Kawai H., Satoh M., Kawaguchi K., Seki K. (2013) Characteristics of the 2011 Tohoku Tsunami waveform acquired around Japan by NOWPHAS equipment. Coast. Eng. J. 55, 1350008, DOI: 10.1142/S0578563413500083. [Google Scholar]


