

Abstract
Tumors are the result of accumulated genomic alterations that cooperate synergistically to produce uncontrollable cell growth. Although identifying recurrent alterations among large collections of tumors provides a way to pinpoint genes that endow a selective advantage in oncogenesis and progression, it fails to address the genetic interactions behind this selection process. A non-random pattern of co-mutated genes is evidence for selective forces acting on tumor cells that harbor combinations of these genetic alterations. Although existing methods have successfully identified mutually exclusive gene sets, no current method can systematically discover more general genetic relationships. We develop Genomic Alteration Modules using Total Correlation (GAMToC), an information theoretic framework that integrates copy number and mutation data to identify gene modules with any non-random pattern of joint alteration. Additionally, we present the Seed-GAMToC procedure, which uncovers the mutational context of any putative cancer gene. The software is publicly available. Applied to glioblastoma multiforme samples, GAMToC results show distinct subsets of co-occurring mutations, suggesting distinct mutational routes to cancer and providing new insight into mutations associated with proneural, proneural/G-CIMP, and classical types of the disease. The results recapitulate known relationships such as mutual exclusive mutations, place these alterations in the context of other mutations, and find more complex relationships such as conditional mutual exclusivity.
Keywords: genomics, sequencing, entropy, copy number, cancer, cancer genetics
Introduction
Tumors are known to evolve by acquiring genetic lesions. Each mutation creates a cellular state uniquely predisposed to thrive with the addition of further specific survival abilities (Hanahan and Weinberg, 2011). Recent studies have successfully exploited the selective pressures on developing tumors to rank important cancer genes by mutational recurrence across compendiums of tumor samples (Beroukhim et al., 2007; Mermel et al., 2011; Lawrence et al., 2013). But approaches that score each gene individually ignore the known effects of mutational context on selection. Tumor survival can be promoted by damage to only one of a set of alternate genes in a pathway (mutual exclusivity of aberration), while other genetic changes only provide a selective advantage to a cancer in a given mutational context (co-occurrence of aberration). For example, in melanoma, BRAF gain-of-function mutations occur in 40% of patients and NRAS mutations in 25%, but these two members of the MAPK pro-growth pathway almost never co-occur, either because of lack of selective advantage to further disruption of the MAPK pathway, or because such co-mutation proves deleterious (Davies et al., 2002). Despite their frequency, MAPK-activating mutations alone are an evolutionary dead end for the cancer, resulting in cell senescence (Michaloglou et al., 2005). Cancer progression also requires disruption of a tumor suppressor function such as CDKN2A (Michaloglou et al., 2005). This example shows that complex patterns of mutual exclusivity and co-occurrence of mutation, thus far identified in a piecemeal fashion, are to be expected across cancer cases. Additionally, the observed mutational relationships of genes, and thus the context in which a genetic aberration is of benefit to tumor development, can provide insight into the functions of genes that are altered in cancer.
However, most approaches seeking relationships between cancer mutation events focus on mutually exclusive lesions, reasoning that this pattern may reflect underlying pathways (Miller et al., 2011; Vandin et al., 2012; Leiserson et al., 2013; Szczurek and Beerenwinkel, 2014). But these methods will miss other relationships between mutations, such as co-occurrence. Additionally, the assumption that different genes in the same pathway are interchangeable is a strong claim. Combinations of genes have been found to jointly predict cancer phenotype (Varadan and Anastassiou, 2006; Mo et al., 2013), but, to our knowledge, no unsupervised method exists for finding related genetic alterations.
A different approach has been developed to scan for representation of dysregulated genes within gene sets known to be functionally related. Recent studies have found pathways predicted to be perturbed by differential gene expression (Tarca et al., 2009), or mutation (Boca et al., 2010), or when multiple sources of information on gene activity are integrated (Vaske et al., 2010). Other methods have used graph topology to find functional interaction sub-networks enriched in mutated genes (Cerami et al., 2010; Wu et al., 2010; Vandin et al., 2011; Hofree et al., 2013), or to identify cliques of genes with mutually exclusive mutational occurrence (Ciriello et al., 2011). These approaches have the advantage of being able to use diverse genome-wide alteration information and provide a biological context for the patterns discovered, but they rely on known gene interactions and on narrow definitions of gene interaction.
We propose a method that integrates copy number and point mutation information, does not require prior functional information, and can find any structured module of genes, rather than only mutually exclusive alterations. The method, Genomic Alteration Modules using Total Correlation (GAMToC), selects a gene set with high total correlation. Total correlation measures the difference between the joint uncertainty, or entropy, of a set of variables (genes), as compared to their individual uncertainties. When there is no joint relationship between the variables, the difference will vanish. On the other hand, a high total correlation suggests a joint relationship among the variables, which is not necessarily linear. Because our method can detect any sort of dependency between the variables, it is sensitive to unexpected varieties of gene interactions. It does not require the assumption that different alterations to the same pathway are more or less interchangeable, and it is not restricted to finding genes only in the same pathway. Instead, the genomic data can lead us to the combination of functional changes that are cooperating in the cancer. We present two implementations of GAMToC, one that uses a greedy method to find a single module starting from a pair of related genes, and another that uses a simulated annealing (SA) method to find the highest-scoring gene set. We examine the speed of the two implementations as compared to exhaustive search, and we evaluate their sensitivity in simulated data. Then, we apply the method to glioblastoma multiforme (GBM) copy number and mutation data from The Cancer Genome Atlas (TCGA). Additionally, in Seed-GAMToC, we make use of the same principles to characterize query genes with a likely, but unclear, role in cancer progression by finding a module that contains genes with a related pattern of selection.
We apply GAMToC to copy number and nucleotide mutation measurements from TCGA glioblastoma project (Cancer Genome Atlas Research Network, 2008), as summarized in Figure 1. We are able to recapitulate known gene interactions, and we additionally recover genes associated with subtypes of glioblastoma. Our results suggest that specific alterations to key cancer pathways are not equivalent; on the contrary, there are clear contexts where functionally related genes are differentially selected for alteration. Thus, our method is uniquely suited to find and characterize genes that are related in cancer development. The software is freely downloadable and can be applied to any copy number and point mutation data set.
Figure 1.

Workflow of GAMToC gene set finding. Genomic alterations (e.g. CNAs and somatic mutations) are integrated to create a binary matrix of samples and genes. The total correlation score compares the entropy of the mutational statuses of individual genes (labeled g1 through g4) against their joint entropy, in effect testing the hypothesis that these gene mutational statuses have a relationship (indicated by the connected network). GAMToC finds sets of mutationally related genes using this score, and we visualize the results in a pairwise correlation network.
Results
Utility of searching for mutually informative gene sets
While many well-characterized cancer driver genes are highly recurrent, more rarely mutated tumor drivers are difficult to identify amidst unstable genomes when using mutational frequency alone. Thus, we must utilize other aspects of the alteration pattern of these genes, such as mutual exclusivity or co-mutation with other genes, keeping in mind that frequency of individual lesions may be low.
As shown in Figure 2A, the number of samples needed to statistically identify mutual exclusivity between a pair of genes grows large when the frequency of mutation is low, and this size is orders of magnitude larger than the number needed to identify co-mutated pairs. This is intuitive, as the expectation is that two infrequent mutations are most likely to have no co-occurrence. When a set of mutually exclusive genes, each with the same low mutational frequency, is instead assessed for a significantly related mutation pattern, the number of samples required to attain significance is much lower (Figure 2B).
Figure 2.
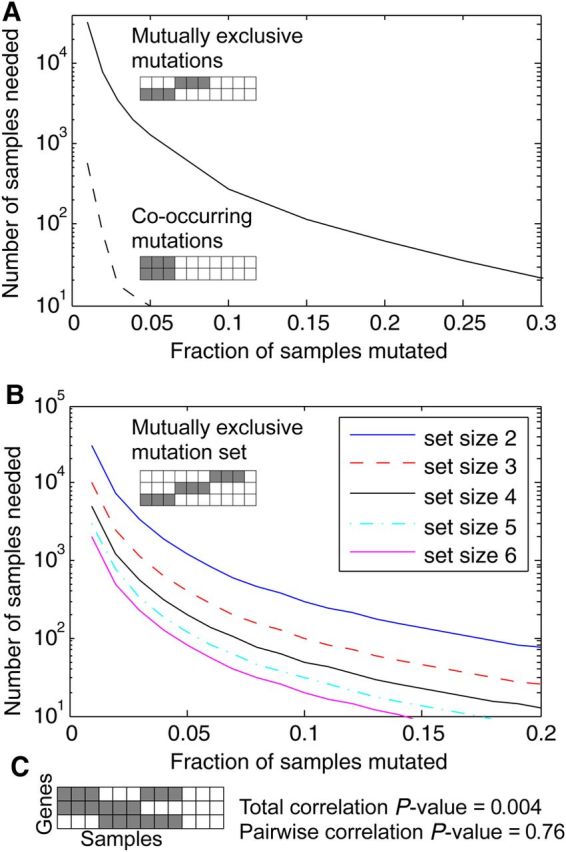
Ability to find multi-gene co-mutational patterns. (A) Finding mutually exclusive pairs of gene mutations requires orders of magnitude more samples as compared with finding co-mutated genes. (B) With a larger set of genes, fewer samples are needed. (C) For an exclusive or triplet pattern, the total correlation is strong, but a pairwise correlation or anti-correlation score would fail to detect a relationship.
Additionally, multi-gene patterns may exist other than mutual exclusivity or co-occurrence. An example would be an ‘exclusive or’ triplet of genes where lesion of any two of the genes is enough to change a phenotype, and the third adds no further advantage. As shown in Figure 2C, the total correlation of this three-gene pattern is highly significant, but the genes display no mutual exclusivity or co-occurrence pattern.
Evaluation of greedy and SA algorithms
We have implemented two methods that integrate copy number and point mutation data to find sets of genes with high total correlation, both taking different approaches to finding patterns in this data set. The greedy method finds a module by starting from the pair of genes with the strongest mutual information, iteratively adding the gene that creates the best score. On the other hand, the SA method allows us to explore the broader landscape of modules in order to find an optimal solution. In general, SA methods semi-randomly sample possible solutions to a hard problem, sampling those with the better scores (objective function) more often. Our application of SA samples combinations of genes with high total correlation, and it can find a solution with a higher score. A detailed description can be found in the Materials and methods.
First, we compared the running time of our implementations against each other and against an exhaustive method. We create a simulated data set containing 100 genes and 100 samples. As shown in Figure 3A, time complexity of the exhaustive method increases exponentially with module size, while the greedy method will finish in tens of seconds and the SA method will finish in tens of minutes.
Figure 3.

Comparison of different methods in GBM mutation data. (A) Time complexity of SA, Greedy method and Exhaustive method, as compared to the increase of module size. (B) Example of a simulated module (with coverage 50% and noise 5%). (C) The average number of simulated module genes recovered (out of the full six gene module) across 100 simulations. The SA method has better recovery than the greedy method, but both recover five of the six genes on average at 50% or more coverage.
To evaluate the accuracy of the greedy and SA approximations, we randomly generate an embedded module in randomly simulated data, as described in the Materials and methods. This simulated module has a six-gene pattern including an exclusive or triplet of genes and their negations (Figure 3B), while all other genes are randomly mutated at an exponentially distributed background mutation rate (see Materials and methods). Two simulation parameters are used: coverage and noise. In a larger coverage, most patients contain this pattern for the module genes, while the rest of the patients have a pattern as generated by the background model. Thus, the score of the module genes will be higher and the module will be more readily detected. At each coverage, the noise varies from low noise (on average 1% of the mutation statuses are flipped at random), to high noise (15% of the mutation statuses). We generate the module and the rest of the data 100 times for each setting of the parameters. Then, we assess the average number of genes from the gene set that is recovered by the algorithms, where six genes is the maximum (Figure 3C). Note that in each setting, including low coverage and high noise, at least three of the six module genes are recovered. This shows that our score, as well as our module recovery method, is able to discover the patterns robustly in these settings.
Application of greedy GAMToC to TCGA GBM samples
First, we explore modules of different sizes using only the mutation data, which are much more sparse than copy number data. The resulting mutation matrix contains 256 genes that are mutated in at least 2% of 283 patients with whole exome sequencing. For a module of size 3, the SA method and the greedy method arrive at the same module of mutated genes. Comparing this against the exhaustive method, we find that GAMToC recovers the best module in the data. When module size equals 4, it would take 3.5 days for the exhaustive method to search all modules (Figure 3B).
Notice that while total correlation increases according to the module size, it does not make sense to compare different size modules in terms of total correlation. We use the G-statistics to overcome this issue (refer to Materials and methods for detail), and calculate P-values based on the chi-square distribution for all modules. We find that the five-gene module containing TP53, IDH1, ATRX, RB1, and PTEN is the most large and significant one in this example (Figure 4). In fact, TP53, IDH1, ATRX, RB1 are all significantly positively correlated with each other. PTEN has a significant negative correlation with IDH1, as well as a positive correlation with mutation in RB1.
Figure 4.
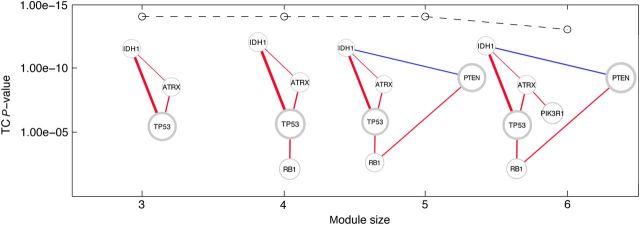
Recovery of different module sizes in only mutation data. The P-value associated with the total correlation is indicated on the y-axis, and the modules for each size are shown. For each size, the same module was found from the greedy and SA methods. Edge colors represent positive and negative correlations between genes. Edge thickness denotes the strength of the association. Node size represents the frequency of alteration. Node border width represents the number of nonsynonymous mutations in that gene.
Next, we apply the greedy algorithm to a set of 273 tumors from the TCGA GBM project that have available copy number and exome sequence. Collating these data results in a mutation matrix of 756 alterations on the 273 samples. The greedy module recovered displays an interesting pattern of pairwise co-occurrence and mutual exclusivity between mutations (Figure 5A). It is important to note that total correlation finds a multi-gene structure of related alterations: as in the ‘exclusive or’ example (Figure 2C), there may not be any strong pairwise relationships in a strong module. However, for visualization purposes, we display the resulting modules in terms of their network of pairwise positive correlations (co-occurrence of a pair of genes) and negative correlations (mutually exclusive mutations). Thus, for the remainder of this work, we provide a pair-based network visualization of the module structure.
Figure 5.

Networks of total correlation modules. The legend is the same as in Figure 4, except for that node color represents average copy number amplification or deletion. (A) The greedy module from glioblastoma. (B) The Seed-GAMToC module, seeded with CDK4. (C) The SA module. (D) The genes from the greedy and SA modules are compared to subtypes of glioblastoma. The darker the shade, the stronger the association (Fisher's exact test) of gene mutation status and that subtype.
We grow a greedy module up to the maximum feasible size, which is eight genes. In the greedy module, patients appear more likely to display mutations that co-occur with TP53, IDH1, and RB1, or that are mutually exclusive with these genes. Patients with mutation or deletion of TP53 are significantly more likely to also have mutations in IDH1 and ATRX, and ATRX and IDH1 as a pair have the highest mutual information in the data set. The deleted and mutated gene RB1 strongly co-occurs with TP53 lesions, though it has no positive correlation with IDH1 or ATRX. Deletion to the terminal section of chromosome 11p, which GISTIC2 (Beroukhim et al., 2007) identifies as peak gene BRSK2, also frequently co-occurs with lesions of TP53 and RB1. The 11p15 region is imprinted, and it is known to be deleted, to undergo loss of heterozygosity and to have differential epigenetic regulation in multiple cancer types (Schwienbacher et al., 2000; Onyango and Feinberg, 2011).
Many of the genes that co-occur with TP53 alteration have a mutually exclusive pairwise relationship with copy number alterations in EGFR, CDKN2A region, or chromosome 10 deletion. The dominant effect of chromosome 10 deletion is likely the inactivation of the tumor suppressor PTEN, which is one of the most prevalent events across tumors. However, it is interesting that a large section of the chromosome is deleted, not just PTEN. The greedy GAMToC selects the GISTIC2 deletion peak on the terminus of 10p, containing ADARB2, as well as IDI1, IDI2, and WDR37. Very importantly, this region has stronger pattern of positive correlation with EGFR deletion, and negative correlation with IDH1 mutation, than does PTEN deletion, explaining its selection by the greedy method. While the full module of eight genes is very interesting, the seven-gene module (removing CDKN2A region) is more statistically significant.
Seeding the greedy algorithm
The greedy method has a disadvantage of performing only a local search for a high-scoring module. It starts from the pair of genes with highest mutual information (pairwise total correlation), and uses a greedy approach to find a module that contains that pair. While we also develop the SA method to find other modules, the greedy method has two advantages for understanding cancer evolution. First, exploring the search space around the pair of genes with the highest mutual information is informative of processes in cancer, as we show above. Second, the greedy algorithm allows us to choose the starting point of the module search, by fixing an initial gene, which we call a seed gene. In this procedure, termed Seed-GAMToC, we identify a local maximum of total correlation that includes that seed gene. First, we find the partner gene for the seed gene, forming a gene-pair with the highest mutual information, and we grow the greedy module from this pair. Thus, we seek to characterize a given gene by finding what module of high total correlation contains that gene, or, in other words, the genetic context in which mutations of that gene appear. Discovering these relationships, such as the genetic context in which disruption of a query gene is advantageous, can illuminate the function of putative cancer genes.
Among the results of cancer genomics studies are frequent mutations in genes with a role in the cancer of interest that is not fully characterized. We run Seed-GAMToC for a number of genes that are significantly mutated or in copy number peaks in GBM patients, but were not selected by the greedy algorithm. We were interested in CDK4 because it is a cell cycle kinase that is focally amplified in GBM, and mutual exclusivity has been observed between amplification of CDK4, deletion to the CDKN2A locus, and deletions and mutations to RB1. We wondered what factors influence this mutual exclusivity, and we ran Seed-GAMToC starting from CDK4 (Figure 5B). In fact, while CDKN2A is mutually exclusive with both CDK4 and RB1, the latter as a pair are not strongly mutually exclusive (chi-square P-value = 0.39). However, in patients with no CDKN2A deletions, their conditional mutual exclusivity is significant (chi-square P-value = 4 × 10⁻⁴). It is interesting that both CDK4 and RB1 have strong co-occurrence with other genes that are also mutually exclusive with CDKN2A. CDK4 co-occurs in patients with mutation to SPTA1, a recurrently mutated member of the spectrin cell scaffolding complex. Mutation to SPTA1 could impact cell adhesion, and mutations to other spectrins have been shown to affect cell cycle regulation (Metral et al., 2009). On the other hand, RB1 co-occurs with TP53 and its correlated genes. CDKN2A can regulate CDK4 and RB1, as well as TP53, explaining this discovery.
Because RB1, CDK4, and CDKN2A all have roles in cell cycle, we also looked at the patterns associated with other cell cycle genes that are significantly mutated. For example, CDK6 plays a similar role in promoting cell cycle progression as CDK4, and, like CDK4, this gene is strongly amplified. Seeding with CDK6, we find a strong correlation with PTEN deletion, and anti-correlation with ATRX and IDH1 mutations (Supplementary Figure 1A). Thus, unlike CDK4, CDK6 may be a beneficial amplification in the context of the mitogenic PI3-kinase pathway, which is deregulated by PTEN deletion or mutation. On the other hand, another mitogenic event, amplification of PIK3C2B (along with its chromosomal neighbor MDM2), seems to cooperate with deletion of RB1 and amplification of the cell cycle promoting amplification MYCN (Supplementary Figure 1B). One final gene closely related to cell cycle regulation is CCNE1, and amplification of this gene is most strongly mutually exclusive with TP53 (Supplementary Figure 1C). One effect of TP53 inactivation is in fact de-repression of CCNE1, and CCNE1 likewise can mediate genetic instability (Hwang and Clurman, 2005). Thus, the module identified by the greedy method is useful for understanding the role of a query gene in glioblastoma development, including closely functionally related genes.
Simulated annealing results consistently identify a high scoring module
The SA algorithm provides an alternate mode of selecting a module, allowing us to more broadly search for a high-scoring module. Unlike the greedy method, SA can escape local maxima and find a higher scoring module. Over the course of the semi-random sampling, the SA undergoes ‘annealing’, becoming more selective for high total correlation modules. A run of SA will eventually converge on one module, but in practical settings, SA will converge on a local optimum. Because there are many more copy number events than nucleotide mutation events, and all alterations are counted equally in GAMToC, the SA is more likely to converge on states involving broader copy number changes, making it somewhat less sensitive to mutational patterns or very focal somatic copy number aberrations than the greedy algorithm. In multiple runs of the SA, one best module was found, which has a higher total correlation score than the greedy module (1.28 as opposed to 1.03), and is extremely statistically significant.
In the SA's best module, a pattern appears related to that of the greedy module, but dominated by copy number changes (Figure 5C). As in the greedy module, the SA module has a set of genes that co-occur with mutation of TP53. This includes, as before, RB1 and BRSK2. Additionally, deletion in chromosome 15, in GISTIC2 peak gene TMCO5A co-occurs with these genes, while another deletion region on chromosome 14 centered on PTPN21 is also associated with some of TP53′s co-occurring partners. Mutually exclusive with TP53 and RB1 mutations is again deletion to the CDKN2A/CDKN2B locus.
Discussion
Our algorithms search for genes with related occurrence of alteration across tumor samples, based on the premise that the joint alteration status of genes in tumor samples can inform us of the evolutionary process behind the cancer. Unlike mutual exclusivity methods that impose a single structure on the data, our approach is able to form a more comprehensive picture of alteration patterns that exist in cancer data. The result of applying GAMToC to the TCGA GBM data is a network of genes with a jointly related mutation pattern, suggesting that the alterations in GBM do in fact follow an underlying structure. The interpretation of the module can be more complex, as opposed to mutual exclusivity, which is often interpreted as representing alternative mutations in a pathway. But one interpretation is that the co-occurring sets of gene lesions represent alternative pathways to glioblastoma development: there are different contexts in which these different lesions provide a selective advantage.
It is important to consider that cross-sectional data, such as is represented in TCGA, is the result of a progressive process of cancer development. Modeling this process is the subject of many studies (Beerenwinkel et al., 2014; Olde Loohuis et al., 2014; Wang et al., 2014). In fact, the results of GAMToC can be thought of as a view into these selective forces as they act across the population of patients. While our goal is not to model the evolutionary relationships of mutation events, the uncovered patterns show collaborating mutations that can only be the result of the genetic context created by sequential somatic mutations.
The interpretation of the sub-module structure as indicating routes to GBM development suggests that patients harboring different sets of mutations may have different characteristics. In fact, this pattern has been observed in the TCGA GBM cohort. Subtypes of glioblastoma have been identified by expression (Verhaak et al., 2010), as well as by methylation (Noushmehr et al., 2010), and these have been related to specific genetic alterations (Brennan et al., 2013). Patients with a methylation profile known as glioblastoma CpG island methylator phenotype (G-CIMP) have better survival, while patients with a gene expression pattern that follows the proneural subgroup have different response to therapy. To support the hypothesis that the GAMToC module is indicative of these types of tumors, we examine whether the GAMToC modules are related to these patient subtypes. We test whether patients with mutations to each module gene are more likely to fall into one of the subtypes. In result, the classical and proneural gene expression subtypes are strongly associated with certain module genes, as is the G-CIMP methylation group (Figure 5D). Thus, our approach successfully captures biological differences between patient groups, as reflected in different patterns of genetic lesions.
The classical subtype typically has co-occurring mutations in EGFR and CDKN2A. Mouse models have suggested that activation of EGFR can cooperate with loss of the CDKN2A locus and PTEN to generate gliomas with high resemblance to GBM (Zhu et al., 2009). However, rather than PTEN, the chromosome 10 deletions of ADARB2 are selected by GAMToC. This region is strongly co-deleted with PTEN (chi-squared P-value = 3.7 × 10⁻²⁵), since in many cases of PTEN deletion most of chromosome 10 is deleted. However, ADARB2, IDI1, IDI2, and WD47 have a stronger pairwise pattern with the other module genes chosen by GAMToC. Additionally, patients with this deletion are significantly more likely to fall into the classical expression subtype (chi-squared P-value = 0.029), while PTEN is weakly associated with the mesenchymal subtype (P-value = 0.086). Thus EGFR amplification, chromosome 9 deletion of CDKN2A and CDKN2B, and ADARB2 locus deletion (including IDI1, IDI2, and WDR37) are all negatively correlated with TP53 and are all associated with the classical expression profile.
In contrast to the better understood classical subtype of GBM, the IDH1-p53 network associated with G-CIMP and with proneural groups has been long studied but has so far remained of uncertain significance for tumor initiation in the brain. The strong co-occurrence of TP53 alterations with deletions of 11p15 (BRSK2) and 15q14 (TMCO5A) is an exciting novel finding. While TP53, IDH1, ATRX, and BRSK2 are all highly associated with G-CIMP, TP53 and BRSK2 are also strongly associated with proneural status. BRSK2 is particularly intriguing because it is a kinase that is highly expressed in brain and may be involved in apoptotic stress response (Wang et al., 2012) and cell cycle regulation (Li et al., 2012). Proneural tumors are also strongly associated with TMCO5A deletion, a lesion that, distinctively, is not associated with G-CIMP tumors. The genes in these regions may provide the missing element to recapitulate the gliomagenic process in these tumors.
It is also interesting to compare our modules with modules of mutually exclusive genes. Methods to find patterns of mutual exclusivity, such as MeMo (Ciriello et al., 2011) or DENDRIX (Leiserson et al., 2013), have pointed out genes also selected by GAMToC. These methods sometimes claim to find new pathway interactions in this manner, exemplified by the mutual exclusivity between CDKN2A, CDK4, and RB1, or between CDKN2A and TP53. But GAMToC's ability to find other relationships between mutations shows that the mutual exclusivity is related to the subtype-specific nature of mutations. It is very interesting to focus on the example of the retinoblastoma pathway, which can integrate signals from the mitogenic pathways (PI3-kinases, PTEN) and DNA damage (TP53), among others. We find that mutations to the DNA damage (TP53), cell cycle (RB1), and mitogenic (PTEN) pathways are prevalent across the glioblastomas, but that different specific alterations seem to confer subtle advantages in different mutational backgrounds. In Supplementary Figure 2, we outline the subtype associations of genetic alterations affecting these pathways. For example, TP53 and RB1, as well as CDK4, are advantageous for G-CIMP and proneural tumors, while CDKN2A is a dominant lesion in classical glioblastomas, and CCNE1, and CDK6 also occur less frequently in the proneural tumors. Highly functionally related genetic alterations have been suggested to have similar effects. In the case of CDKN2A (p16) and TP53, both lesions alter DNA damage response, while cell cycle regulation is transformed by mutations to CDKN2A, CDK4, CDK6, CCNE1, and RB1. However, far from the simplifying assumption that mutually exclusive events represent alternative equivalent routes to cancer development, clearly there are subtleties resulting in subtype-specific mutations. The data imply that mutations to genes in the same pathway are not in fact interchangeable.
More generally, our results also provide insight into the nature of subtype-specific lesions. As the method will detect any non-random pattern of alteration in a collection of samples, the resulting module may contain genes that are co-mutated, because they are both present in tumors of the same subtype or environmental condition, rather than because of any direct functional interaction. While patterns of joint lesion status do not allow us to distinguish between these two conditions, our results show that genetic context has a strong influence on selection. Thus, the distinction between subtype-specific co-alteration versus synergistic co-alteration may be thought of as a matter of the degree of selective advantage, rather than as two different phenomena. In conclusion, we have developed a method to uncover novel relationships between genes that are key to cancer development, and we have related the findings to previous subtypes of glioblastoma. Understanding the combination of genetic alterations present in patients with a tumor will help to target therapies to their pattern of aberrations. This application is an example of the power of a generalized entropy-based approach to gene set recovery.
Materials and methods
Preprocessing genetic aberration data
Currently the GAMToC algorithm can start from assessments of sample copy number aberrations and from nucleotide variant calls resulting from whole exome sequencing (WES) data. For the TCGA GBM data, we downloaded processed data from the Broad Institute Firehose (http://www.broadinstitute.org/cancer/cga/Firehose) download data set of 9/23/2013. This includes mutation calls, GISTIC2 results, and thresholded calls of copy number status per gene per tumor. Both copy number and matching WES data were available for 273 GBM patients.
For copy number data, we remove calls in regions of copy number polymorphism, as called by the Broad Institute pipelines, and we keep only copy number alterations in genes that are in called GISTIC2 peaks. For the nucleotide variant calls, we record any gene with a somatic nonsynonymous mutation as mutated in the patient. The result of this initial step is a binary matrix of patients and genes that marks patients as having a mutation in a gene.
We combine the two matrices in an ‘or’ gate fashion. Finally, we merge genes on the same chromosome that are altered in exactly the same samples into a single unit. It is important to note that copy number aberrations are usually not focal events targeting a single driver gene, and in fact often involve entire chromosomes. Thus, even distant genes on the same chromosome, as another gene already included in the module, will score as the best candidates for module inclusion, although this does not reflect any functionally interesting genetic interaction. In order to remove this bias, we do not allow any module to contain more than one gene from the same chromosome.
Scoring the module
Our aim is to find the most mutually informative set of genes, using the total correlation score:
To find the significance of this value, we apply the G-test as follows.
As an extension of the deduction for Mutual information in (Goebel et al., 2005), we can reformulate the total correlation formula as
where O3 is the Taylor series remainder term of order 3; is the observed number of events, and is the expected number of events. According to chi-square test, approximately follows a chi-squared distribution, with degree of freedom (Kullback, 1968) (correct only when the number of samples is bigger than 2n). To give an example of the calculation of the degrees of freedom, if we have two genes in the module, there are four possibilities: mutated–mutated, non mutated–mutated, mutated–non mutated, and non mutated–non mutated. That can be seen as a 2 by 2 contingency table, which has 22 = 4 cells with 3 constraints (the number of mutations per each of two genes, and the total number of samples). Following the formula, the degrees of freedom is 22 − 2–1 = 1.
Actually, total correlation is a special case of the G-test. In statistics, G-tests are formulated as
where Oi is the observed distribution (frequency), and Ei is the expected distribution based on null assumption. It can be proved that G approximately follows a chi-squared distribution (Sokal and Rohif, 1981).
It is important to mention that the number of samples is important to the approximation of the distribution of total correlation. As shown in Supplementary Figure 3, we simulate five independent variables with different number of samples ranging from 2 to 100. The theoretical value approaches simulation results very well when the number of sample is larger than 20, but the G-test fails when sample size is small. Therefore in our application of our total correlation method, if the number of samples is larger than , we can use the G-test. Otherwise, we must use a permutation method to calculate the P-values.
Thus, we also use the G-test to determine the maximum module size that can be measured given the number of samples. The number of possible module states increases exponentially with the number of genes in the module. We are limited by the number of samples available in order to observe the frequency of each of these module states. Yet, the greater the number of genes in the module, the more complex non-pairwise relationships can be observed. Therefore, we limit our maximum module size to the size where the total correlation can be modeled by the G-test, as described above. An additional limitation is possible, which is to limit the module size by the P-value attained, as described in (Liu et al., 2011). We provide both total correlation and P-value, using the G-test.
Module selection
The greedy method starts from the pair of genes with the highest mutual information. To grow the module from this initial pair of genes, we then test each other remaining gene to find one, which, together with the existing gene set, will create a set with the highest total correlation. If no module is found at a greater significance level than 0.05 divided by the number of genes remaining in the module, growth is terminated. We continue to add genes until reaching the maximum module size, as described in the previous section. If the module resulting is no longer significant, at a nominal P-value of 0.05, then the module growth terminates before the maximum size is reached.
The goal of the SA method is to sample modules of genes in proportion to the total correlation of the modules. The GAMToC SA starts from any initial gene set of a selected size. We use the maximum feasible module size for G-test calculations, given our sample size. For the GBM combined copy number and whole exome data set of 273 tumors, this is a module of eight genes. The chain continues at each iteration by randomly choosing a gene from the module and replacing it with another gene chosen at random from the non-module genes. If the score of the module is improved by this replacement, then the replacement is retained. If instead the new gene creates a decreased total correlation, the module change has a probability of being retained (paccept), according to the change of the total correlation. We define log (paccept) as proportional to the change of total correlation, with a proportionality constant that we defined as 1/temp.
The temperature starts as ‘hot’, such that a small decrease in total correlation results in a likely probability of acceptance. The temperature continues to decrease by a percentage after a minimum number of iterations and a minimum number of changes to the module. After the change is retained or discarded, the resulting module is the next state in the chain. If the annealing process stops for a certain number of iterations, representing a local maximum, it will restart at the highest total correlation module that was reached in the course of the annealing, representing a global maximum over the previous iterations. The process continues at the current temperature. The restarts will continue until the annealing converges: the local maximum is also the global maximum. Thus, a lack of improvement in the total correlation score provides our stopping criterion. The final highest total correlation module is our solution.
Simulation of module and assessment of results
For the simulation, we chose to create a data set of 100 genes and 100 patients, and we embedded a six-gene module in this data set. Thus, each simulation creates a binary matrix of gene mutations per patient. For the embedded module, the simulation uses a parameter specifying the fraction C of the patients that are covered in the module pattern, where the rest of the patients have no module pattern. The other parameter specifies random noise N added to the module genes.
First, we simulate the background mutations for independently mutated genes. On average in the glioblastoma data, each gene is mutated in 12.9 samples, with a steep decline in number of genes with higher mutation rates. Thus, we sample from an exponential distribution, with this empirical value as the distribution parameter, to simulate the background mutation rate for each gene, and then we generate the mutations for each patient for each gene according to that gene's simulated mutation rate. Then, we embed in this data set a module covering C patients. We generate an exclusive or triplet for the first three genes by using a multinomial distribution, based on the mutation frequencies of the three genes, to pick which two of the three would be mutated for each covered patient. The final three genes are the negation of the first three genes. Then, according to the noise, N% of the module bits are flipped.
For each simulation, the greedy module and the SA module are assessed. And we compare how many of the six genes are recovered in each of the 100 simulations for each parameter setting.
Comparison of recovered module to random permutations
In order to estimate how likely it is to recover a module of the observed total correlation, we compare the result observed in the true data to the recovered modules from randomly permuted versions of the data. We permute the patients containing each mutation. Over the course of 100 permutations, no permutation has a recovered module that attains the total correlation of the module in the true data, indicating a false discovery rate under 1%. Additionally, no random data module attains any significance beyond a size of six genes, while the observed data contains a module of eight genes, the maximum size that can be observed. In Supplementary Figure 4, the results of the random permutations are shown.
Comparison to tumor classifications
Tumor classification performed by the TCGA in (Brennan et al., 2013) was downloaded from http://tcga-data.nci.nih.gov/docs/publications/gbm_2013/supplement/Molecular_subtype_classification.xlsx. Of the patients included in our study, 233 were classified in that work. We compared these classifications with mutation status of each module gene, in order to assess whether the mutations were markers of GBM subtypes.
Software availability
The software and pre-processed data used are available at http://sourceforge.net/p/melamedgamtoc.
Data source
The results published here are in whole or part based upon data generated by TCGA pilot project established by the NCI and NHGRI. Information about TCGA and the investigators and institutions who constitute the TCGA research network can be found at http://cancergenome.nih.gov/.
Supplementary material
Supplementary Material is available at Journal of Molecular Cell Biology online.
Funding
This work was funded in part by 1R01CA185486-01, 1 R01 CA179044-01A1, NIH P50 MH094267-01, and NIH 1 U54 CA121852-05. J.W. is also supported by Precision Medicine Fellowship (UL1 TR000040).
Conflict of interest: none declared.
Supplementary Material
References
- Beerenwinkel N., Schwarz R.F., Gerstung M., et al. (2014). Cancer evolution: mathematical models and computational inference. Syst. Biol. 64, e1–e25. [DOI] [PMC free article] [PubMed] [Google Scholar]
- Beroukhim R., Getz G., Nghiemphu L., et al. (2007). Assessing the significance of chromosomal aberrations in cancer: methodology and application to glioma. Proc. Natl Acad. Sci. USA 104, 20007–20012. [DOI] [PMC free article] [PubMed] [Google Scholar]
- Boca S.M., Kinzler K.W., Velculescu V.E., et al. (2010). Patient-oriented gene set analysis for cancer mutation data. Genome Biol. 11, R112. [DOI] [PMC free article] [PubMed] [Google Scholar]
- Brennan C.W., Verhaak R.G.W., McKenna A., et al. (2013). The somatic genomic landscape of glioblastoma. Cell 155, 462–477. [DOI] [PMC free article] [PubMed] [Google Scholar]
- Cancer Genome Atlas Research Network. (2008). Comprehensive genomic characterization defines human glioblastoma genes and core pathways. Nature 455, 1061–1068. [DOI] [PMC free article] [PubMed] [Google Scholar]
- Cerami E., Demir E., Schultz N., et al. (2010). Automated network analysis identifies core pathways in glioblastoma. PLoS One 5, e8918. [DOI] [PMC free article] [PubMed] [Google Scholar]
- Ciriello G., Cerami E.G., Sander C., et al. (2011). Mutual exclusivity analysis identifies oncogenic network modules. Genome Res. 22, 398–406. [DOI] [PMC free article] [PubMed] [Google Scholar]
- Davies H., Bignell G.R., Cox C., et al. (2002). Mutations of the BRAF gene in human cancer. Nature 417, 949–954. [DOI] [PubMed] [Google Scholar]
- Goebel B., Dawy Z., Hagenauer J., et al. (2005). An approximation to the distribution of finite sample size mutual information estimates. IEEE Int. Conf. Commun. 2, 1102–1106. [Google Scholar]
- Hanahan D., Weinberg R.A. (2011). Review Hallmarks of cancer: the next generation. Cell 144, 646–674. [DOI] [PubMed] [Google Scholar]
- Hofree M., Shen J.P., Carter H., et al. (2013). Network-based stratification of tumor mutations. Nat. Methods 10, 1108–1115. doi:10.1038/nmeth.2651. [DOI] [PMC free article] [PubMed] [Google Scholar]
- Hwang H.C., Clurman B.E. (2005). Cyclin E in normal and neoplastic cell cycles. Oncogene 24, 2776–2786. [DOI] [PubMed] [Google Scholar]
- Kullback S. (1968). Information Theory and Statistics (2nd edn). New York: Dover Publications, Inc. [Google Scholar]
- Lawrence M.S., Stojanov P., Polak P., et al. (2013). Mutational heterogeneity in cancer and the search for new cancer-associated genes. Nature 499, 214–218. [DOI] [PMC free article] [PubMed] [Google Scholar]
- Leiserson M.D.M., Blokh D., Sharan R., et al. (2013). Simultaneous identification of multiple driver pathways in cancer. PLoS Comput. Biol. 9, e1003054. [DOI] [PMC free article] [PubMed] [Google Scholar]
- Li R., Wan B., Zhou J., et al. (2012). APC/C(Cdh1) targets brain-specific kinase 2 (BRSK2) for degradation via the ubiquitin-proteasome pathway. PLoS One 7, e45932. [DOI] [PMC free article] [PubMed] [Google Scholar]
- Liu Z.-P., Wang Y., Zhang X.-S., et al. (2011). Detecting and analyzing differentially activated pathways in brain regions of Alzheimer's disease patients. Mol. Biosyst. 7, 1441–1452. [DOI] [PubMed] [Google Scholar]
- Mermel C.H., Schumacher S.E., Hill B., et al. (2011). GISTIC2.0 facilitates sensitive and confident localization of the targets of focal somatic copy-number alteration in human cancers. Genome Biol. 12, R41. [DOI] [PMC free article] [PubMed] [Google Scholar]
- Metral S., Machnicka B., Bigot S., et al. (2009). AlphaII-spectrin is critical for cell adhesion and cell cycle. J. Biol. Chem. 284, 2409–2418. [DOI] [PubMed] [Google Scholar]
- Michaloglou C., Vredeveld L.C.W., Soengas M.S., et al. (2005). BRAFE600-associated senescence-like cell cycle arrest of human naevi. Nature 436, 720–724. [DOI] [PubMed] [Google Scholar]
- Miller C.A., Settle S.H., Sulman E.P., et al. (2011). Discovering functional modules by identifying recurrent and mutually exclusive mutational patterns in tumors. BMC Med. Genomics 4, 34. [DOI] [PMC free article] [PubMed] [Google Scholar]
- Mo Q., Wang S., Seshan V.E., et al. (2013). Pattern discovery and cancer gene identification in integrated cancer genomic data. Proc. Natl Acad. Sci. USA 110, 4245–4250. [DOI] [PMC free article] [PubMed] [Google Scholar]
- Noushmehr H., Weisenberger D.J., Diefes K., et al. (2010). Identification of a CpG island methylator phenotype that defines a distinct subgroup of glioma. Cancer Cell 17, 510–522. [DOI] [PMC free article] [PubMed] [Google Scholar]
- Olde Loohuis L., Caravagna G., Graudenzi A., et al. (2014). Inferring tree causal models of cancer progression with probability raising. PLoS One 9, e108358. [DOI] [PMC free article] [PubMed] [Google Scholar]
- Onyango P., Feinberg A.P. (2011). A nucleolar protein, H19 opposite tumor suppressor (HOTS), is a tumor growth inhibitor encoded by a human imprinted H19 antisense transcript. Proc. Natl Acad. Sci. USA 108, 16759–16764. [DOI] [PMC free article] [PubMed] [Google Scholar]
- Schwienbacher C., Gramantieri L., Scelfo R., et al. (2000). Gain of imprinting at chromosome 11p15, A pathogenetic mechanism identified in human hepatocarcinomas. Proc. Natl Acad. Sci. USA 97, 5445–5449. [DOI] [PMC free article] [PubMed] [Google Scholar]
- Sokal R.R., Rohif F.J. (1981). Biometry: the Principles and Practice of Statistics in Biological Research (2nd edn). New York: W.H. Freeman and Company. [Google Scholar]
- Szczurek E., Beerenwinkel N. (2014). Modeling mutual exclusivity of cancer mutations. PLoS Comput. Biol. 10, e1003503. [DOI] [PMC free article] [PubMed] [Google Scholar]
- Tarca A.L., Draghici S., Khatri P., et al. (2009). A novel signaling pathway impact analysis. Bioinformatics 25, 75–82. [DOI] [PMC free article] [PubMed] [Google Scholar]
- Vandin F., Upfal E., Raphael B.J. (2011). Algorithms for detecting significantly mutated pathways in cancer. J. Comput. Biol. 18, 507–522. [DOI] [PubMed] [Google Scholar]
- Vandin F., Upfal E., Raphael B.J. (2012). De novo discovery of mutated driver pathways in cancer. Genome Res. 22, 375–385. [DOI] [PMC free article] [PubMed] [Google Scholar]
- Varadan V., Anastassiou D. (2006). Inference of disease-related molecular logic from systems-based microarray analysis. PLoS Comput. Biol. 2, e68. [DOI] [PMC free article] [PubMed] [Google Scholar]
- Vaske C.J., Benz S.C., Sanborn J.Z., et al. (2010). Inference of patient-specific pathway activities from multi-dimensional cancer genomics data using PARADIGM. Bioinformatics 26, i237–i245. [DOI] [PMC free article] [PubMed] [Google Scholar]
- Verhaak R.G.W., Hoadley K.A., Purdom E., et al. (2010). Integrated genomic analysis identifies clinically relevant subtypes of glioblastoma characterized by abnormalities in PDGFRA, IDH1, EGFR, and NF1. Cancer Cell 17, 98–110. [DOI] [PMC free article] [PubMed] [Google Scholar]
- Wang Y., Wan B., Li D., et al. (2012). BRSK2 is regulated by ER stress in protein level and involved in ER stress-induced apoptosis. Biochem. Biophys. Res. Commun. 423, 813–818. [DOI] [PubMed] [Google Scholar]
- Wang J., Khiabanian H., Rossi D., et al. (2014). Tumor evolutionary directed graphs and the history of chronic lymphocytic leukemia. ELife 3, e02869. [DOI] [PMC free article] [PubMed] [Google Scholar]
- Wu G., Feng X., Stein L. (2010). A human functional protein interaction network and its application to cancer data analysis. Genome Biol. 11, R53. [DOI] [PMC free article] [PubMed] [Google Scholar]
- Zhu H., Acquaviva J., Ramachandran P., et al. (2009). Oncogenic EGFR signaling cooperates with loss of tumor suppressor gene functions in gliomagenesis. Proc. Natl Acad. Sci. USA 106, 2712–2716. [DOI] [PMC free article] [PubMed] [Google Scholar]
Associated Data
This section collects any data citations, data availability statements, or supplementary materials included in this article.