

Abstract
The medial prefrontal cortex is thought to be important for guiding behavior according to an animal's expectations. Efforts to decode the region have focused not only on the question of what information it computes, but also how distinct circuit components become engaged during behavior. We find that the activity of regular-firing, putative projection neurons contains rich information about behavioral context and firing fields cluster around reward sites, while activity among putative inhibitory and fast-spiking neurons is most associated with movement and accompanying sensory stimulation. These dissociations were observed even between adjacent neurons with apparently reciprocal, inhibitory–excitatory connections. A smaller population of projection neurons with burst-firing patterns did not show clustered firing fields around rewards; these neurons, although heterogeneous, were generally less selective for behavioral context than regular-firing cells. The data suggest a network that tracks an animal's behavioral situation while, at the same time, regulating excitation levels to emphasize high valued positions. In this scenario, the function of fast-spiking inhibitory neurons is to constrain network output relative to incoming sensory flow. This scheme could serve as a bridge between abstract sensorimotor information and single-dimensional codes for value, providing a neural framework to generate expectations from behavioral state.
Keywords: anterior cingulate cortex, coding, inhibition, motivation, rat
Introduction
The medial frontal cortex may contribute to a wide range of cognitive and behavioral functions, and efforts to examine the mechanisms of these functions have linked the activity of single neurons to an extensive set of cognitive and behavioral variables. Converging evidence suggests that dorsal regions of the rodent medial frontal cortex, including dorsal regions of the prelimbic cortex, the dorsal anterior cingulate cortex, and the medial precentral cortex, can influence movement according to expected outcomes (reviewed in Rushworth et al. 2004). Consistent with this, neuron firing rates in the region have been linked to variables that include movement, reward, and their combination (e.g., Cowen and McNaughton 2007; Hillman and Bilkey 2010; Sul et al. 2010). Single neurons in the region typically code not for one variable, but for many variables to varying degrees (Chapin and Nicolelis 1999; Rigotti et al. 2013); thus, the use of multidimensional, population-level analyses have been instrumental in revealing firing patterns related to decisions, outcomes, and the stages in between (Laubach et al. 1999; Fujisawa et al. 2008; Narayanan and Laubach 2009; Benchenane et al. 2010; Durstewitz et al. 2010; Machens 2010; Karlsson et al. 2012; Hyman et al. 2013). As a whole, the physiological investigations have established that the medial frontal cortex contains a rich conjunctive code of an animal's behavioral context that may provide an associative scaffold for dynamically changing expectations (a view that is implicit to theories such as described by Frankland and Bontempi 2005; Euston et al. 2007; Tse et al. 2007). Understanding how this code works and how it may guide action will require a better understanding of the underlying circuit dynamics during behavior.
Multiple recent studies have used molecular identification methods combined with electrophysiology to examine the relationships between specific neuron types in the medial frontal cortex and behavior. For example, Kvitsiani et al. (2013) found that fast-spiking neurons expressing the calcium-binding protein parvalbumin were most likely to fire as mice exited a reward zone. Courtin et al. (2014) observed decreased fast-spiking activity with simultaneously increased principle neuron activity when mice were presented with a conditioned stimulus associated with shock. In contrast, experiments using in vitro brain slices and in anesthetized animals have observed that cortical circuits maintain a precise balance of excitation and inhibition (Sanchez-Vives and McCormick 2000; Shu et al. 2003; Haider et al. 2006). This balance—or its dynamic regulation—may be disrupted in certain pathological conditions (Rubenstein and Merzenich 2003; Kehrer et al. 2008; Yizhar et al. 2011). The idea of balanced excitation and inhibition in a network makes intuitive sense based on the dense connectivity between fast-spiking inhibitory neurons and surrounding projection neurons (Buzsáki 1984; Swadlow 2003; Bock et al. 2011). But it remains unclear just how strictly excitatory–inhibitory balances are maintained in circuits of behaving animals or circumstances under which such a system may be pushed from its set point, and what computational functions these variations may serve.
The cortex also contains different types of projection neurons, the functional distinctions of which are unknown. Pyramidal neurons can be distinguished according to their burst- or regular-firing properties (Connors and Gutnick 1990) and exhibit dissociable dendritic extensions (Schubert et al. 2001) and axon targets (Gao and Zheng 2004; Le Bé et al. 2007). One may hypothesize that the two neuron types use different signaling methods to transmit similar information to different areas of the brain. The distinction between burst- and regular-firing cortical neurons has received some limited attention in primary sensory cortices (e.g., Sun et al. 2013), but the relative contribution of these neuron types in the medial frontal cortex is unknown.
The present experiment examined activity patterns within and between populations of extracellularly recorded regular-firing, burst-firing, and narrow-waveform fast-spiking neurons to investigate the relationship between the activity state of medial frontal cortex circuits and rats' behavior during a decision task. These studies reveal an intriguing independence between the activity in different types of neurons and may explain how the medial frontal network tracks an animal's environmental and behavioral situation while maintaining, often in the face of dramatic sensory and motor transitions, an overarching representation of the situation's value.
Materials and Methods
Subjects and Task
All experimental procedures were in accordance with NIH guidelines. Five male Fischer-344 rats, aged 9–14 months (NIA, Charles River, Wilmington, MA, USA) were food restricted until motivated to run for liquid food reward, vanilla Ensure (Abbott Laboratories, Abbot Park, IL, USA), for 40-min sessions (80–90% of free-feeding weight). The experiment took place on a platform with 3 arms radiating from a circular, central region (Fig. 1A). Rats were trained to shuttle to the ends of platform arms to follow an auditory cue (a 10-kHz tone broken each 50 ms by a 25-ms delay) and visual cue (a 4-Hz blinking white light). A 40-min session on the task took place once each day and consisted of up to several hundred trials. A rat initiated a trial by entering the circular, central zone (the cue zone), at which point an auditory and visual cue were presented from the ends of randomly selected arms. The trial was completed when the rat reached the end of an arm (the feeder zone), where it would receive a drop of liquid food reward if it had correctly followed the rewarded cue, or alternatively, encounters an error sound if it had not. During a given session, only one of the two cues was rewarded. The rewarded cue was switched following 8 sessions, referred to throughout the remainder of the manuscript as a “task switch.” The experiment was controlled by software custom-written in Visual Basic 6 (Microsoft, Redmond, WA, USA) and the Basic-X programming language (NetMedia, Inc., Tucson, AZ, USA).
Figure 1.

Behavior methods and neuron classification. (A) The 3-choice, 2-cue behavioral apparatus used in the present experiments. At the ends of the 3 platform arms are speakers and LED lights, one of which signals the reward location on a given session. Rats shuttled between the central cue zone, where cue presentation was initiated, and feeder zones, where liquid food was delivered in the case of a correct choice, and a nonlocalized error sound was presented in the case of an incorrect choice. (B) Distribution of half-amplitude (depolarization) width and half-valley (after-hyperpolarization) width of each neuron's average waveform. Neurons that had inhibitory cross-correlation profiles with other neurons (black dots) tended to cluster into a group of cells with shorter after-hyperpolarization times. All neurons in this grouping were classified as putative inhibitory cells (example in Supplementary Fig. 1, neuron A). Those with wider waveforms were classified as putative excitatory projection cells (Supplementary Fig. 1, neurons B, C, and D). Insets are example of average waveforms for putative projection and inhibitory neurons. (C) Distribution across the neuron population of 2 features calculated from each neuron's 500-ms autocorrelation: Time that the autocorrelation reached a peak, and the magnitude of the downward slope. Autocorrelations include spikes from both rest and task session epochs. Black dots represent those neurons that were determined to be inhibitory from the cross-correlations (as in B). Visual inspection revealed roughly 3 groupings, which were classified as burst firing (early peaks but rapid decay; green), regular firing (later peaks and often slower decay; orange), and fast spiking (moderately early peaks but slow decay; blue). Inset shows average autocorrelations of all cells within each group. (D) The reconstructed electrode positions of all recorded neurons overlaying coronal (left), and sagittal (right) illustrations from Paxinos and Watson (1998; plates are 3.4 mm anterior to bregma and 0.9 mm lateral, respectively). Neuron recording sites that appear to be beyond the boundaries of the medial prefrontal cortex can be explained by the limitations of projecting 3D positions onto single sections. (E) Frequency of recorded neurons along medial–lateral and dorsal–ventral axes. Each panel contains a frontal coronal plate from Paxinos and Watson, overlaid with a color map describing the number of neurons recorded relative to the number of sessions an electrode occupied the position. Hotter colors indicate a higher proportion of neurons recorded at a given location. The increased frequency of burst-firing neurons (left) at a particular medial–lateral position (bottom panel) is consistent with observations that burst-firing neurons are more frequently observed in layer IV/upper-layer V (see Discussion). Regular-firing (middle) and fast-spiking (right) neurons were observed throughout medial–lateral and dorsal–ventral positions. The 267 neurons that did not fall within the boundary classifications were distributed throughout these regions. (F) Autocorrelation features as in C, but generated from spikes during the task epoch only. Many fast-spiking neurons formed a tight cluster with peaks around 20 ms. Average autocorrelations of neurons in this group exhibited a 40- to 70-Hz (gamma-frequency) rhythm (inset).
For purposes of analysis, a trial on the 3-choice, 2-cue decision task was broken into 8 500-ms trial phases: 1) The rat turns away from its previously selected feeder zone to initiate its return to the cue zone; 2) the rat runs toward the cue zone; 3) immediately before reaching the cue zone; 4) the cue zone is entered and task cues are presented; 5) acceleration to a chosen goal; 6) immediately prior to reaching the feeder zone; 7) immediately following reaching the cue zone; 8) 500–1000 ms following outcome delivery. As the eighth trial phase is associated with distinct behaviors on correct compared with error trials, many of the analyses distinguished between the two, so that most figures contain 9 bins.
Recordings
Electrode drives (hyperdrives) were attached to the rat's skull under isofluorane anesthesia. Implants centered electrodes 0.8–1.3 mm to the right of midline, 2.4–3.2 mm anterior to bregma, tilted 7°–9° medially. The hyperdrive is an electrode manipulator device which contains 14 independently moveable tetrodes that are held within a plastic casing by a bundle of stainless steel cannulae 0.3 mm in diameter (i.e., the spacing between a tetrode and its neighbors was ∼0.3 mm; Wilson and McNaughton 1993). Each tetrode was composed of a twisted set of 4 0.0005 inch diameter insulated nicrome wires gold-plated to 400–800 kΩ. Recordings began 4 weeks after implantation to maximize recording stability. Neural data were recorded for 51–84 (median = 63) sessions across 5 rats, and a total of 117 sessions were analyzed (15–29 per rat, median = 27) for the purpose of this manuscript. All sessions within 2 days before or after a task switch were included in analyses as well as randomly selected sessions between these blocks. Within a given animal, the depths of the different electrodes were staggered from early sessions to sample across different regions of the medial frontal cortex; this system reduced confounds between recording day and recorded region. In general, however, electrodes were moved progressively deeper (i.e., more ventrally) across sessions. In a separate set of analyses (Insel 2010), learning rates were found not to differ over subsequent reward contingency reversals. Also, recordings began after rats were highly familiar with the task (∼ 2 months of training and postsurgery re-training). It is therefore unlikely that changes in neural patterns observed between regions of the medial frontal cortex were confounded by changes in the rats familiarity or expertise in the task. Each recording session consisted of an initial, 10–25 min rest epoch in a towel-lined pot next to the apparatus, a task epoch lasting 30–55 min, and a final 20–40 min rest epoch in the towel-lined pot. Single-unit and local field potential (LFP) data were collected using an analog, 64-channel Cheetah recording system (Neuralynx, Bozeman, MT, USA). Single-unit data were collected by thresholding 33-kHz sampled voltage fluctuations against a reference electrode positioned at the brain surface above the frontal cortex. LFPs were continuously recorded at 1989 Hz (3 rats) or 1659 Hz (2 rats) from each tetrode, compared against the same, brain surface electrode. Video tracker data were collected at 60 Hz from an overhead camera. Events taking place in the experimental task, controlled by a Basic-X microcontroller (NetMedia Inc.), were timestamped by parallel outputs from the Basic-X into the Cheetah acquisition system.
Histology and Reconstruction of Electrode Position
Electrode positions were reconstructed using electrode turning history (one full turn of the hyperdrive manipulator = 320 µm) and histology. When recording protocols for a rat were complete, electrodes were moved to 3000 µm from their starting positions at the brain surface and lesions were made by passing 5 µA through electrode tips for 10 s. Rats were then left for 2–5 days before perfusion with 4% paraformaldehyde. Brains were sectioned at 50 µm. Electrode starting positions were estimated by stereotaxic implantation coordinates and adjusted according to identified tissue damage at the brain surface (Supplementary Fig. 1). Electrode positions at lesion sites were estimated according to their relative position to other brain structures, as presented by Paxinos and Watson (1998; coronal plates). The relative position of each of the 12 tetrodes in a rat was inferred based on its position within the cannula bundle and the diameter of each cannula. A custom-written program in MATLAB (Mathworks, Natick, MA, USA) was used to reconstruct electrode positions based on these factors and based on the daily recorded depth of the recording electrode. Several factors (e.g., tilt of the electrode drive) were adjusted according to the observed match between reconstructed results and visual inspection of the position of electrode tracts and lesions in the histological sections.
Data Analysis: Neuron Classification
All analyses were custom-written in MATLAB. Spike events in the recorded data were sorted into putative single neurons according to waveform shapes and features, using a combination of Klustakwik (K.D. Harris; http://klustakwik.sourceforge.net/), MClust (A.D. Redish; http://redishlab.neuroscience.umn.edu/MClust/MClust.html) and Waveform Cutter (S.L. Cowen; University of Arizona, Tucson, AZ, USA).
Analyses considered all spike trains recorded across days. Concerns about oversampling can arise when using chronic implants, because spike trains recorded from the same electrode position from 1 day to the next often represent recordings from the same neurons. Of 2433 spike trains, 1251 (51%) were recorded on different electrodes or between changes in the depth of the recording electrode. Because gradual movements of tissue around electrode tips can also take place over the 1-day periods between recordings sessions, resulting in changes in the set of neurons recorded, it is likely that the majority of the remainder of spike trains were also unique neurons.
Neuron classification was performed across 2 independent dimensions: neuron waveform shapes and neuron firing patterns. Overlap between these two dimensions are described in the Results section, but analyses that related activity of neurons within a class to behavior, or to the activity of other neuron classes, considered waveform and firing pattern classifications separately.
Neurons were classified by waveform shape into putative interneuron/inhibitory cells, projection/excitatory cells, or neither. The link between neuron waveform shapes and the use of inhibitory versus excitatory neurotransmitters could be inferred by examination of cross-correlations between neuron pairs. Fifty-four neurons met a strict criterion for exhibiting inhibitory influence on other local neurons. Specifically, the cross-correlations between the reference neuron and at least 2 other neurons exhibited reduced firing rates below 2 standard deviations (SDs; assuming Poisson distribution) for at least 2, 2-ms bins within the 0- to 5-ms period (Supplementary Fig. 2). When the half-amplitude and half-valley widths of all neurons' waveforms were plotted, the inhibitory neurons were observed predominantly in a cluster that made up 5.9% of the recorded population (143; Fig. 1B). All neurons in this cluster were therefore classified as putative inhibitory interneurons. Units with peaks or valleys that were narrower than putative inhibitory neurons were most likely axon fibers of passage (Robbins et al. 2013). The remaining 2182 units were classified as putative projection neurons.
Cells were additionally classified according to their firing patterns, as revealed by the 500-ms (1-ms bin) autocorrelations. The two factors used for classification analysis were the time at which the autocorrelation peaked, and the downward slope of the autocorrelation after the peak (Fig. 1C). These features provided a metric for the degree to which a neuron exhibits burst firing. That is, increased “burstiness” corresponded to cells that had earlier autocorrelation peaks and steeper slopes. To confirm that the results were not dependent on the specific classification boundaries used (see below), observations were confirmed with more conservative boundary criteria (52% of neurons remained unclassified using the conservative boundaries, compared with 11% using the original boundaries). The specific parameters used for classification were for fast-spiking neurons, autocorrelation peaks = 12–47 ms and −log(slopes) <−3.2 (conservative boundaries: peaks = 15–25 ms, same slopes); for burst-firing neurons, autocorrelation peaks <47 ms, −log(slopes) >−3.2 (conservative: peaks ≤12 ms, −log(slopes) >−2); and for regular-firing neurons, autocorrelation peaks = 47–175 ms across all slopes (conservative: peaks = 47–175 ms, −log(slope) <−2.5), where “log” refers to the natural logarithm. Analyses were conducted on the primary classifications, and then confirmed with the conservative boundary classifications. For presentation, only data from primary classifications are shown, as activity patterns were not found to differ depending on the classification boundaries.
The classification boundaries described were determined by visual inspection of the clusters made by the spike widths and autocorrelation peaks/decay slopes in their respective feature space. An alternative method would have been to use machine-learning algorithms to automatically cluster cells according to distances between feature sets. Such clustering methods were not used because the classification categories investigated here were drawn from previously established neuron types described in the Introduction. Within these categories, the variation of autocorrelation features is relatively high. Because of this, using automated clustering methods based on feature distances to identify boundaries may have resulted in classifications that do not match established categories.
In addition, it is important to note that the parameters used here to classify neurons are highly related to those used in other studies. Distribution of the peak latencies and the slopes of interspike interval (ISI) histograms exhibited many of the same general patterns as those of the autocorrelograms (Supplementary Fig. 3; ISI distribution features can become more useful than autocorrelogram features in cases where there is a strong regularity of firing at a particular oscillation such as theta, also described by Insel et al. 2012). Another measure useful for identifying a neuron's burstiness is local variance (LV), which reflects the variance of adjacent ISIs. For the present data, LV was found to be highly correlated to the autocorrelation decay rate (Pearson's correlation, r = 0.78), making the methods used in the present manuscript comparable with those which rely on LV. LV was computed as in Shinomoto et al. (2009) as
where Ii and Ii + 1 are the ith and i + 1st ISIs, and n is the number of ISIs. LV values for the different neuron groups were burst firing = 1.2 ± 0.21 (mean ± SD), regular firing = 0.79 ± 0.25, fast spiking = 0.79 ± 0.25.
Data Analysis: Neuron Connectivity
Putative connections between neurons were identified by investigation of cross-correlations. The magnitude of the relationship observed in a cross-correlation was evaluated by converting each cross-correlogram's absolute y-axis scale to normalized rates, first by subtracting the median of all bin counts in the 500-ms cross-correlogram, and then dividing each bin's value by its SD. As the sampling distribution of a histogram with many bins is well approximated by a multi-Poisson distribution, the SD was estimated for each bin as the square root of the number of entries in the bin. The median was used for normalization instead of firing rates for the entire session because we were specifically interested in short-interval (−10 to 10 ms) relationships that stood-out against correlations that may be present at slightly longer (within 0.5 s) intervals. When neuron firing rates throughout the session are used for normalization, changes in relative firing across session epochs and task events influence the detection of short-latency correlations. Medians were used instead of means to avoid influence by peaks and troughs expected to occur during the −10- to 10-ms interval. In ∼10% of neuron pairs, baseline firing rates in 2 simultaneously recorded neurons were low enough that the median, 500-ms cross-correlation was zero. In these cases, normalization was performed by substituting medians for expected values based on the firing rates of the 2 neurons (i.e., the session-wide firing rate of a neuron B was subtracted from the conditional firing rate of neuron B around the spikes of neuron A).
Because strong, narrow peaks in the cross-correlation between −5 and 5 ms are suggestive of a direct synaptic connection between the (e.g., Eggermont 1992; Csicsvari et al. 1998; Barthó et al. 2004; Fujisawa et al. 2008), peaks that last only 1 or 2 ms have been taken to imply monosynaptic coupling. These relationships are often compared against smoothed cross-correlations, or confidence intervals generated from surrogate cross-correlations made from jittered spike trains. However, broad asymmetric peaks in the cross-correlation may also indicate that one neuron is making a synaptic contribution to a second neuron, the width of the peak being dependent on factors such as distance between neurons, burst-firing characteristics, and environmental stimulation (Eggermont 1992; Eggermont and Smith 1996). Excitatory and inhibitory coupling was computed for each cross-correlation. In a pair of neurons A and B, if at least 1, 1-ms bin exceeded 4 SDs during the −5- to −1-ms period, then neuron A was said to have an excitatory synapse onto neuron B. If at least 2, 1-ms bins fell below 3 SDs during the −5- to −1-ms period, neuron A was said to have inhibitory synapses onto neuron B. Inhibitory coupling was only examined between neurons with >1-Hz firing rates in at least one session epoch so that a decrease could be detected, and excluded neuron pairs that also exhibited significant cross-correlation troughs in the 1- to 5-ms interval to reduce the influence of spike-sorting errors.
To compare cross-correlation patterns between choice and outcome phases of the decision task, all spikes for a 1-s period starting with presentation of the cue or outcome were collected for both neurons of a pair. Since spike sampling was bounded within a 1-s window, correlations between neurons dropped off from the central axis, converging to zero at ±1 s. Thus, rather than identifying significantly coupled pairs during the cue or outcome phases, comparisons took all neuron pairs with significant coupling during the entire session (i.e., the cross-correlations based on all spikes throughout the session), and compared the magnitude of their peaks during the cue versus outcome phases. To avoid the influence of nonsynaptic correlations between the neurons in either the cue or outcome trial phases, peaks were computed by subtracting the −5- to −1-ms cross-correlogram peak from the same correlogram smoothed by a 20-ms hamming window. This was then normalized by dividing that value by the bin's SD. To control for firing rate differences between neuron types in different trial phases, a second set of analyses were performed on spike trains in which firing rates at each phase were equalized, by removing a random sample (rand function in Matlab) of spikes from the phase with higher firing.
Gamma-frequency relationships in the cross-correlation (i.e., the degree to which the cross-correlations showed rises and falls at 40–70 Hz) were measured as the difference in height of the secondary peaks versus troughs in the 8-ms hamming window smoothed cross-correlations, across all inhibitory–excitatory pairs.
Data Analysis: Single Unit and Neuron Population
Neuron activity was compared between phases of trials on the task, between trial types, and between task and rest epochs of the session. Statistical tests were performed on the set of all neurons, pooled across rats, ensuring that the comparisons chosen accurately reflected the raw distributions. Tests were also performed across within-rat averages, so that findings could be generalized across the population of rats. To evaluate the degree to which a neuron population differentiated between epochs or trial phases, Pearson's correlation coefficients were computed over the firing rate vectors (where each element of the vector represented the firing rate of a given cell during the epoch or trial phase) within rats and averages were compared across rats. The Pearson's correlation was selected over alternative distance metrics because of its simplicity and its interpretability as angular distance.
To identify the selectivity of neuron activity for trial phase, 2 information measures were used. The first was a “raw” selectivity measure, computed from the probability that a neuron fired in some trial phases but not others (averaged across trials):
where P(i) is the average firing rate at each of 9 trial phases, divided by the sum across trial phases (note that a base 2 logarithm was used). The second measure was mutual information, computed from the joint distributions of firing rates across trial phases and trials. The mutual information takes into account variances across trials:
where P(i,j) is the joint probability distribution of trial phase “i” and firing rate “j,” P(j) is the marginal probability distribution of firing rates, averaged across trial phases, and P(i) is the marginal distribution of trial phase firing rates (as above). Mutual information is an imperfect method for comparing neuron classes because the measure can be biased by neuron firing rates. This is largely because neurons cannot fire fewer than zero spikes during a given 500-ms bin; thus, the dynamic range of low-firing neurons is smaller than that of high-firing neurons. Entropy comparisons can only be made if the probability distribution is generated from a bin size that accommodates the low dynamic range. It was empirically determined that correlations between firing rate and mutual information were minimized if neurons had in-task firing rates of at least 0.5 Hz and 10 bins (of firing rate) were used to describe the probability distributions (illustrated in the Results section and correspondingly in Supplementary Fig. 6).
For some comparisons, such as relative firing rates across trial phases, it was useful to normalize rates according to z-scores (subtracting firing rate averages and dividing by the SD). This ensured that a minority of neurons with exceptionally high-firing rates did not dominate within-rat averages.
Data Analysis: Local Field Potential
LFP analyses were performed on data from the same electrodes used to record single neurons. Dominant bands in the LFP were identified by computing spectral power on the 500-ms trial phases (periodogram function in MATLAB, which implements a discrete fast fourier transform), averaged across trials and sessions within rats. Based on these results (discussed in the Results section), instantaneous gamma amplitude was computed by filtering LFPs with a 40- to 70-Hz bandpass filter (fourth-order Chebyshev Type 1) and subsequently taking the absolute value of the Hilbert transformation. Due to differences in electrode impedance between tetrodes and between rats, gamma power was treated as a relative measure, and patterns were therefore normalized within rats by subtracting average, instantaneous power across trial phase bins and then dividing by the SD. More extensive illustrations of gamma patterns obtained from the young adult animals included in the present manuscript are described in Insel et al. (2012).
Results
Neuron Classes
Neuron spike trains were electrophysiologically recorded and classified by waveform shape and spiking patterns. A total of 2433 single neurons were isolated from the medial frontal cortex of 5 rats. Narrow-waveform neurons were classified as putative interneurons (5.9% of the population, n = 143; see Materials and Methods for explanation), while wide-waveform neurons were classified as putative projection neurons (89.7%, n = 2182; Fig. 1B). Neurons could also be classified according to their spiking patterns (Fig. 1C); the majority were found to be regular firing (56.8%, n = 1383), with smaller subsets belonging to burst firing (24.6%, n = 598), and fast spiking (7.6%, n = 185) groups. These ratios correspond roughly to those previously described in this region and in other areas of cortex (McCormick et al. 1985; Connors and Gutnick 1990; note that a more conservative classification scheme was also used, as described in the Materials and Methods section). In general, regular- and burst-firing neurons tended to have wide waveforms—i.e., were putative projection neurons—while fast-spiking neurons disproportionately fell into the group of narrow-waveform neurons (Table 1). Cells were further localized to specific regions and layers of the medial frontal cortex (medial precentral cortex, n = 853; dorsal anterior cingulate cortex, n = 729; dorsal prelimbic cortex, n = 708; ventral prelimbic cortex, n = 143; cortical layers II/III, n = 322; cortical layers V/VI, 2111; Fig. 1D,E).
Table 1.
Numbers and proportions of recorded neurons across different classes
| 2433 neurons recorded from 5 rats | Putative projection/excitatory (2182 neurons, 89.7% of total) | Putative interneuron/inhibitory (143 neurons, 5.9% of total) | Ungrouped (108 neurons, 4.4% of total) |
|---|---|---|---|
| Regular firing = 1383 neurons, 56.8% of total (conservative boundary = 1015, 41.7%) | 1301 neurons, 53.5% of total | 43 neurons, 1.8% of total | 46 neurons, 1.9% of total |
| Burst firing = 598 neurons, 24.6% of total (conservative boundary = 189, 7.8%) | 554 neurons, 22.8% | 16 neurons, 0.66% | 28 neurons, 1.2% |
| Fast spiking = 185 neurons, 7.6% of total (conservative boundary = 58, 2.4%) | 87 neurons, 3.6% | 82 neurons, 3.4% | 16 neurons, 0.66% |
| Ungrouped = 267 neurons, 11.0% of total (conservative boundary = 1171, 48.1%) | 240 neurons, 9.9% | 9 neurons, 0.37% | 18 neurons, 0.74% |
Note: Classifications by firing patterns (rows) were made by visual inspection of clusters formed by autocorrelation features, but analyses were complimented with more restrictive classification boundaries, referred to in table as “conservative boundary” for comparison. Note that although a number of fast-spiking neurons exhibited waveform shapes that fell under the heading of “putative projection/excitatory” neurons, there is no reason to believe that these neurons were, in fact, projection cells or that they used glutamate as a neurotransmitter. Analyses in the present paper typically focused on 3 neuron classes: regular-firing projection neurons, burst-firing projection neurons, and fast-spiking inhibitory neurons (bold text).
A subset of fast-spiking neurons (58 neurons, or 2.4% of the total population) exhibited clear autocorrelation peaks between 15 and 25 ms when rats performed the task (i.e., when spikes during rest epochs were omitted). This ISI fit the period of the gamma (40–70 Hz) oscillation, and gamma rhythmicity was observed during the first 60 ms of the autocorrelations (Fig. 1F). As described below, activity patterns of these neurons during behavior also paralleled changes in LFP gamma power. This is consistent with the known importance of fast-spiking neurons for network synchronization in the range of 40–70 Hz, and the correlations with the LFP indicate that the activity of these neurons could be considered to be an index of local network synchronization.
Cross-correlations were used to examine interconnections between neuron classes and regions, revealing strong, local excitatory–inhibitory interactions between wide-waveform and narrow-waveform cells and sparse excitatory connections among wide-waveform neurons (Supplementary Results and Supplementary Fig. 4).
Differential Selectivity for Trial Phase Between Neuron Classes
Rats performed a 3-choice, 2-cue decision task in which they learned to follow a rewarded cue switched every 8 days (described in Materials and Methods; Fig. 1A). Rats typically ran 226 ± 61 trials (mean ± SD) on the task during a 41 ± 8-min session, with performance rates that ranged from near chance (33%) to nearly 100% depending how recently reward contingencies of the two cues had been switched. Each trial on the decision task was punctuated by several events that were used to partition behavior and neural activity into 8, 500-ms trial phases. These 8 windows tracked the rats between the choice phase (trial phases 4 and 5) to an outcome phase (phases 7 through 9), and back again. Eighty-eight percent of recorded neurons significantly differentiated between trial phases (Kruskal–Wallis test for each neuron, α = 0.05). Different neurons were found that fired maximally at each of the 9 trial phases, and this was observed even within the different neuron classes (Supplementary Fig. 5). However, overall differences were observed between neuron classes with respect to both the degree and the phase of selectivity within a trial.
Median firing rates and trial phase selectivity differed substantially between classes of neurons, with putative inhibitory neurons being more active (9 Hz; fast-spiking inhibitory = 13 Hz), but less selective (median trial phase information = 0.58 bits; fast-spiking inhibitory = 0.48 bits) than both regular-firing (3 Hz; 3.2 bits) and burst-firing projection neurons (0.8 Hz; 2.8 bits; Fig. 2A,B; one-way ANOVA on log information: F2,1983 = 172.4, P = 9.6 × 10−70; post hoc Tukey test revealing that interneurons differ from both groups of projection neurons). The mutual information of trial phase, which takes into account firing rate variances between trials, was found to be highest in regular-firing projection neurons but not different between burst-firing and fast-spiking neurons (Supplementary Fig. 6; one-way ANOVA on log-normalized mutual information scores, only neurons with in-task firing rates >0.5 were analyzed: F2,1347 = 59.23, P = 2.2 × 10⁻²⁵, post hoc Tukey test revealing significantly higher values among regular-firing neurons). Although some caution is warranted in interpreting these data (see Supplementary Fig. 6), they are consistent with other observations discussed below that burst-firing neurons may be less selective for behavioral context compared with regular-firing neurons.
Figure 2.
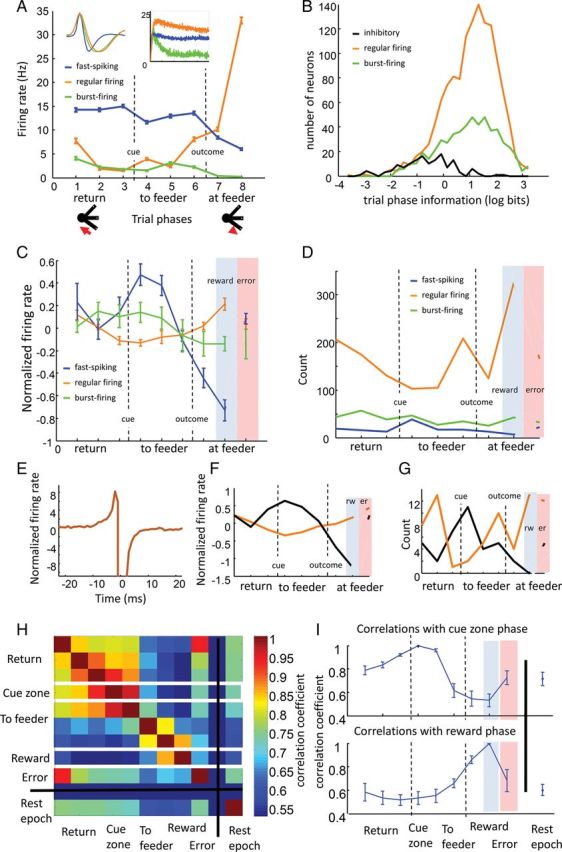
Different neuron classes exhibit different patterns of trial phase selectivity. (A) Activity across trial phases in an example fast-spiking inhibitory neuron (blue), regular-firing projection neuron (orange), and burst-firing projection neuron (green). All 3 neurons were simultaneously recorded on the same electrode. Firing rates are averaged across trials and displayed for each trial phase from the rat's departure from a feeder zone (phase 1) until obtaining subsequent reward again at a subsequent feeder zone (phase 8). Insets show average waveforms for each neuron (left) and 500-ms autocorrelograms (right). (B) Distribution of trial phase selectivity for inhibitory neurons and both regular-firing and burst-firing groups of excitatory neurons. Selectivity was measured in bits and log-normalized for illustration and statistical purposes. Both regular- and burst-firing projection neuron groups were much more selective for trial phase than interneurons. (C) Across-rat averages of relative trial phase activity for fast-spiking inhibitory and regular- and burst-firing projection neurons. Firing rates across trial phases were z-score normalized then averaged within rats for each cell type to show relative activity levels between trial phases (error bars are SEM across 5 rats). Fast-spiking neurons (blue) tended to fire when cues were presented, while regular-firing neurons (orange) tended to be least active during this time, and most active when rats acquired reward. (D) Similar patterns as in C can be observed by tabulating the number of neurons that fired maximally in each individual trial phase. (E) Mean, normalized cross-correlation of all 68 pairs of simultaneously recorded inhibitory and regular-firing projection with significant, reciprocal, inhibitory–excitatory interactions (only neurons with higher than 1-Hz firing rates included). (F) Trial phase activity among only those neurons within the 68 pairs (regular firing: orange, inhibitory: black). (G) Tabulated number of neurons with maximal firing in each individual trial phase. (H) A matrix of correlation coefficients, averaged across rats, between the firing rate vectors for each trial phase and for the rest epoch on the x and y axes. Firing rate vectors included all neurons recorded in a rat, where each element of the vector was the across-trial average firing rate of a neuron within the specific trial phase indicated. Hotter colors represent higher correlations. White lines around the fourth and eighth rows mark the correlation coefficients for cue and reward phases that are also presented in different graphic form in I. (I) Line graphs illustrate the same correlation coefficient data as presented in H for the cue (upper graph) and reward (lower graph) periods, with error bars representing SEM across 5 rats. The population activity was most distinct between cue and reward periods, and this was consistent across rats.
Different trial phases were consistently associated with differences in the relative levels of activity between neuron classes (two-way ANOVA on within-rat means, interaction between trial phase and cell type: F16,134 = 6.68, P = 0; Fig. 2C,D). Narrow-waveform, putative inhibitory neurons and the highly overlapping group of fast-spiking neurons were most likely to exhibit highest firing rates when rats began to respond to presented decision cues and when accelerating away from feeder zones. Regular-firing putative projection neurons were most likely to fire during rewarding outcomes or immediately prior to the rat reaching the feeder. Burst-firing putative projection neurons tended to fire most when the cues were presented or prior to the rats reaching the cue zone. To control for the possibility that fast-spiking and regular-firing neuron patterns resulted from differences in recording location, or reflected differential activity in microcircuits containing different proportions of narrow- and wide-waveform neurons, we repeated the analyses on only those neurons recorded from the same electrode exhibiting an apparently reciprocal excitatory–inhibitory connection. Cross-correlations were used to assess the connectivity between neuron groups (Supplementary Fig. 5). Among the pairs of narrow- and wide-waveform neurons recorded on the same electrode, 11% (87 of 789) exhibited apparent reciprocal inhibitory–excitatory connections (Fig. 2E; only neurons with firing rates above 1 Hz were included so that cross-correlation baselines were high enough to observe inhibition). Even within these local circuits, activity patterns differed between neuron groups, with putative projection neurons more likely to fire during and immediately preceding rewards and inhibitory interneurons more likely to fire during the decision and movement phases (Fig. 2F,G; two-way ANOVA across cells, interaction between trial phase and cell type: F2,1088 = 12.03, P = 0).
Consistent with the observed clustering of regular-firing neuron activity near the feeder, population activity was particularly unique around reward sites compared with other trial phases. This was apparent in the average correlation coefficients (Pearson's correlation) between the firing rate vectors (across all cells) in each pair of trial phases (Fig. 2H,I). Correlation coefficients between phases in the earlier stages of a trial—starting when a rat initiates its return path to the cue zone and continuing until after the rat makes a choice about the subsequent feeder (the first 5 trial phases)—were relatively higher, indicating that transitions in the population activity during this time were more gradual. At later trial phases, when rats approached feeders (trial phase 6), and particularly when rats encountered the reward (trial phase 8), population activity was relatively uncorrelated with earlier stages of the trial.
We further investigated whether connectivity between regular-firing neurons was increased during the period around outcome presentation relative to the period around cue presentation. Such local connectivity increases could provide a partial explanation for the increased excitation of regular-firing relative to inhibitory neurons at reward sites. Peaks in the −5- to 5-ms intervals of the cross-correlations between regular-firing neurons were higher at outcome periods (averaged within rats n = 5, mean difference = 0.051, P = 0.02). However, it could be argued that the increased correlation was a byproduct of increased activity among regular-firing neurons in the outcome period, and when analyses were restricted to only pairs with apparent monosynaptic excitatory connections, differences were not significant (n = 5 rats, difference = 0.44, P = 0.15). Further examination of cross-correlograms during outcome and cue periods is reported in Supplementary Results.
Fast-Spiking Neuron Activity During Sensory Stimulation and Movement
The relative increase in fast-spiking and narrow-waveform neuron firing during trial phases associated with cue presentation and acceleration periods suggest that these neurons may inhibit local network activity during sensory or motor activity. To expand on this observation, we examined the relative relationships between activity evoked by the task auditory cue (as a precisely time-locked sensory stimulus), activity related to movement acceleration, and, as a control for motivational factors, activity related to the relative value of the task cue.
The firing patterns of individual neurons to the auditory decision cue were heterogeneous; however, many fast-spiking and narrow-waveform neurons tended to fire more immediately following cue presentation. These increases were significant for over 40% of fast-spiking, putative inhibitory neurons (34 of 82, comparing 250 ms after vs. before cue presentation; Wilcoxon signed-rank test, α = 0.01). Only one fast-spiking inhibitory neuron was found to decrease during cue presentation. In contrast, more regular-firing projection neurons decreased activity at cue presentation (140 of 1301, or 10.8%, compared with 100 neurons which increased). Among the population of burst-firing projection neurons, roughly 7% increased and <3% decreased (40 and 16, respectively, of 598 neurons).
An example raster plot and peri-event time histogram (PETH) illustrates the firing pattern of one fast-spiking neuron with sustained activity increases following presentation of the auditory decision cue (Fig. 3A). Many other fast-spiking cells exhibited transient firing rate increases to the cue, as illustrated by the average, normalized cue-aligned PETHs (blue trace of Fig. 3B). Across the population of all fast-spiking inhibitory neurons, firing rates typically peaked 70–80 ms following auditory cue presentation (median across fast-spiking or narrow-waveform cells), with increases above baseline becoming apparent as early as 20 ms following cue presentation. Importantly, cue presentation also evoked orienting movements with a time course that appeared to parallel the evoked activity among fast-spiking neurons (Fig. 3B, green trace).
Figure 3.

Relationship between fast-spiking inhibitory neuron firing with task stimuli and movement. (A) Raster plot (top) and PETH (bottom) of an example fast-spiking, putative inhibitory neuron. Across all trials, firing rates increased following presentation of the auditory, decision-cue (central axis), and activity was sustained for longer than 1 s. (B) Average, normalized PETH aligned to the auditory decision cue across all neurons that were both fast-spiking and putative inhibitory cells (blue trace), plotted with the cue-locked averages of the rats' acceleration when the neurons were recorded (green). Many neurons exhibited either a transient or sustained activity increase following cue presentation; often these firing rate patterns matched the times at which rats accelerated as they searched for and oriented toward the cues. (C) Average PETHs and acceleration patterns as in B, aligned to when rats initiated movement toward the selected feeder. (D and E) Same as in B, with PETHs and movement acceleration aligned to reward delivery and error sound presentation, respectively. (F) Performance during the first (black) and second (gray) half of each session plotted across days from the reward contingency switch. Only sessions in which fast-spiking or putative inhibitory neurons were recorded were included in figure (error bars are SEM across these sessions). Average performance ranged from over 80% correct before the switch to nearly 40% correct during the half-session following the switch. (G) Average firing rates for fast-spiking or putative inhibitory neurons during the 500-ms follow cue presentation for the first (black) and second (gray) half of each session plotted across days as in F. Although different neurons may have been recorded between days, firing rates did not appear to change between the first and second half-sessions. Probability of reward therefore did not appear to influence firing during the cue period; responses were therefore more likely to reflect attention and movement initiation processes.
Relationships were also found between the activity of fast-spiking and narrow-waveform neurons and movement initiation, as measured by rats' acceleration. A general relationship between activity in these neurons and rats' acceleration can be observed in the averaged, normalized PETHs, presented with average, instantaneous acceleration during the same time periods (Fig. 3B–E; similar plots describing the activity of regular- and burst-firing projection neurons are presented in Supplementary Fig. 7). During rats' final acceleration toward the feeder zone, fast-spiking neuron activity appeared to transiently increase and then decrease as rats began to decelerate (Fig. 3C). The magnitude of this effect appeared to be less pronounced than during cue presentation, suggesting either a strong influence by the auditory stimulation itself or, alternatively, differences in the degree to which population activity was correlated with rotational movements (at cue presentations) versus linear movements (as rats ran toward the feeder zone). Across trials, roughly 41% of all fast-spiking inhibitory neurons were correlated with acceleration when rats initiated their return from the feeder zone back to the cue zone (34 of 82; fast-spiking: 44 of 185; inhibitory: 44 of 143), and roughly 25% of fast-spiking inhibitory neurons were correlated with acceleration when cues were presented or when rats initiated their final acceleration to the feeder zone (20 and 22 of 82 neurons, respectively; all fast-spiking: 29 of 185 and 41 of 185, all inhibitory: 21 of 143 and 36 of 143; Pearson's correlation comparing firing rates and acceleration during the 500-ms interval as rats left the feeder zone, α = 0.01). In each of these cases, the correlation coefficients tended to be positive (mean correlation coefficient = 0.19, 0.21, and 0.15 for trial phases 1, 4, and 5, respectively, one-sample t-test = 1.8 × 10⁻⁵, 1.1 × 10⁻⁵, and 2.4 × 10⁻³). Moreover, correlation coefficients between firing rate and acceleration were relatively consistent across these 3 trial phases, which helped to control for nonmovement-related environmental and behavioral variables that were specific for the different trial phases (Person's correlation on the correlation coefficient between firing rate and acceleration when rats left the feeder compared against when they initiated approach to the feeder: r = 0.31, P = 0.004; all fast-spiking: r = 0.25, P = 6.8 × 10⁻⁴, all inhibitory r = 0.17, P = 8.4 × 10⁻⁴).
When rats reached the feeder zones on rewarded trials, the activity of fast-spiking inhibitory neurons decreased with deceleration and then continued to decrease as rats stepped toward the feeder port (Fig. 3D, blue vs. green trace). Likewise, during the 500-ms period following reward delivery, fast-spiking inhibitory neuron activity was not found to be positively correlated with acceleration (mean correlation coefficient = −0.03, P = 0.73). Thus, during reward presentation, levels of local circuit inhibition may have become briefly decoupled from the rat's acceleration, raising the possibility that fast-spiking inhibitory neurons may have been inhibited during outcome presentation.
Although the most pronounced changes to the activity of fast-spiking inhibitory neurons occurred at the presentation of auditory decision cues, these neurons did not appear to be stimulated when the auditory, error cue was presented (Fig. 3E; 17 of 185 fast-spiking, or 12 of 143 narrow-waveform neurons increased firing rates in the 250 ms following the rat's entry into feeder zones on error trials,, compared with 25 of 185 fast-spiking or 18 of 143 decreasing; Wilcoxon signed-rank test, α = 0.01). Thus, sensory stimulation alone, or the fact that it contained behavioral relevance, did not explain why activity in this population increased at the cue zone.
Finally, the activity of fast-spiking and putative inhibitory neurons did not appear to be driven by the expected probability of reward signaled by the decision cue. Although reward probabilities were not experimentally changed, the probability of receiving reward on a given trial varied as a function of whether rats had learned the cue-reversal. Between 2 days before and 2 days after the task switch, performance on the task varied across days and between session halves within days (Fig. 3F; two-way ANOVA for ratio of correct trials, only days with fast-spiking or narrow-waveform neurons included; n = 5 rats, across days: F4,37 = 9.2, P = 0.0001; interaction between days and session halves: F4,37 = 11.97, P = 0). In contrast, firing rate of fast-spiking inhibitory neurons did not change across days or between session halves (Fig. 3G; two-way ANOVA, n = 5 rats, across days: F4,37 = 0.71, P = 0.59, interaction between days and session halves: F4,37 = 0.05, P = 0.99; fast-spiking only (day × session half: F4,41 = 0.03, P = 1; narrow-waveform only, day × session half: F4,41 = 0.02, P = 1). Even a direct comparison of firing rates among neurons recorded during the task contingency change failed to reveal consistent firing rate changes in the trials before compared with after the task switch (t-test on normalized firing rate differences for each of 6, nonoutcome trial phase: all trial phases failed to reach significant with α = 0.05/6). As with fast-spiking neurons, neither regular- nor burst-firing projection neuron activity levels changed with reward rates between session halves (day × session half: regular-firing: F4,41 = 0.34, P = 1; burst firing: F4,41 = 0.03, P = 1). A minor exception is that those regular-firing neurons selective for the first trial phase, when rats initiated their return from feeder zone to cue zone, typically had higher firing rates during trials prior to the switch, although this increased activity was likely due to inertia of population activity from rewards just received, which were more frequent on preswitch trials (normalized firing rate difference on trial phase 1 = 0.18; paired t-test, P = 0.002 <0.05/6 (Bonforroni-corrected α).
In summary, fast-spiking and putative inhibitory neurons in the region were highly responsive to presentation of auditory task cues, highly correlated with acceleration, and did not appear to be sensitive to the degree to which task cues predicted upcoming reward. However, these neurons were not coupled with auditory cues or the rat's acceleration at the time that outcomes were presented, suggesting that the outcome cues, and in particular reward presentation, may have inhibited their activity.
Regular-Firing Neuron Activity at Reward Zones
The relative increases in activity across the population of regular-firing neurons as rats approached and reached feeders indicate that the network encodes information about outcomes and the situations in which they are encountered. To examine whether increased activity levels were specifically related to reward expectation, we compared levels of regular-firing neuron activity during correct and incorrect trials on both high-performing and low-performing sessions.
On average, 15% of individual regular-firing neurons significantly discriminated between correct and incorrect trials during the trial phase immediately prior to rats reaching the feeder zone (Wilcoxon rank-sum test for each neuron, proportion averaged across rats, α = 0.01; Fig. 4A,B); however, the net activity of all regular-firing projection neurons did not discriminate between these two conditions during this time (paired t-test on within-rat average firing rates, n = 5, P = 0.63; Fig. 4C). This was true for both high-performing and low-performing sessions (two-way ANOVA, error vs. reward: F1,19 = 0.41, P = 0.53, pre- vs. postswitch day: F1,19 = 0, P = 0.97; interaction: F1,19 = 0.22, P = 0.64). Net activity began to discriminate between the two outcomes no earlier than 150 ms after outcome presentation (Fig. 4D). Activity levels in fast-spiking inhibitory neurons also did not discriminate between correct and incorrect trials prior to outcome presentation (Fig 4E,F; two-way ANOVA error vs. reward: F1,17 = 0.77, P = 0.40, pre- vs. postswitch: F1,17 = 0.22, P = 0.65, interaction: F1,17 = 0.05, P = 0.82), although this population of neurons may have been faster to discriminate between correct and incorrect trials following outcome presentation (Fig. 4E,F).
Figure 4.
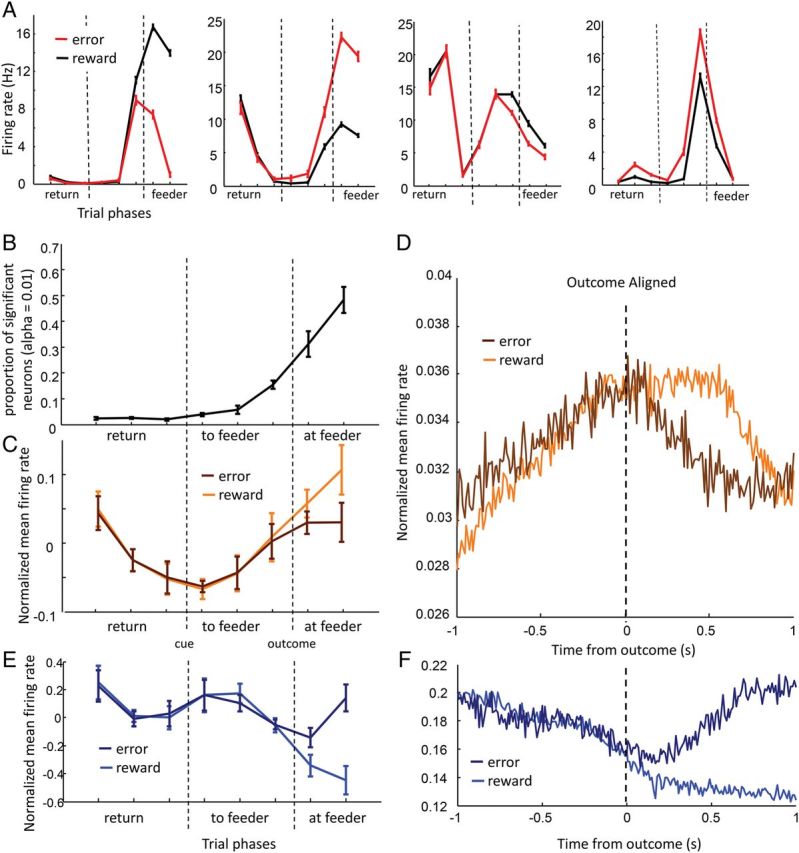
Regular-firing neuron activity on correct and incorrect trials. (A) Firing patterns across trial phases of a representative sample of 4 neurons in rewarded (red) and unrewarded (black) trials. Many individual cells discriminated error and reward trials prior to delivery of the outcome. The four examples include neurons that apparently predicted reward or error outcome (first and second plot), a neuron with a bidirectional field that fired on the way to and from the feeder zones (third plot), and a neuron that was sharply tuned to a particular trial phase, and may have generally been more activity during a phase of the task associated with more errors (as firing rates differed even before cues were delivered). (B) Proportion of regular-firing projection neurons that significantly differentiated between correct and incorrect trials at each 500-ms trial phase (Wilcoxon rank-sum test, α = 0.01). Black trace represents average proportions across 5 rats, error bars are SEM across rats. Prior to presentation of decision cues, the number of neurons differentiating between a correct and incorrect trial approximates chance, given the chosen acceptance levels (α = 0.01). Many regular-firing projection neurons fired differently on correct versus incorrect trials after presentation of the error sound or click of the feeder solenoid. Many (∼15%) also fired differently on correct versus incorrect trials immediately before outcomes were presented (trial phase 6), suggesting that rats had knowledge about whether they may be committing an error. (C) Net levels of activity across the population of regular-firing projection neurons for rewarded (orange) and error (brown) trials. Firing rates for individual neurons were first z-score normalized across all trials and trial phases, then averaged across rewarded or error trials, and then averaged within rats. Error bars are SEM. Activity levels only discriminated between reward and error trials in the final trial phase, 500–1000 ms after outcomes were presented, suggesting that increases in net activity were not due to reward or its expectation alone, and instead could be said to relate either to outcome more generally, or to other information related to the circumstances in which rewards were encountered in the past. (D) Average PETHs of regular-firing projection neuron firing rates locked to outcome presentation, binned at 10 ms. There is no evidence of discrimination between trial types for the first 150 ms. (E) Net levels of activity across the population of fast-spiking inhibitory neurons for rewarded (light blue) and error (dark blue) trials. In contrast with regular-firing projection neurons, activity on the two trial types was significantly different during the first 500 ms following outcome presentation. (F) Average PETHs of fast-spiking inhibitory neuron firing rates locked to outcome presentations, binned at 10 ms. Discrimination between error and reward trials appeared to be slightly earlier than in the population of regular-firing projection neurons.
Regular-Firing Neurons Discriminate Behavioral Context of Task versus Rest
Before and after rats were placed in the task apparatus, they were required to sit in a small chamber placed above the apparatus. Rats slept for only a minority of these rest periods (average 2.4 ± 2.4% SD of time within 1-min periods of motionlessness during preceding rest, 14 ± 11% during the rest period following task performance), yet there was a strong dissociation between neuron classes in the degree to which they dissociated the task and rest epochs.
In general, firing rates of both putative inhibitory and projection neurons increased during task compared with rest epochs (paired t-test across neurons, inhibitory: P = 7.2 × 10⁻⁴, projection = 2.0 × 10⁻⁶). Although activity among fast-spiking and regular-firing neurons was higher during task epochs (Fig. 5A,B; paired t-test across neurons, fast spiking: P = 0.0042, regular firing: P = 4.9 × 10⁻⁷; one-way ANOVA of z-score normalized firing rates across 4 session epochs n = 5 rats, fast spiking: F3,16 = 3.51, P = 0.040, regular firing: F3,16 = 10.4, P = 5.0 × 10⁻⁴), activity of burst-firing neurons did not change significantly (Fig. 5B; P = 0.77).
Figure 5.

Neuron activity in task versus rest epochs. (A) Distribution of firing rates for fast-spiking (blue), regular-firing (orange), and burst-firing (green) neurons during performance of the task (x-axis) and during rest (y-axis) epochs. Average firing rates were high for fast-spiking neurons, and these cells tended to fire at similar rates between epochs (though slightly reduced during rest). Firing rates were lower for regular-firing neurons, and were less correlated between task and rest epochs. Most regular-firing and fast-spiking neuron rates fell below the graph diagonal, suggesting that firing rates tended to be higher during the task epoch. (B) Firing rates normalized across epochs, averaged within groups. Both fast-spiking and regular-firing neurons fired at higher rates during the task epoch (error bars SEM across 5 rats). (C) Correlation coefficients between epochs for population firing rate vectors across neuron classes. In fast-spiking and burst-firing neurons, population firing rate vectors were highly correlated between task and rest epochs; in regular-firing neurons, populations were less correlated, meaning that a relatively distinct set of regular-firings neurons was active during the 2 epochs, and therefore that the population represented the 2 behavioral conditions differently.
Activity among the populations of both fast-spiking and regular-firing neurons was higher during the task epoch; however, individual regular-firing neurons were typically highly selective for either task or rest epochs, while the activity levels of individual fast-spiking neurons did not change as strongly between epochs. To measure changes in the neuron population state, correlation coefficients were computed between the vector of cell firing rates in task compared against rest epochs. High correlation coefficients between epochs were found within the population of fast-spiking (mean across rats = 0.94) and burst-firing (0.84) neurons, indicating that, to a large extent, the same neurons fired during both conditions (Fig. 5C). The correlation between task and rest was significantly lower, however, among regular-firing neurons (0.51; one-way ANOVA of correlates between cell types in 5 rats: F2,12 = 22.6, P = 8.5 × 10⁻⁵), indicating that firing rates of many neurons changed between the epochs. Importantly, the same magnitude of change was not observed between the first and second rest epoch (0.82 correlation) or between the first and second half of the session (0.93 correlation; one-way ANOVA of rest–rest, task–task, and rest–task correlations: F2,12 = 66.9, P = 3.1 × 10⁻⁷). Thus, changes in the state of population activity among regular-firing neurons between task epochs were not due strictly to the passage of time.
Reductions of Movement-Related Activity in More Ventral Regions
Although the degree of selectivity for trial phase did not differ between medial precentral, dorsal anterior cingulate, dorsal prelimbic, and ventral prelimbic regions (one-way ANOVA of within-rat, log information means, P > 0.4 for each of the 3 neuron classes), there was a modest but still apparent shift in the relative activity at reward sites in the more ventral regions. For regular-firing, putative projection neurons, this shift was most evident as an increase in the proportion of cells with peak firing rates when rats encountered rewards (Fig. 6A; one-way ANOVA across rats: F3,16 = 3.45, P = 0.049). Regular-firing neurons in the dorsal prelimbic cortex also exhibited more overall activity during rest compared against task epochs (Fig. 6B; n = 5 rats, one-way ANOVA across regions: F3,13 = 6.83, P = 0.0053, post hoc Tukey test, all regions significantly different from dorsal prelimbic cortex). Increased reward-zone firing was not directly observed in either burst-firing neurons or putative inhibitory cells. However, among the smaller population of “gamma-frequency” fast-spiking neurons—those fast-spiking neurons which exhibited a clear autocorrelation peak in the 40–70 Hz “gamma” range—there was a clear transition from cue-zone to reward-site activity along the dorsal–ventral axis (Fig. 6C,D; correlation between dorsal–ventral position and [firing rate at outcome – firing rate at cue]/[firing rate at outcome + firing rate at cue]: n = 58, correlation coefficient = 0.4, sum of square residuals = 5.4, P = 4 × 10⁻⁴; one-way ANOVA testing for effect of region across cells: F3,57 = 5.22, P = 0.003, post hoc Tukey test shows significant differences between medial precentral vs. dorsal and ventral prelimbic cortex).
Figure 6.
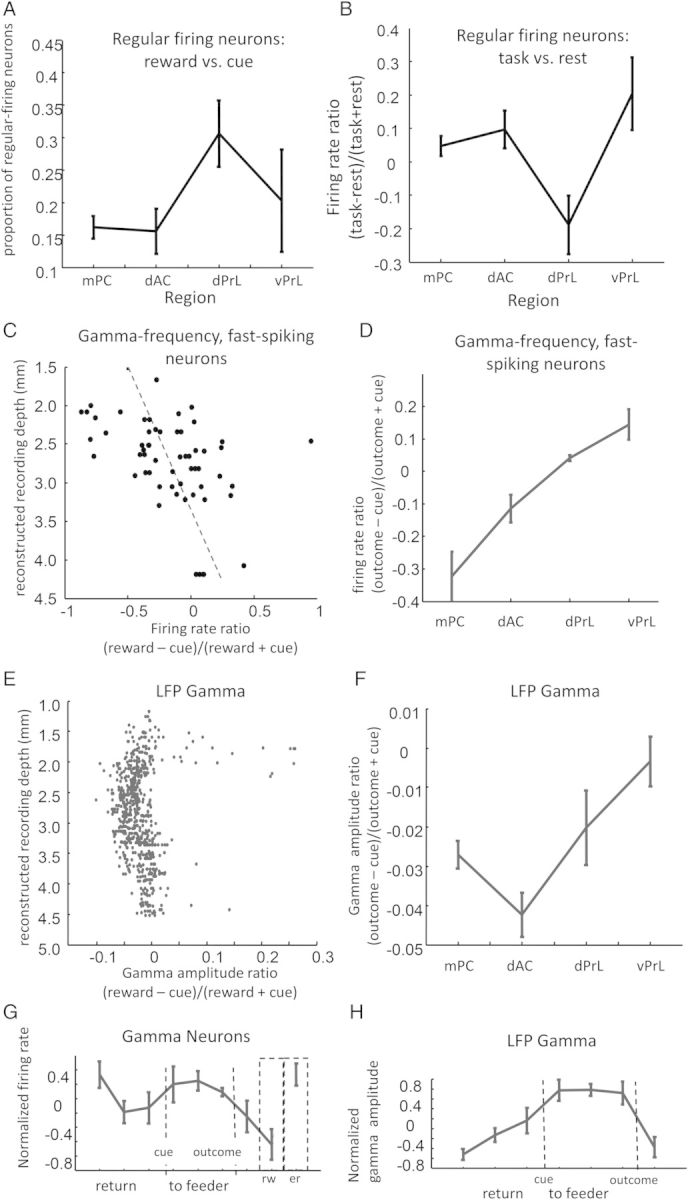
Shift in network activity from cue zones to reward sites at more ventral recording locations. (A) Electrodes localized to the prelimbic cortex, ventral to the dorsal anterior cingulate cortex, exhibited a higher proportion of regular-firing neurons that were most active during the reward phase of the decision trial. (B) While, on average, regular-firing neurons in the medial prefrontal cortex fired more during the task epoch, neurons in the dorsal prelimbic cortex fired more during the rest epoch (y-axis is a score relating the firing rate in the task epoch compared with firing rates in the rest epoch with range [−1, +1]). (C) A subset of fast-spiking neurons tended to fire at the frequency of gamma during the task epoch; as with the larger set of fast-spiking neurons, the average activity in these neurons was higher when cues were presented, and lower during the reward. This tendency gradually shifted as recording electrodes were lowered more ventrally into the medial prefrontal cortex, as illustrated by the relationship between recording depth (y-axis) and the ratio of activity at feeder versus cue zones (x-axis). (D) There was a significant relationship between recording region and relative activity of the gamma-frequency, fast-spiking neurons during cue versus outcome periods. (E) The relative strength of LFP gamma during the cue period compared with during the outcome period was reduced in the most ventral and most dorsal recording electrodes. One explanation for why gamma power patterns at more dorsal sites did not match firing patterns of fast-spiking neurons may be that the LFP signals were contaminated by proximity to the reference electrode. (F) Consistent with patterns observed in fast-spiking neurons, relative gamma amplitude during the cue versus outcome trial phases changed across the regions that the recordings were made. (G) Gamma-frequency neuron firing patterns over trial phases resembled that of the larger set of fast-spiking neurons (error bars SEM across rats; rw, reward; er, error). (H) Relative amplitude of LFP gamma from all recording electrodes (averaged within rats, then across rats; trial phases 8 and 9 omitted due to licking artifact at the feeder). Gamma amplitude was also higher when rats were at the cue zone and lower when rats entered the feeder zone, although unlike the population of inhibitory neurons, amplitude was relatively lower when rats initiated a return back from feeder zones.
The patterns observed within the subpopulation of gamma-frequency neurons paralleled a more global phenomenon revealed by LFPs. LFPs exhibited a dorsal–ventral shift in their relative gamma power at cue zones compared with feeder zones (Fig. 6E,F; one-way ANOVA on median gamma power, testing for the effect of region across rats: F3,13 = 3.3, P = 0.049). One difference between the regional patterns observed in the LFP gamma power compared with those observed in fast-spiking neuron activity occurred in the LFP recordings of medial precentral cortex near the brain surface. Here, the differential gamma power observed at cue zones became reduced relative to power at feeder zones (Fig. 6E). It is likely that this effect was due to the position of the reference electrode at the brain surface; if the reference electrode was close enough to the recording electrode to detect the same gamma oscillations, then LFP gamma may have been subtracted-out of the recordings at both trial phases. Another notable difference between the patterns of firing among gamma-frequency neurons and LFP gamma power was that the neuron population was typically active during trial phase 1, as rats initiated their return to the cue zone, while gamma power was relatively low during this trial phase (Fig. 6G,H; note that LFPs could not be analyzed during the final outcome phase due to licking artifact at the feeder). Although it is not clear what accounts for this discrepancy, it serves as a reminder that local network activity, directly accessible by neuron firing patterns, can only be partially captured by field potentials.
Further analysis suggested that reductions in neuron correlations with movement may at least partially explain the shift in trial phase activity. Regular-firing projection neurons in more dorsal regions exhibited stronger correlations with angular velocity at the cue zone (one-way ANOVA, 5 rats: F3,16 = 3.41, P = 0.050) and upon turning away from the feeder zone (F3,16 = 7.62, P = 0.0034). The same pattern was not evident in inhibitory neurons averaged within rats (angular velocity at cue zone: F3,16 = 1.12, P = 0.38); although pooling inhibitory neurons across rats did reveal an apparent increase in correlations with angular velocity as rats left the feeder zones (F3,142 = 6.63, P = 3.0 × 10⁻⁴).
Discussion
The design of the present experiment allowed several novel observations to be made about the behavioral correlates of different cell types within the medial frontal cortex, providing the foundation for a theoretical framework of circuit function. Regular-firing, wide-waveform neurons were differentially activated when rats were in the proximity of previously acquired reward, whereas fast-spiking, narrow-waveform neurons were differentially correlated with the animal's acceleration—particularly during rotation—and upon encountering salient sensory stimuli in the environment. These dissociations were observed even in pairs of regular-firing and fast-spiking neurons that exhibited reciprocal, excitatory–inhibitory connections, as determined by cross-correlation patterns. Regular-firing projection neurons were uniquely selective for the animal's behavioral situation relative to the other neuron types. This included high information for trial phase, outcomes and outcome expectation, and behavioral epoch. The increased activity of this population at reward zones can therefore be thought of as a code for a situation's value that is built from the summed excitation of neural elements coding for behavioral context. The higher levels of fast-spiking inhibitory neuron activity during increased sensory flow may meanwhile normalize excitation levels in the regular-firing neuron population so that value codes do not become conflated with sensory stimulation.
Regular-Firing Neurons: Superimposed Codes for Situation and Situation Value?
The activity of individual regular-firing neurons was highly selective for a rat's behavioral situation, including whether the rat was in “task” versus “rest” session epochs (consistent with Hyman et al. 2012), what its position was within a sequence of behaviors on the decision task (consistent with Euston et al. 2007; Fujisawa et al. 2008; Kim et al. 2013; Ma et al. 2014) and what the expected outcome of its decision might be on a particular trial (consistent with Pratt and Mizumori 2001; Lapish et al. 2008; Sul et al. 2010; Hyman et al. 2013). These representations require a complex convergence of information about the animal's environment and current set of movements. In principle, this type of “context” code could become associated, through synapses with efferent regions, with any number of relevant details about the situation. For example, connections between the medial frontal cortex and sensorimotor regions may help select context-appropriate action and attentional sets, consistent with behavioral effects of lesions to the region (Haddon and Killcross 2006; Kennerley et al. 2006; Buckley et al. 2009). The context code may also coordinate activity across brain regions to provide an associative link between the distributed elements of a memory (Frankland and Bontempi 2005). The ability of the medial frontal cortex to coordinate memory-related activity does not have to be direct, and may rely on connections between the medial frontal cortex and the entorhinal cortex (Insel and Takehara-Nishiuchi 2013). The general theme of these hypotheses is consistent with the theory of prefrontal cortex function outlined by Miller and Cohen (2001).
The total activity level across these regular-firing projection neurons was higher at reward sites. This observation extends previous work showing that with place-selective neuron firing in the medial frontal cortex clusters around goal locations (Hok et al. 2005). Thus, superimposed upon the high-dimensional code for behavioral context, the network appears to contain a simple, scalar code for the value of the animal's situation, measured as the total amount of activity across the population of projection neurons. The ensuing question is how this network phenomenon contributes to brain function. One possibility is that the scalar code weights the impact the medial frontal cortex has on efferent cortical regions. This idea is intuitive, in that more active presynaptic neurons should mean more active synapses, and therefore stronger control over the postsynaptic neurons. Another possibility is that the scalar code is read-out specifically in regions that process reward and operate on relatively few dimensions, such as compartments of the basal ganglia or brainstem nuclei like the ventral tegmental area and raphe nuclei (i.e., the dopaminergic and serotonergic systems). In this scenario, neurons in the efferent region would likely receive convergent projections from many regular-firing neurons with relatively similar synaptic weights (so that postsynaptic activity depends on the number of presynaptic cells firing rather than a particular set of neurons). A third possibility is that the scalar code does not have a function in and of itself, but represents the combined activity of more than one parallel output stream projecting to different regions at the same time. This hypothesis predicts that a subpopulation of regular-firing neurons project to a specific set of efferent regions and also becomes differentially active under high-value conditions.
A lingering question still remains regarding how increased activity related to higher valued contexts forms in the circuit. Two explanations are worth considering: 1) Neurons providing feed-back and feed-forward inhibition, such as the fast-spiking inhibitory neurons (discussed in the next section), are inhibited by reward or the circumstances surrounding its expectation, thus causing excitatory neurons to be disinhibited; 2) synaptic connectivity onto excitatory neurons is stronger for high-valued circumstances. In the present data, PETHs of fast-spiking, narrow-waveform neurons at the times that outcomes were presented did appear to be momentarily decoupled from the rat's acceleration, suggesting that these neurons may in fact have been inhibited during outcome presentation, and in particular during reward. This explanation is further supported by recent work by Pi et al. (2013), which found that a particular inhibitory neuron type containing vasoactive intestinal polypeptide is capable of transiently suppressing the activity of particular types of interneurons—including a proportion of parvalbumin-expressing neurons—to disinhibit the excitatory neuron population. An attempt was also made in the present study to address the second possibility that excitatory connections are stronger for neurons coding circumstances surrounding reward, by examining whether excitatory cross-correlations were stronger during the outcome period. The results of this analysis were ambiguous, as the present paradigm was not ideal for addressing the question fully. However, since high-valued situations must be learned through experience, one can imagine a scenario in which reward-modulated synaptic plasticity (such as may be mediated in this region by the dopamine system; Jay 2003) reinforces afferent and local connections onto projection neurons without reinforcing those same connections onto inhibitory neurons. These two explanations, disinhibition and increased excitatory connectivity, are not mutually exclusive, and may very well complement one-another in pushing the circuit toward increased excitation during high-value situations.
Fast-Spiking Neurons and Sensorimotor Processing
Fast-spiking and narrow-waveform, putative inhibitory cells increased activity during exposure to task cues and during movement initiation. Fast-spiking neurons have been morphologically identified as basket or chandelier cells that express the calcium-binding protein parvalbumin (Kawaguchi et al. 1987; Kawaguchi and Kubota 1997), and these cells are highly connected within local networks (DeFelipe et al. 1989; Hendry et al. 1989). The function of these neurons can best be understood in two contexts: First, they provide local networks with feed-forward and feed-back inhibition that effectively “divides” inputs onto principle neurons in the region (Wilson et al. 2012); and second, they synchronize local activity within the 30- to 80-Hz gamma frequency (Cardin et al. 2009). These functions accompany increases in the signal to noise of neuron firing in the local network (Sohal et al. 2009).
The idea that fast-spiking neurons provide feed-forward inhibition to the circuit is consistent with the observed increase in firing among these neurons evoked by the auditory decision cue. Earlier work has shown that stimulation of posterior cortical regions, such as the entorhinal cortex, evokes widespread inhibition in the medial frontal cortex, including firing rate increases among candidate inhibitory neurons (White et al. 1990; note that similar patterns have been reported for inhibitory neurons in the hippocampus; Fox and Ranck 1981; Buzsáki and Eidelberg 1982). Firing rate increases during the onset of the auditory cue in the present study were also consistent with observations made by Baeg et al. (2001), who found that fast-spiking neuron activity was often evoked by presentation of a conditioned stimulus in a fear-conditioning task. Using a similar paradigm, Courtin et al. (2014) isolated several fast-spiking neurons that expressed parvalbumin and found that the neurons decreased in response to a conditioned stimulus. Based on the results of the present study, these data may be considered in the context of correlations between fast-spiking inhibitory neuron firing and movement acceleration—in this case, the deceleration associated with freezing to the conditioned stimulus. Similarly, Kvitsiani et al. (2013) observe that parvalbumin-positive neurons increase activity as animals exit a reward zone, a pattern that is directly in line with the presently observed positive correlations between fast-spiking neuron activity and movement acceleration.
Fast-spiking neuron activity in the present study was not homogeneous, but activity levels were generally correlated with acceleration, particularly during turns, and this was not affected by reward probability. Based on the principle that fast-spiking neuron activity is “dividing” activity in the local network, the correlation suggests that activity within the medial frontal cortex might be normalized according to sensory flow. This may provide a mechanism by which the network can form conjunctive representations of environmental situations while restricting output levels so that they do not depend on incoming sensory flow. Failures to perform such a normalization could result in the brain interpreting increased sensory flow as a valued stimulus, thus leading to sensory gating deficits. Schizophrenia is one pathology that includes both sensory gating deficits and interneuron abnormalities in the medial frontal cortex (e.g., Curley and Lewis 2012).
Burst-Firing Versus Regular-Firing Neurons
Of all observations in the present experiment, the behavioral correlates of burst-firing, wide-waveform neurons remain the most mysterious. Many burst-firing cells were, as with fast-spiking neurons, selective for periods in which decision cues were presented; however, an even higher proportion of neurons fired before rats reached the cue zone. In distinct contrast to regular-firing neurons, the overall firing rates of burst-firing neurons did not distinguish between the behavioral states of task performance and rest. At minimum, these patterns reveal fundamental differences in the type of information transmitted by the two neuron types in medial frontal cortex.
The observation that excitatory projection neurons in the cortex have either “burst-firing” or “regular-firing” characteristics dates back many decades (e.g., Calvin and Sypert 1976; reviewed by Connors and Gutnick 1990). In the rodent medial frontal cortex, recordings made in vivo (Dégenètais et al. 2002; Barthó et al. 2004) and in vitro (McCormick et al. 1985; Chang and Luebke 2007), consistently find both regular-firing and burst-firing neuron types, with burst-firing neurons generally being observed in superficial layer V. The burst characteristics can be explained by membrane conductance dynamics that are intrinsic to the neurons (Connors and Gutnick 1990; Guatteo et al. 1996; Yang et al. 1996; Nishimura et al. 2001). The differences between the neuron types also extend beyond their firing properties. Synaptic connection patterns suggest that burst-firing neurons may be capable of integrating excitatory inputs across several cortical columns, while regular-firing neurons may only integrate inputs within a column (Schubert et al. 2001). Burst-firing neurons exhibit different morphologies compared with regular-firing neurons (Chagnac-Amitai et al. 1990; Agmon and Connors 1992; Zhu and Connors 1999). Cells with these distinguishable morphologies tend to project to different regions: those associated with bursting more often project to thalamus, pons, and colliculus, while morphologies associated with regular-firing tend to project within the cortex or to the striatum (Gao and Zheng 2004; Le Bé et al. 2007; but see Yang et al. 1996, who found that bursting neurons are those which project to the ventral striatum).
Based on the patterns observed in the present study, it is clear that the information transmitted by burst-firing versus regular-firing neurons is distinct, which complements anatomical data on the differences between their dendritic and axonal extensions. A better understanding of the specific functions of the two neuron types will emerge from the continued use of cell-type-specific analyses in future electrophysiological investigations.
Value Representations Based on Long-Term History
Not all of the results presented are consistent with a role of projection neuron activity levels providing a code for situation value. For example, the overall activity of fast-spiking and regular-firing neurons did not change in a systematic way following the switches in reward contingency. Also, there was no evidence that activity levels of either regular-firing or fast-spiking populations changed immediately prior to the outcome on incorrect trials, although this information was clearly present in the neuron population. Both of these comparisons, pre- versus postswitch and pre-error versus prereward, gauge the degree to which population activity is modified by an animal's recent history, and it may be the case that the circuit architecture responsible for levels of excitation is not affected by this recent history. In other words, while the activity of individual neurons may be sensitive to trial-by-trial changes in reward expectation, the circuit mechanisms that account for overall activity among regular-firing projection neurons are not themselves affected by this information. These circuit mechanisms may instead be built more gradually, and reflect the long-term history of contingencies between behavioral or spatial situations and reward.
A value code that does not change with reward expectation between trials and sessions raises important questions about its contribution to behavior. Ventral regions of medial frontal cortex are known to be important for an animal's ability to behaviorally adapt following changes in environmental contingencies (Birrell and Brown 2000; Ragozzino et al. 2003; Rich and Shapiro 2007), a function that has been the subject of a number of electrophysiological investigations (Rich and Shapiro 2009; Benchenane et al. 2010; Durstewitz et al. 2010; Karlsson et al. 2012). The scalar code for value described in the present experiment does not appear to be dynamic enough to account for this function; albeit, most neurons were recorded from more dorsal regions than those implicated in behavioral switches. Kolling et al. (2012) also proposed that part of the caudal anterior cingulate cortex tracks the relative value of exploring alternative choice sets (foraging). The paradigm used in the present experiment did not provide a foraging option, and exploration behaviors were relatively absent in highly trained animals; however, from a theoretical point of view, a scalar and slowly updating code for situation value may be an important element in decisions of “where and when” to abandon current behaviors for the sake of exploration. Techniques to monitor neuron population activity will be integral to testing these ideas; but equally important, and potentially more difficult, will be identifying the right behavioral paradigms in which to apply them.
Supplementary Material
Supplementary material can be found at: http://www.cercor.oxfordjournals.org/.
Funding
This work was supported by National Institute of Aging AG012609 and McKnight Brain Research Foundation.
Supplementary Material
Notes
We thank L. Patron and J. Vega for help with data collection and histology, K. Bohne for help with electrode drives, and P. Lipa, S. Cowen, and K. Takehara-Nishiuchi for comments on manuscript. Conflict of Interest: None declared.
References
- Agmon A, Connors BW. 1992. Correlation between intrinsic firing patterns and thalamocortical synaptic responses of neurons in mouse barrel cortex. J Neurosci. 12:319–329. [DOI] [PMC free article] [PubMed] [Google Scholar]
- Baeg EH, Kim YB, Jang J, Kim HT, Mook-Jung I, Jung MW. 2001. Fast spiking and regular spiking neural correlates of fear conditioning in the medial prefrontal cortex of the rat. Cereb Cortex. 11:441–451. [DOI] [PubMed] [Google Scholar]
- Barthó P, Hirase H, Monconduit L, Zugaro M, Harris KD, Buzsáki G. 2004. Characterization of neocortical principal cells and interneurons by network interactions and extracellular features. J Neurophysiol. 92:600–608. [DOI] [PubMed] [Google Scholar]
- Benchenane K, Peyrache A, Khamassi M, Tierney PL, Gioanni Y, Battaglia FP, Wiener SI. 2010. Coherent theta oscillations and reorganization of spike timing in the hippocampal-prefrontal network upon learning. Neuron. 66:921–936. [DOI] [PubMed] [Google Scholar]
- Birrell JM, Brown VJ. 2000. Medial frontal cortex mediates perceptual attentional set shifting in the rat. J Neurosci. 20:4320–4324. [DOI] [PMC free article] [PubMed] [Google Scholar]
- Bock DD, Lee W-CA, Kerlin AM, Andermann ML, Hood G, Wetzel AW, Yurgenson S, Soucy ER, Kim HS, Reid RC. 2011. Network anatomy and in vivo physiology of visual cortical neurons. Nature. 471:177–182. [DOI] [PMC free article] [PubMed] [Google Scholar]
- Buckley MJ, Mansouri FA, Hoda H, Mahboubi M, Browning PGF, Kwok SC, Phillips A, Tanaka K. 2009. Dissociable components of rule-guided behavior depend on distinct medial and prefrontal regions. Science. 325:52–58. [DOI] [PubMed] [Google Scholar]
- Buzsáki G. 1984. Feed-forward inhibition in the hippocampal formation. Prog Neurobiol. 22:131–153. [DOI] [PubMed] [Google Scholar]
- Buzsáki G, Eidelberg E. 1982. Direct afferent excitation and long-term potentiation of hippocampal interneurons. J Neurophysiol. 48:597–607. [DOI] [PubMed] [Google Scholar]
- Calvin WH, Sypert GW. 1976. Fast and slow pyramidal tract neurons: an intracellular analysis of their contrasting repetitive firing properties in the cat. J Neurophysiol. 39:420–434. [DOI] [PubMed] [Google Scholar]
- Cardin JA, Carlén M, Meletis K, Knoblich U, Zhang F, Deisseroth K, Tsai L-H, Moore CI. 2009. Driving fast-spiking cells induces gamma rhythm and controls sensory responses. Nature. 459:663–667. [DOI] [PMC free article] [PubMed] [Google Scholar]
- Chagnac-Amitai Y, Luhmann HJ, Prince DA. 1990. Burst generating and regular spiking layer 5 pyramidal neurons of rat neocortex have different morphological features. J Comp Neurol. 296:598–613. [DOI] [PubMed] [Google Scholar]
- Chang Y-M, Luebke JI. 2007. Electrophysiological diversity of layer 5 pyramidal cells in the prefrontal cortex of the rhesus monkey: in vitro slice studies. J Neurophysiol. 98:2622–2632. [DOI] [PMC free article] [PubMed] [Google Scholar]
- Chapin JK, Nicolelis MAL. 1999. Principal component analysis of neuronal ensemble activity reveals multidimensional somatosensory representations. J Neurosci Methods. 94:121–140. [DOI] [PubMed] [Google Scholar]
- Connors BW, Gutnick MJ. 1990. Intrinsic firing patterns of diverse neocortical neurons. Trends Neurosci. 13:99–104. [DOI] [PubMed] [Google Scholar]
- Courtin J, Chaudun F, Rozeske RR, Karalis N, Gonzalez-Campo C, Wurtz H, Abdi A, Baufreton J, Bienvenu TCM, Herry C. 2014. Prefrontal parvalbumin interneurons shape neuronal activity to drive fear expression. Nature. 505:92–96. [DOI] [PubMed] [Google Scholar]
- Cowen SL, McNaughton BL. 2007. Selective delay activity in the medial prefrontal cortex of the rat: contribution of sensorimotor information and contingency. J Neurophysiol. 98:303–316. [DOI] [PMC free article] [PubMed] [Google Scholar]
- Csicsvari J, Hirase H, Czurko A, Buzsáki G. 1998. Reliability and state dependence of pyramidal cell-interneuron synapses in the hippocampus: an ensemble approach in the behaving rat. Neuron. 21:179–189. [DOI] [PubMed] [Google Scholar]
- Curley AA, Lewis DA. 2012. Cortical basket cell dysfunction in schizophrenia. J Physiol. 590:715–724. [DOI] [PMC free article] [PubMed] [Google Scholar]
- DeFelipe J, Hendry SHC, Jones EG. 1989. Visualization of chandelier cell axons by parvalbumin immunoreactivity in monkey cerebral cortex. Proc Natl Acad Sci USA. 86:2093–2097. [DOI] [PMC free article] [PubMed] [Google Scholar]
- Dégenètais E, Thierry A-M, Glowinski J, Gioanni Y. 2002. Electrophysiological properties of pyramidal neurons in the rat prefrontal cortex: an in vivo intracellular recording study. Cereb Cortex. 12:1–16. [DOI] [PubMed] [Google Scholar]
- Durstewitz D, Vittoz NM, Floresco SB, Seamans JK. 2010. Abrupt transitions between prefrontal neural ensemble states accompany behavioral transitions during rule learning. Neuron. 66:438–448. [DOI] [PubMed] [Google Scholar]
- Eggermont JJ. 1992. Neural interaction in cat primary auditory cortex. Dependence on recording depth, electrode separation, and age. J Neurophysiol. 68:1216–1228. [DOI] [PubMed] [Google Scholar]
- Eggermont JJ, Smith GM. 1996. Neural connectivity only accounts for a small part of neural correlation in auditory cortex. Exp Brain Res. 110:379–391. [DOI] [PubMed] [Google Scholar]
- Euston DR, Tatsuno M, McNaughton BL. 2007. Fast-forward playback of recent memory sequences in prefrontal cortex during sleep. Science. 318:1147–1150. [DOI] [PubMed] [Google Scholar]
- Fox SE, Ranck JB., Jr 1981. Electrophysiological characteristics of hippocampal complex-spike cells and theta cells. Exp Brain Res. 41:399–410. [DOI] [PubMed] [Google Scholar]
- Frankland PW, Bontempi B. 2005. The organization of recent and remote memories. Nat Rev Neurosci. 6:119–130. [DOI] [PubMed] [Google Scholar]
- Fujisawa S, Amarasingham A, Harrison MT, Buzsáki G. 2008. Behavior-dependent short-term assembly dynamics in the medial prefrontal cortex. Nat Neurosci. 11:823–833. [DOI] [PMC free article] [PubMed] [Google Scholar]
- Gao W-J, Zheng Z-H. 2004. Target-specific differences in somatodendritic morphology of layer V pyramidal neurons in rat motor cortex. J Comp Neurol. 476:174–185. [DOI] [PubMed] [Google Scholar]
- Guatteo E, Franceschetti S, Bacci A, Avanzini G, Wanke E. 1996. A TTX-sensitive conductance underlying burst firing in isolated pyramidal neurons from rat neocortex. Brain Res. 741:1–12. [DOI] [PubMed] [Google Scholar]
- Haddon JE, Killcross S. 2006. Both motivational and training factors affect response conflict choice performance in rats. Neural Netw. 19:1192–1202. [DOI] [PubMed] [Google Scholar]
- Haider B, Duque A, Hasenstaub AR, McCormick DA. 2006. Neocortical network activity in vivo is generated through a dynamic balance of excitation and inhibition. J Neurosci. 26:4535–4545. [DOI] [PMC free article] [PubMed] [Google Scholar]
- Hendry SHC, Jones EG, Emson PC, Lawson DEM, Heizmann CW, Streit P. 1989. Two classes of cortical GABA neurons defined by differential calcium binding protein immunoreactivities. Exp Brain Res. 76:467–472. [DOI] [PubMed] [Google Scholar]
- Hillman KL, Bilkey DK. 2010. Neurons in the rat anterior cingulate cortex dynamically encode cost-benefit in a spatial decision-making task. J Neurosci. 30:7705–7713. [DOI] [PMC free article] [PubMed] [Google Scholar]
- Hok V, Save E, Lenck-Santini PP, Poucet B. 2005. Coding for spatial goals in the prelimbic/infralimbic area of the rat frontal cortex. Proc Natl Acad Sci USA. 102:4602–4607. [DOI] [PMC free article] [PubMed] [Google Scholar]
- Hyman JM, Ma L, Balaguer-Ballester E, Durstewitz D, Seamans JK. 2012. Contextual encoding by ensembles of medial prefrontal cortex neurons. Proc Natl Acad Sci USA. 109:5086–5091. [DOI] [PMC free article] [PubMed] [Google Scholar]
- Hyman JM, Whitman J, Emberly E, Woodward TS, Seamans JK. 2013. Action and outcome activity state patterns in the anterior cingulate cortex. Cereb Cortex. 23:1257–1268. [DOI] [PubMed] [Google Scholar]
- Insel N. 2010. Physiology of the medial frontal cortex during decision-making in adult and senescent rats (Ph.D.) [dissertation]. Tucson, AZ: University of Arizona. (p. 346). [Google Scholar]
- Insel N, Patron LA, Hoang LT, Nematollahi S, Schimanski LA, Lipa P, Barnes CA. 2012. Reduced gamma frequency in the medial frontal cortex of aged rats during behavior and rest: implications for age-related behavioral slowing. J Neurosci. 32:16331–16344. [DOI] [PMC free article] [PubMed] [Google Scholar]
- Insel N, Takehara-Nishiuchi K. 2013. The cortical structure of consolidated memory: a hypothesis on the role of the cingulate-entorhinal cortical connection. Neurobiol Learn Mem. 106:343–350. [DOI] [PubMed] [Google Scholar]
- Jay TM. 2003. Dopamine: a potential substrate for synaptic plasticity and memory mechanisms. Prog Neurobiol. 69:375–390. [DOI] [PubMed] [Google Scholar]
- Karlsson MP, Tervo DGR, Karpova AY. 2012. Network resets in medial prefrontal cortex mark the onset of behavioral uncertainty. Science. 338:135–139. [DOI] [PubMed] [Google Scholar]
- Kawaguchi Y, Katsumaru H, Kosaka T, Heizmann CW, Hama K. 1987. Fast spiking cells in rat hippocampus (CA1 region) contain the calcium-binding protein parvalbumin. Brain Res. 416:369–374. [DOI] [PubMed] [Google Scholar]
- Kawaguchi Y, Kubota Y. 1997. GABAergic cell subtypes and their synaptic connections in rat frontal cortex. Cereb Cortex. 7:476–486. [DOI] [PubMed] [Google Scholar]
- Kehrer C, Maziashvili N, Dugladze T, Gloveli T. 2008. Altered excitatory-inhibitory balance in the NMDA-hypofunction model of schizophrenia. Front Mol Neurosci. 1:6. [DOI] [PMC free article] [PubMed] [Google Scholar]
- Kennerley SW, Walton ME, Behrens TEJ, Buckley MJ, Rushworth MFS. 2006. Optimal decision making and the anterior cingulate cortex. Nat Neurosci. 9:940–947. [DOI] [PubMed] [Google Scholar]
- Kim J, Ghim J-W, Lee JH, Jung MW. 2013. Neural correlates of interval timing in rodent prefrontal cortex. J Neurosci. 33:13834–13847. [DOI] [PMC free article] [PubMed] [Google Scholar]
- Kolling N, Behrens TEJ, Mars RB, Rushworth MFS. 2012. Neural mechanisms of foraging. Science. 336:95–98. [DOI] [PMC free article] [PubMed] [Google Scholar]
- Kvitsiani D, Ranade S, Hangya B, Taniguchi H, Huang JZ, Kepecs A. 2013. Distinct behavioural and network correlates of two interneuron types in prefrontal cortex. Nature. 498:363–366. [DOI] [PMC free article] [PubMed] [Google Scholar]
- Lapish CC, Durstewitz D, Chandler LJ, Seamans JK. 2008. Successful choice behavior is associated with distinct and coherent network states in anterior cingulate cortex. Proc Natl Acad Sci USA. 105:11963–11968. [DOI] [PMC free article] [PubMed] [Google Scholar]
- Laubach M, Shuler M, Nicolelis MAL. 1999. Independent component analyses for quantifying neuronal ensemble interactions. J Neurosci Methods. 94:141–154. [DOI] [PubMed] [Google Scholar]
- Le Bé J-V, Silberberg G, Wang Y, Markram H. 2007. Morphological, electrophysiological, and synaptic properties of corticocallosal pyramidal cells in the neonatal rat neocortex. Cereb Cortex. 17:2204–2213. [DOI] [PubMed] [Google Scholar]
- Ma L, Hyman JM, Phillips AG, Seamans JK. 2014. Tracking progress toward a goal in corticostriatal ensembles. J Neurosci. 34:2244–2253. [DOI] [PMC free article] [PubMed] [Google Scholar]
- Machens CK. 2010. Demixing population activity in higher cortical areas. Front Comput Neurosci. 4:126. [DOI] [PMC free article] [PubMed] [Google Scholar]
- McCormick DA, Connors BW, Lighthall JW, Prince DA. 1985. Comparative electrophysiology of pyramidal and sparsely spiny stellate neurons of the neocortex. J Neurophysiol. 54:782–806. [DOI] [PubMed] [Google Scholar]
- Miller EK, Cohen JD. 2001. An integrative theory of prefrontal cortex function. Annu Rev Neurosci. 24:167–202. [DOI] [PubMed] [Google Scholar]
- Narayanan NS, Laubach M. 2009. Delay activity in rodent frontal cortex during a simple reaction time task. J Neurophysiol. 101:2859–2871. [DOI] [PMC free article] [PubMed] [Google Scholar]
- Nishimura Y, Asahi M, Saitoh K, Kitagawa H, Kumazawa Y, Itoh K, Lin M, Akamine T, Shibuya H, Asahara T, et al. 2001. Ionic mechanisms underlying burst firing of layer III sensorimotor cortical neurons of the cat: an in vitro slice study. J Neurophysiol. 86:771–781. [DOI] [PubMed] [Google Scholar]
- Paxinos G, Watson C. 1998. The rat brain in stereotaxic coordinates. 4th ed San Diego: Academic Press. [Google Scholar]
- Pi H-J, Hangya B, Kvitsiani D, Sanders JI, Huang ZJ, Kepecs A. 2013. Cortical interneurons that specialize in disinhibitory control. Nature. 503:521–524. [DOI] [PMC free article] [PubMed] [Google Scholar]
- Pratt WE, Mizumori SJY. 2001. Neurons in rat medial prefrontal cortex show anticipatory rate changes to predictable differential rewards in a spatial memory task. Behav Brain Res. 123:165–183. [DOI] [PubMed] [Google Scholar]
- Ragozzino ME, Kim J, Hassert D, Minniti N, Kiang C. 2003. The contribution of the rat prelimbic-infralimbic areas to different forms of task switching. Behav Neurosci. 117:1054–1065. [DOI] [PubMed] [Google Scholar]
- Rich EL, Shapiro M. 2009. Rat prefrontal cortical neurons selectively code strategy switches. J Neurosci. 29:7208–7219. [DOI] [PMC free article] [PubMed] [Google Scholar]
- Rich EL, Shapiro ML. 2007. Prelimbic/infralimbic inactivation impairs memory for multiple task switches, but not flexible selection of familiar tasks. J Neurosci. 27:4747–4755. [DOI] [PMC free article] [PubMed] [Google Scholar]
- Rigotti M, Barak O, Warden MR, Wang X-J, Daw ND, Miller EK, Fusi S. 2013. The importance of mixed selectivity in complex cognitive tasks. Nature. 497:585–590. [DOI] [PMC free article] [PubMed] [Google Scholar]
- Robbins AA, Fox SE, Holmes GL, Scott RC, Barry JM. 2013. Short duration waveforms recorded extracellularly from freely moving rats are representative of axonal activity. Front Neural Circuits. 7:181. [DOI] [PMC free article] [PubMed] [Google Scholar]
- Rubenstein JLR, Merzenich MM. 2003. Model of autism: increased ratio of excitation/inhibition in key neural systems. Genes Brain Behav. 2:255–267. [DOI] [PMC free article] [PubMed] [Google Scholar]
- Rushworth MFS, Walton ME, Kennerley SW, Bannerman DM. 2004. Action sets and decisions in the medial frontal cortex. Trends Cogn Sci. 8:410–417. [DOI] [PubMed] [Google Scholar]
- Sanchez-Vives MV, McCormick DA. 2000. Cellular and network mechanisms of rhythmic recurrent activity in neocortex. Nat Neurosci. 3:1027–1034. [DOI] [PubMed] [Google Scholar]
- Schubert D, Staiger JF, Cho N, Kötter R, Zilles K, Luhmann HJ. 2001. Layer-specific intracolumnar and transcolumnar functional connectivity of layer V pyramidal cells in rat barrel cortex. J Neurosci. 21:3580–3592. [DOI] [PMC free article] [PubMed] [Google Scholar]
- Shinomoto S, Kim H, Shimokawa T, Matsuno N, Funahashi S, Shima K, Fujita I, Tamura H, Doi T, Kawano K, et al. 2009. Relating neuronal firing patterns to functional differentiation of cerebral cortex. PLoS Comput Biol. 5:e1000433. [DOI] [PMC free article] [PubMed] [Google Scholar]
- Shu Y, Hasenstaub A, McCormick DA. 2003. Turning on and off recurrent balanced cortical activity. Nature. 423:288–293. [DOI] [PubMed] [Google Scholar]
- Sohal VS, Zhang F, Yizhar O, Deisseroth K. 2009. Parvalbumin neurons and gamma rhythms enhance cortical circuit performance. Nature. 459:698–702. [DOI] [PMC free article] [PubMed] [Google Scholar]
- Sul JH, Kim H, Huh N, Lee D, Jung MW. 2010. Distinct roles of rodent orbitofrontal and medial prefrontal cortex in decision making. Neuron. 66:449–460. [DOI] [PMC free article] [PubMed] [Google Scholar]
- Sun YJ, Kim Y-J, Ibrahim LA, Tao HW, Zhang LI. 2013. Synaptic mechanisms underlying functional dichotomy between intrinsic-bursting and regular-spiking neurons in auditory cortical layer 5. J Neurosci. 33:5326–5339. [DOI] [PMC free article] [PubMed] [Google Scholar]
- Swadlow HA. 2003. Fast-spike interneurons and feedforward inhibition in awake sensory neocortex. Cereb Cortex. 13:25–32. [DOI] [PubMed] [Google Scholar]
- Tse D, Langston RF, Kakeyama M, Bethus I, Spooner PA, Wood ER, Witter MP, Morris RGM. 2007. Schemas and memory consolidation. Science. 316:76–82. [DOI] [PubMed] [Google Scholar]
- White TD, Tan AM, Finch DM. 1990. Functional reciprocal connections of the rat entorhinal cortex and subicular complex with the medial frontal cortex: an in vivo intracellular study. Brain Res. 533:95–106. [DOI] [PubMed] [Google Scholar]
- Wilson MA, McNaughton BL. 1993. Dynamics of the hippocampal ensemble code for space. Science. 261:1055–1058. [DOI] [PubMed] [Google Scholar]
- Wilson NR, Runyan CA, Wang FL, Sur M. 2012. Division and subtraction by distinct cortical inhibitory networks in vivo. Nature. 488:343–348. [DOI] [PMC free article] [PubMed] [Google Scholar]
- Yang CR, Seamans JK, Gorelova N. 1996. Electrophysiological and morphological properties of layers V-VI principal pyramidal cells in rat prefrontal cortex in vitro. J Neurosci. 16:1904–1921. [DOI] [PMC free article] [PubMed] [Google Scholar]
- Yizhar O, Fenno LE, Prigge M, Schneider F, Davidson TJ, O'Shea DJ, Sohal VS, Goshen I, Finkelstein J, Paz JT, et al. 2011. Neocortical excitation/inhibition balance in information processing and social dysfunction. Nature. 477:171–178. [DOI] [PMC free article] [PubMed] [Google Scholar]
- Zhu JJ, Connors BW. 1999. Intrinsic firing patterns and whisker-evoked synaptic responses of neurons in the rat barrel cortex. J Neurophysiol. 81:1171–1183. [DOI] [PubMed] [Google Scholar]
Associated Data
This section collects any data citations, data availability statements, or supplementary materials included in this article.