

Abstract
Increased airway responsiveness is linked to lung function decline and mortality in subjects with chronic obstructive pulmonary disease (COPD); however, the genetic contribution to airway responsiveness remains largely unknown. A genome-wide association study (GWAS) was performed using the Illumina (San Diego, CA) Human660W-Quad BeadChip on European Americans with COPD from the Lung Health Study. Linear regression models with correlated meta-analyses, including data from baseline (n = 2,814) and Year 5 (n = 2,657), were used to test for common genetic variants associated with airway responsiveness. Genotypic imputation was performed using reference 1000 Genomes Project data. Expression quantitative trait loci (eQTL) analyses in lung tissues were assessed for the top 10 markers identified, and immunohistochemistry assays assessed protein staining for SGCD and MYH15. Four genes were identified within the top 10 associations with airway responsiveness. Markers on chromosome 9p21.2 flanked by LINGO2 met a predetermined threshold of genome-wide significance (P < 9.57 × 10⁻⁸). Markers on chromosomes 3q13.1 (flanked by MYH15), 5q33 (SGCD), and 6q21 (PDSS2) yielded suggestive evidence of association (9.57 × 10⁻⁸ < P ≤ 4.6 × 10⁻⁶). Gene expression studies in lung tissue showed single nucleotide polymorphisms on chromosomes 5 and 3 to act as eQTL for SGCD (P = 2.57 × 10⁻⁹) and MYH15 (P = 1.62 × 10⁻⁶), respectively. Immunohistochemistry confirmed localization of SGCD protein to airway smooth muscle and vessels and MYH15 to airway epithelium, vascular endothelium, and inflammatory cells. We identified novel loci associated with airway responsiveness in a GWAS among smokers with COPD. Risk alleles on chromosomes 5 and 3 acted as eQTLs for SGCD and MYH15 messenger RNA, and these proteins were expressed in lung cells relevant to the development of airway responsiveness.
Keywords: COPD, airway reactivity, bronchial responsiveness, eQTL, δ-sarcoglycan
Clinical Relevance
The aim of this study was to identify the common genetic variants that are associated with airway responsiveness in chronic obstructive pulmonary disease (COPD). This study identified four novel loci associated with airway responsiveness in COPD, and, in particular, risk alleles on chromosomes 5 and 3 were associated with increased messenger RNA expression of SGCD and MYH15. SGCD protein was localized to airway smooth muscle. In a genome-wide association study of airway responsiveness among smokers with COPD, novel loci involved in the pathogenesis of airway responsiveness in COPD were identified.
Chronic obstructive pulmonary disease (COPD) is a leading cause of death in the United States and worldwide, and its prevalence is expected to increase in the upcoming decades (1, 2). Increased airway responsiveness, as measured by response to methacholine, is a phenotype often associated with asthma (3); however, it is well established that increased airway responsiveness is also a common feature of COPD. In addition, increased airway responsiveness has clinical implications in individuals with COPD. For example, smoking increases airway responsiveness, which in turn is a strong determinant of the initial benefit of smoking cessation, where quitters showing the greatest degrees of airway responsiveness exhibit the largest improvement in lung function (4–8). Previous results from the Lung Health Study (LHS), a multicenter, randomized clinical trial to determine whether a program of smoking intervention and use of an inhaled bronchodilator could slow the rate of pulmonary function decline (a hallmark feature of COPD) among patients with mild to moderate COPD, demonstrated that baseline airway responsiveness is a strong predictor of future lung function decline (9). In addition, increased airway responsiveness has been identified as a strong predictor of early development of COPD in young adults (10), and the severity of airway responsiveness has been associated with a higher risk of mortality from COPD (11). Not only does airway responsiveness have significant clinical implications in patients with COPD, but it is a heritable trait (12, 13), with estimates suggesting that genetic effects account for approximately one-third of the variance in airway responsiveness (13). Therefore, understanding the genetic contribution to airway responsiveness in COPD is important given its heritability and its relevance as a marker of morbidity and mortality in patients with COPD.
The LHS has been a landmark study in understanding the longitudinal effects of smoking on short- and long-term outcomes in COPD, and the assessments of airway responsiveness at baseline and 5 years later make the LHS uniquely suited to identify genetic contributions to airway responsiveness. Here we report results from a genome-wide association study (GWAS) in individuals with COPD. Confidence in the potential relevance of the top hits from this GWAS to airway responsiveness in patients with COPD was also extended by measuring gene and protein expression in human lung tissues.
Materials and Methods
A full description of the methods is provided in the online supplement.
Population
The multicenter LHS cohort (14, 15) consisted of 5,887 smokers (35–60 yr of age) at enrollment with spirometric evidence of mild to moderate lung function impairment. Methacholine challenge testing was performed twice: during the third screening visit (baseline) and at annual visit 5 (5, 9). Of the samples included in the GWAS and passing all quality control procedures (n = 4,108) (7), 3,354 and 2,657 individuals had valid methacholine measurements at baseline and Year 5, respectively, and were included in the current analysis.
Genotyping and Tests for Association
Genomic DNA samples were genotyped using the Illumina (San Diego, CA) Human660W-Quad v.1_A BeadChip.Sample, and single nucleotide polymorphism (SNP) quality control was performed using IlluminaBeadStudio (16). A total of 23,481 SNPs were excluded from analyses.
Airway responsiveness was calculated as a quantitative measure (the concentration of methacholine at which a greater than 20% decrease in FEV1 was achieved [PC20]), and all analyses were repeated using alternative definitions of airway responsiveness: (1) dichotomization of airway responsiveness (PC20 < 10 versus PC20 ≥ 10 mg/ml), (2) a categorical definition based on five categories of PC20 (<1, ≥1 but <5, ≥5 but <10, ≥10 but <25, and ≥25 mg/ml), and (3) a continuous measure of airway responsiveness using the O’Connor slope (17).
To address the potential effects of population stratification, the first five principal components computed via Eigenstrat were included in the regression models (18). The genetic contribution to airway responsiveness was assessed at baseline and Year 5 by linear regression using PLINK (19) adjusting for sex, age at baseline, clinic site, log10 (weight in kilograms), FEV1 (liters), FEV1/FVC, and smoking status at Year 5; data were combined using a correlated meta-analysis. Analysis of dichotomized PC20 was assessed using logistic regression. A prespecified threshold for genome-wide significance of P < 9.57 × 10⁻⁸ was determined based on a Bonferroni correction for multiple comparisons for 546,355 SNPs.
To further refine our association results, we performed genotype imputation using reference 1000 Genomes Project data (March 2010 release). We imputed genotypes for all polymorphic 1000 Genomes Project SNPs using a hidden Markov model implemented in MACH (version 1.0) with 200 iterations (http://www.sph.umich.edu/csg/abecasis/MACH/).
Replication
The investigation of the association of the top 10 genotyped SNPs associated with airway responsiveness in LHS was attempted in an independent European ancestry COPD cohort (Groningen Leiden Universities Corticosteroids in Obstructive Lung Disease [GLUCOLD]) with available airway responsiveness data (n = 110).
Expression Quantitative Trait Locus Analysis
We investigated whether any of the 10 SNPs identified in the LHS GWAS were a cis-acting expression quantitative trait locus (eQTL) using the results of a genome-wide association analysis for eQTLs performed in lung tissue from patients (n = 1,111) who underwent lung resection surgery. Details of the gene expression study have been published (20). Briefly, the normalized expression data were adjusted for age, sex, and smoking status in a robust linear model, and eQTL mapping was performed with linear regression (21). Cis-eQTL SNPs were defined as variants within 1 Mb of a gene that were associated with its expression at a 10% false discovery rate (corresponding to a P value of 5.9 × 10⁻⁵) (20). There were 17,049 cis-eQTLs.
Immunohistochemistry
Given the significant association of SGCD and MYH15 SNPs with their gene expression in eQTL analysis, we performed immunohistochemistry to determine SGCD and MYH15 protein expression in lung tissue specimens. Immunohistochemical staining was performed on frozen lung sections from biobanked control subjects for SGCD (n = 8) and MYH15 (n = 4). Frozen sections (10 μm thick) were incubated with a mouse monoclonal anti–δ-sarcoglycan antibody (Novocastra; Leica Microsystems Inc., Concord, ON, Canada) and a rabbit anti-MYH15 antibody (Sigma-Aldrich, St. Louis, MO).
Results
The clinical characteristics of subjects with valid methacholine measurements at baseline (n = 3,920) and Year 5 (n = 3,473) are presented in Table 1. LHS subjects included in the GWAS had a similar degree of airway responsiveness compared with those not included in the GWAS (data not shown), suggesting little selection bias. A total of 1,105 and 811 subjects at baseline and Year 5, respectively, did not have a 20% drop in FEV1 at the highest methacholine concentration (25 mg/ml) yielding precise PC20 values; therefore, 2,814 and 2,657 subjects had valid PC20 data at baseline and Year 5, respectively, and were included in the primary GWAS analysis of continuous PC20. A Manhattan plot of the results of the association tests between individual SNPs across the entire genome and airway responsiveness is presented in Figure 1. A Q-Q plot showed no evidence of significant population stratification (λ = 0.981) and is presented in Figure E2 in the online supplement, and the 10 SNPs most strongly associated with continuous PC20, representing four distinct genes, are listed in Table 2. Results for all SNPs with an association with airway responsiveness with a P value less than 10−4 are shown in Table E1. Three SNPs (rs10491678, rs683471, and rs10813121) on chromosome 9p21.2 met prespecified threshold for genome-wide significance. These intergenic SNPs are flanked by LINGO2 (828–849 kb downstream) and an uncharacterized gene (LOCS286239; 256–278 kb upstream). The additional seven SNPs represent three genomic regions, including PDSS2 on chromosome 6q21, SGCD on chromosome 5q33, and an intergenic location on chromosome 3q13.1, flanked by DZIP3 (28 kb upstream), MYH15 (193 kb upstream), and RETNLB (33 kb upstream). No significant evidence of association for the top 10 SNPs was observed in the GLUCOLD cohort (data not shown); however, to confirm the robustness of our findings across different definitions of airway responsiveness, in secondary analyses we tested for association of the top 10 SNPs, with airway responsiveness defined as a dichotomized trait, a categorical trait, and a continuous trait using the O’Connor slope (Table 3). Results for all SNPs with an association with airway responsiveness (defined as a dichotomized, a categorical, and a continuous trait using the O’Connor slope) with a P value less than 10−4 are shown in Tables E2–E4, and Q-Q plots are shown in Figure E2.
Table 1.
Baseline and Year 5 Lung Health Study Subject Characteristics
| Subjects with AR Data |
||
|---|---|---|
| Subject Characteristics | Baseline (n = 3,920) | Year 5 (n = 3,473) |
| Baseline characteristics | ||
| Age, yr | 48.6 (6.7)* | 48.3 (6.7) |
| Male, N (%) | 2,464 (62.9) | 2,225 (64.1) |
| BMI, kg/m2 | 25.5 (3.9) | 25.5 (3.8) |
| Smoking, pack-years | 40.5 (18.6) | 40.2 (18.7) |
| Post-bronchodilator lung function | ||
| FEV1, L | 2.8 (0.6) | 2.8 (0.6) |
| FVC, L | 4.3 (1.0) | 4.3 (0.9) |
| FEV1/FVC | 0.65 (0.06) | 0.66 (0.06) |
| FEV1% predicted | 78.6 (9.0) | 79.7 (8.3) |
| Airway responsiveness | ||
| PC20 | 7.6 (6.1)† | 6.6 (5.9)† |
| PC20 ≤1 mg/ml, N (%) | 198 (5.1) | 296 (8.5) |
| PC20 >1 and ≤5 mg/ml, N (%) | 1,108 (28.3) | 1,162 (33.5) |
| PC20 >5 and ≤10 mg/ml, N (%) | 912 (23.3) | 740 (21.3) |
| PC20 >10 and ≤25 mg/ml, N (%) | 597 (15.2) | 464 (13.4) |
| PC20 >25 mg/ml, N (%) | 1,105 (28.2) | 811 (3.4) |
Definition of abbreviations: AR, airway responsiveness; BMI, body mass index; PC20, concentration of methacholine at which a greater than 20% decrease in FEV1 was achieved.
Values are means with SD in parentheses unless otherwise noted.
A total of 2,814 and 2,657 subjects had valid PC20 data at baseline and Year 5, respectively, and were included in the primary genome-wide association study analysis. The additional 1,105 and 811 subjects, respectively, did not have a 20% drop in FEV1 at the highest methacholine concentration (25 mg/ml) and therefore did not have precise PC20 values.
Figure 1.

Manhattan plot of association results for airway responsiveness in the Lung Health Study. Manhattan plots are ordered by chromosome position. The x axis shows chromosome position, and the y axis shows the –log10 (P value).
Table 2.
Top 10 Genome-Wide Association Study Single Nucleotide Polymorphisms Representing Four Chromosomal Regions Associated with Airway Responsiveness in the Lung Health Study
| Baseline |
Year 5 |
Meta-Analysis |
|||||||||
|---|---|---|---|---|---|---|---|---|---|---|---|
| SNP | Chromosome | Position in BP | Minor Allele | Minor Allele Frequency | Gene or Closest Gene (Distance) | β* | P Value | β | P Value | β | P Value |
| rs10491678 | 9 | 29568686 | C | 0.36 | LINGO2 (898.4 kb) | 0.052 | 2.61 × 10⁻⁷ | 0.050 | 2.31 × 10⁻⁶ | 0.051 | 4.52 × 10⁻⁹ |
| rs683471 | 9 | 29546888 | C | 0.36 | LINGO2 (876.6 kb) | 0.049 | 8.60 × 10⁻⁷ | 0.048 | 7.45 × 10⁻⁶ | 0.049 | 2.34 × 10⁻⁸ |
| rs10813121 | 9 | 29556577 | A | 0.35 | LINGO2 (886.3 kb) | 0.050 | 7.64 × 10⁻⁷ | 0.044 | 4.18 × 10⁻⁵ | 0.047 | 7.01 × 10⁻⁸ |
| rs640850 | 9 | 29536618 | G | 0.25 | LINGO2 (866.3 kb) | 0.053 | 2.04 × 10⁻⁶ | 0.046 | 1.13 × 10⁻⁴ | 0.050 | 2.77 × 10⁻⁷ |
| rs9486594 | 6 | 107672527 | C | 0.09 | PDSS2 | 0.065 | 1.53 × 10⁻⁴ | 0.081 | 1.13 × 10⁻⁵ | 0.072 | 1.50 × 10⁻⁶ |
| rs7356941 | 6 | 107794473 | A | 0.09 | PDSS2 (13.7 kb) | 0.063 | 2.63 × 10⁻⁴ | 0.082 | 6.17 × 10⁻⁶ | 0.072 | 1.58 × 10⁻⁶ |
| rs7618314 | 3 | 108441444 | C | 0.08 | RETNLB (20.8 kb) | −0.075 | 1.44 × 10⁻⁵ | −0.065 | 5.24 × 10⁻⁴ | −0.071 | 3.01 × 10⁻⁶ |
| rs2642660 | 5 | 156152920 | C | 0.19 | SGCD | −0.050 | 4.83 × 10⁻⁵ | −0.050 | 1.47 × 10⁻⁴ | −0.050 | 3.13 × 10⁻⁶ |
| rs2430461 | 6 | 107650309 | C | 0.19 | PDSS2 | 0.047 | 8.36 × 10⁻⁵ | 0.051 | 8.26 × 10⁻⁵ | 0.049 | 3.27 × 10⁻⁶ |
| rs456290 | 5 | 156155155 | C | 0.19 | SGCD | −0.051 | 3.32 × 10⁻⁵ | −0.047 | 3.87 × 10⁻⁴ | −0.049 | 4.61 × 10⁻⁶ |
Definition of abbreviations: BP, base pair; SNP, single nucleotide polymorphism.
β represents increase in PC20 value (i.e., the concentration of methacholine at which a greater than 20% decrease in FEV1 was achieved).
Table 3.
Robustness of Top 10 Genome-Wide Association Study Single Nucleotide Polymorphisms across Different Definitions of Airway Responsiveness in the Lung Health Study
| SNP | Chromosome | Gene or Closest Gene (Distance) | β | PC20 Continuous* | β | O'Connor† | OR | PC20 Dichotomous‡ | β | PC20 Categorical§ | |
|---|---|---|---|---|---|---|---|---|---|---|---|
| rs10491678 | 9 | LINGO2 (898.4 kb) | 0.051 | 4.52 × 10⁻⁹ | 0.036 | 1.10 × 10⁻⁶ | 1.209 | 1.24 × 10⁻⁴ | 0.101 | 4.48 × 10⁻⁵ | |
| rs683471 | 9 | LINGO2 (876.6 kb) | 0.049 | 2.34 × 10⁻⁸ | 0.034 | 4.36 × 10⁻⁶ | 1.196 | 2.84 × 10⁻⁴ | 0.096 | 1.13 × 10⁻⁴ | |
| rs10813121 | 9 | LINGO2 (886.3 kb) | 0.047 | 7.01 × 10⁻⁸ | 0.031 | 1.84 × 10⁻⁵ | 1.184 | 6.12 × 10⁻⁴ | 0.089 | 3.61 × 10⁻⁴ | |
| rs640850 | 9 | LINGO2 (866.3 kb) | 0.050 | 2.77 × 10⁻⁷ | 0.040 | 5.80 × 10⁻⁷ | 1.191 | 8.02 × 10⁻⁴ | 0.104 | 1.47 × 10⁻⁴ | |
| rs9486594 | 6 | PDSS2 | 0.072 | 1.50 × 10⁻⁶ | 0.060 | 1.18 × 10⁻⁶ | 1.256 | 5.96 × 10⁻³ | 0.167 | 6.76 × 10⁻⁵ | |
| rs7356941 | 6 | PDSS2 (13.7 kb) | 0.072 | 1.58 × 10⁻⁶ | 0.059 | 1.39 × 10⁻⁶ | 1.245 | 8.49 × 10⁻³ | 0.165 | 7.62 × 10⁻⁵ | |
| rs7618314 | 3 | RETNLB (20.8 kb) | −0.071 | 3.01 × 10⁻⁶ | −0.060 | 2.14 × 10⁻⁶ | 0.836 | 1.84 × 10⁻² | −0.153 | 4.27 × 10⁻⁴ | |
| rs2642660 | 5 | SGCD | −0.050 | 3.13 × 10⁻⁶ | −0.030 | 9.14 × 10⁻⁴ | 0.811 | 4.02 × 10⁻⁴ | −0.102 | 8.23 × 10⁻⁴ | |
| rs2430461 | 6 | PDSS2 | 0.049 | 3.27 × 10⁻⁶ | 0.040 | 5.22 × 10⁻⁶ | 1.244 | 4.41 × 10⁻⁴ | 0.113 | 1.49 × 10⁻⁴ | |
| rs456290 | 5 | SGCD | −0.049 | 4.61 × 10⁻⁶ | −0.028 | 1.90 × 10⁻³ | 0.818 | 7.56 × 10⁻⁴ | −0.099 | 1.26 × 10⁻³ |
Definition of abbreviations: OR, odds ratio; PC20, concentration of methacholine at which a greater than 20% decrease in FEV1 was achieved; SNP, single nucleotide polymorphism.
A total of 2,814 subjects at baseline and 2,657 at Year 5 included in analyses.
A total of 3,530 subjects at baseline and 3,284 at Year 5 included in analyses.
A total of 3,946 subjects at baseline and 3,477 at Year 5 included in analyses (PC20 < 10 versus PC20 ≥ 10 mg/ml).
n = 3,920 at baseline and 3,473 at Year 5 included in analyses (categorical outcome: PC20 <1, ≥1 but <5, ≥5 but <10, ≥10 but <25, and ≥25 mg/ml).
To refine these candidate regions associated with airway responsiveness, SNPs were imputed in these four genomic regions and were displayed using local association plots (Figure 2) (22). For the chromosome 3 locus, rs34215229 was the most highly associated SNP (P = 5.41 × 10⁻⁸; R2 = 0.984). This SNP is 227 kb from the genotyped SNP lying in an intronic region of MYH15. For chromosome 5, the most highly associated imputed SNP rs282475 (P = 8.35 × 10⁻⁸; R2 = 0.907) is 6.5 kb upstream from the most highly associated genotyped SNP rs2642660. For chromosome 6, the top two imputed SNP are rs80128495 (P = 8.41 × 10⁻⁸; R2 = 1) and rs78394231 (P = 1.29 × 10⁻⁷; R2 = 0.797), both of which lie in the intronic region of PDSS2 and are within 23.4 kb of the genotyped SNP. For chromosome 9, the most significant imputed SNPs (rs591935; R2 = 0.993) had similar degrees of association compared with genotyped SNPs in the respective regions.
Figure 2.
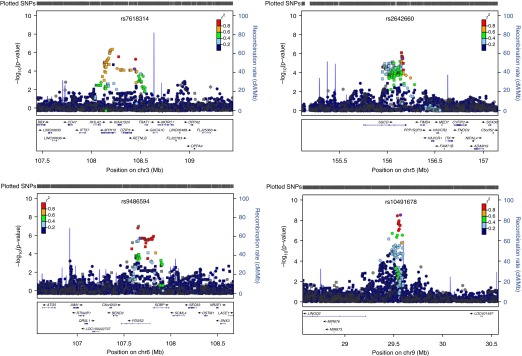
Association results for imputed single nucleotide polymorphisms (SNPs) for four chromosomal regions associated with airway responsiveness in the Lung Health Study. Circles, squares, diamonds, upward triangles, and downward triangles represent intergenic, intronic, near-gene (3′ and 5′), coding-synonymous, and missense, respectively. The relative location of the genes in each region and the direction of transcription are shown in the bottom track of the figure, and the chromosomal position is shown on the x axis. The light blue line shows the recombination rate across the region (right y axis), and the left y axis shows the significance of the associations. The purple symbol shows the P value for the top genome-wide association study signal in each region. The remaining symbols show the P values for all other SNPs and are color coded according to the level of linkage disequilibrium with the top SNP in the 1000 Genomes March 2012 CEU (Utah Residents with Northern and Western European Ancestry) population (red, r2 > 0.8; orange, r2 = 0.6–0.8; green, r2 = 0.4–0.6; light blue, r2 = 0.2–0.4; dark blue, r2 = 0.0–0.2).
eQTL Analysis
We sought evidence that the top 10 SNPs might alter gene expression levels by examining their association with gene expression in the lung (Table 4). Chromosome 5 markers rs456290 and rs2642660 showed cis-eQTL association with SGCD expression at P < 7.5 × 10⁻⁹ (Figures 3A and 3B). In addition, the top chromosome 3 SNP (rs7618314) showed cis-eQTL association with MYH15 gene expression (P = 1.62 × 10⁻⁶) and AK026893 (P = 5.75 × 10⁻⁷) gene expression (Figures E3 and E4). Imputed SNP (rs34215229) is also a lung eQTL for MYH15 (P = 1.80 × 10⁻⁷), with higher expression for the C allele. The SNPs associated with airway responsiveness on chromosomes 6 and 9 did not act as eQTLs for transcripts in cis.
Table 4.
Significant Lung Expression Quantitative Trait Loci Results for Single Nucleotide Polymorphisms Associated with Airway Responsiveness
| Marker | Chromosome | Alleles (Major/Minor) | Probe Set | Transcript | eQTL P Value | Higher-Expression Allele |
|---|---|---|---|---|---|---|
| rs7618314 | 3 | T/C | 100139344_TGI_at | AK026893 | 5.75 × 10⁻⁷ | T |
| 100152895_TGI_at | MYH15 | 1.62 × 10⁻⁶ | T | |||
| rs2642660 | 5 | T/C | 100130704_TGI_at | SGCD | 8.94 × 10⁻⁷ | C |
| 100142964_TGI_at | SGCD | 2.04 × 10⁻⁵ | C | |||
| 100144469_TGI_at | SGCD | 1.88 × 10⁻⁷ | C | |||
| 100154320_TGI_at | SGCD | 1.23 × 10⁻⁶ | C | |||
| 100156891_TGI_at | SGCD | 2.57 × 10⁻⁹ | C | |||
| 100307171_TGI_at | SGCD | 7.13 × 10⁻⁷ | C | |||
| 100313731_TGI_at | SGCD | 1.02 × 10⁻⁸ | C | |||
| rs456290 | 5 | T/C | 100130704_TGI_at | SGCD | 3.17 × 10⁻⁶ | C |
| 100142964_TGI_at | SGCD | 1.87 × 10⁻⁵ | C | |||
| 100144469_TGI_at | SGCD | 1.99 × 10⁻⁷ | C | |||
| 100154320_TGI_at | SGCD | 2.75 × 10⁻⁶ | C | |||
| 100156891_TGI_at | SGCD | 1.13 × 10⁻⁸ | C | |||
| 100307171_TGI_at | SGCD | 1.96 × 10⁻⁶ | C | |||
| 100313731_TGI_at | SGCD | 7.48 × 10⁻⁹ | C |
Definition of abbreviation: eQTL, expression quantitative trait loci.
Figure 3.

(A) Gene expression levels of the SGCD gene in the lungs according to genotyping groups for the SNP rs2642660 in Laval (n = 409) (left), in Groningen (n = 363) (middle), and in the University of British Columbia (UBC) (n = 349) (right). The y axis represents gene expression levels in the lung adjusted for age, sex, and smoking status. The x axis represents the three genotyping groups for SNP rs2642660 with the number of subjects in parentheses. (B) Gene expression levels of the SGCD gene in the lungs according to genotyping groups for the SNP rs456290 in Laval (n = 409) (left), in Groningen (n = 363) (middle), and in UBC (n = 350) (right). The y axis represents gene expression levels in the lung adjusted for age, sex, and smoking status. The x axis represents the three genotyping groups for SNP rs456290 with the number of subjects in parentheses.
Immunohistochemistry
To further investigate the localization of the proteins coded by the two genes (SGCD and MYH15) for which cis-eQTLs were identified, immunohistochemistry was performed. Human lung tissue specimens stained for SGCD in the airway and vascular smooth muscle (Figure 4). There was staining for SGCD in the airway smooth muscle of seven of eight control subjects, and semiquantitative analysis showed that approximately 10% of the muscle area stained positively, with a range from 0 to 20% (Figure E5). For MYH15 there was no staining in smooth muscle, but there was positive and consistent staining in the airway epithelium (Figure E6), in the systemic and pulmonary vascular endothelium (Figure E7), and in inflammatory cells (Figure E8). There was consistent staining for MYH15 in these cell types in the four control subjects who were studied. Although the presence of expression of these proteins in lung does not imply a functional link between the GWAS results and the expression of these proteins, these results confirm protein expression of SGCD and MYH15 in tissue known to be involved in mediating airway responsiveness.
Figure 4.
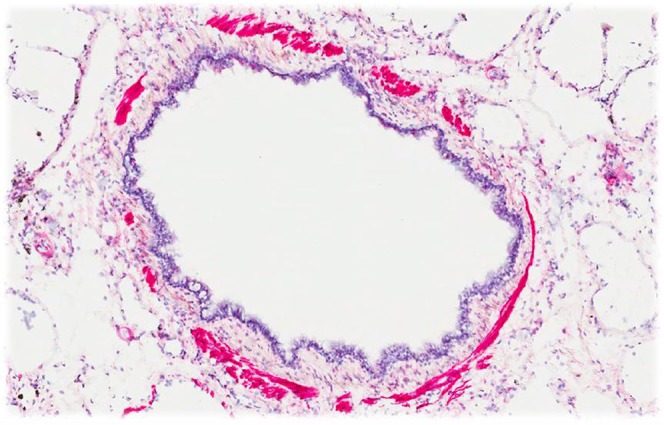
Immunohistochemistry showing intense staining for SGCD in airway smooth muscle bundles.
Discussion
In this first GWAS on airway responsiveness in COPD, we identified a locus on chromosome 9p21.2 achieving genome-wide significance (P = 4.5 × 10⁻⁹) in addition to three regions on chromosomes 3, 5, and 6 that approached genome-wide significance (9.57 × 10⁻⁸ < P ≤ 4.6 × 10⁻⁶). eQTL analysis showed that SNPs on chromosomes 3 and 5, which were associated with airway responsiveness in GWAS analysis, were also eQTLs for expression of nearby genes (MYH15 and SGCD) in lung tissue. SGCD protein expression was localized to airway smooth muscle, the contraction of which leads to airway bronchoconstriction. MYH15 protein was expressed by the airway epithelium, vascular endothelium, and inflammatory cells, all of which may contribute to variation in airway responsiveness. These results highlight the potential importance of four novel genes, including SGCD and MYH15, in the regulation of airway responsiveness among patients with COPD.
The development of airway responsiveness in COPD probably involves multiple mechanisms, including increased airway smooth muscle contractility, increased smooth muscle mass in the small airways, decreased elastic recoil, epithelial cell dysfunction, and increased airway wall thickness (23). The mechanism by which the novel targets identified in this GWAS may affect airway responsiveness remains unknown; however, the locus on chromosome 5, SGCD (sarcoglycan, δ), is a component of the dystrophin–glycoprotein complex (DGC). The DGC is a multisubunit protein complex spanning the sarcolemma and provides structural support between the subsarcolemmal cytoskeleton and the extracellular matrix of muscle cells. The DGC secures actin to laminin, helps support the sarcolemma, and may function in Ca2+ homeostasis and signaling in muscle cells. The DGC is found in striated and cardiac muscle and is associated with muscular dystrophies, cardiomyopathy, and vascular remodeling (24). Recent literature has shown that DGC and its components, including SGCD, are also found in contractile airway smooth muscle tissue, implying that it is likely involved in contractility (25).
The association of the most significant SNPs near SGCD with gene expression of SGCD in lung tissue suggests that these SNPs are either directly involved or are in tight linkage disequilibrium with variants controlling gene expression of SGCD in human airways and vessels. For example, the C allele of rs2642660 was associated with higher SGCD expression in lung tissue and is also associated with increased airway responsiveness. It is possible that the increased expression could contribute to the stability of the complex, making the muscle stiffer and more resistant to the force and length oscillations, which occur during breathing. There is increasing evidence that airway hyper-responsiveness is related to an inability of the airway smooth muscle to be stretched sufficiently during breathing maneuvers such as deep inspirations (26). A more stable and less malleable DGC could increase stiffness of the airway smooth muscle, making it more resistant to the stress applied during deep inspirations (27).
Immunohistochemistry confirmed the localization of SGCD to airway and vascular smooth muscle in human lung tissue, emphasizing its potential importance in the pathogenesis of airway responsiveness. SGCD staining was restricted to the airway and vascular smooth muscle. Ideally, we would have performed quantitative analysis for SGCD on airway tissue from smokers with COPD with known and widely varying airway responsiveness to determine if there was a relationship between SGCD staining and airway responsiveness. Unfortunately, measurements of airway responsiveness from subjects with COPD with tissue in the biobank were not available. However, taken together, these data support the possibility that increased expression of SGCD contributes to increased airway responsiveness.
eQTL analyses also showed that the SNP identified from GWAS analysis on chromosome 3 was associated with AK026893 and Myosin Heavy Chain 15 (MYH15) gene expression. Little is known regarding AK026893 gene function, and analyses of imputed SNPs showed that the most highly associated SNP (rs34215229; P = 5.41 × 10⁻⁸; r2 = 0.984) on chromosome 3 lies in an intronic region in MYH15 and is also an eQTL for MYH15 gene expression. These data suggest that MYH15 is the target gene at the chromosome 3 locus. MYH15 has previously been identified as a sarcomeric myosin gene, but little information is available about its expression and function (28). MYH15 has previously been found to be expressed in extraocular muscles but not in leg or heart muscle (29), but polymorphisms in MYH15 have been linked to coronary heart disease and to noncardioembolic stroke (30–32). We report the novel gene expression of MYH15 in human lung tissue. MYH15 protein was not expressed in airway smooth muscle but showed pronounced staining in systemic and pulmonary vascular endothelial cells and in airway epithelial cells and infiltrating inflammatory cells, especially alveolar macrophages. Any of these cell types could contribute to airway responsiveness. Altered expression of MYH15 by the epithelium and/or vascular endothelium could influence epithelial function, and variable expression of MYH15 by inflammatory cells could influence airway inflammation, both of which have been suggested to play a role in the generation of airway responsiveness (33).
Prenyl diphosphate synthase, subunit 2 (PDSS2) maps to chromosome 6q21 and encodes a protein that synthesizes the prenyl side-chain of coenzyme Q or ubiquinone. Coenzyme Q has antioxidative properties in humans, has a role in the production of cell energy, and is a scavenger of free oxygen radicals. The oxidant–antioxidant balance has been hypothesized to be critical in the pathogenesis of COPD. Protective effects of coenzyme Q on pulmonary function have been demonstrated in animal experiments, and coenzyme Q levels are decreased in patients with asthma and COPD (34). Our results highlight the potential novel association of PDSS2 and coenzyme Q in the development of airway responsiveness in COPD.
Two SNPs in chromosome 9p21.2, flanked by LINGO2 and an unknown gene, met a predetermined threshold of genome-wide significance (P < 9.57 × 10⁻⁸). In addition, using the RegulomeDB website, rs10813121 in chromosome 9 was found to bind to seven proteins, among them STAT3 and Nrf-2, a key transcription factor that regulates antioxidant defense in macrophages and epithelial cells (35). The leucine-rich repeat and Ig domain–containing 2 gene (LINGO2) is expressed in neuronal tissue, and variants have been associated with essential tremor and Parkinson’s disease as well as obesity (36–38). The function of LINGO2 is currently unclear, and further investigation is needed to understand its potential role in the pathogenesis of airway responsiveness.
The LHS is a unique COPD case cohort for which no ideally suited cohort is available for replication of genetic associations. In particular, very few COPD studies have assessed airway responsiveness, and, to our knowledge, there is no sufficiently sized COPD cohort available with airway responsiveness data to provide a reasonable replication cohort to confirm our results. The GLUCOLD study (39) enrolled patients with COPD and performed methacholine challenge testing on only 110 subjects, thereby limiting our ability to detect any statistically significant associations. We did not replicate our findings in asthma cohorts because the biologic mechanism and genetic determinants of airway responsiveness underlying asthma and COPD may be different, as is evidenced by a previous GWAS of airway responsiveness in asthma populations showing only nominal to no replication in the LHS COPD population and in a general population cohort (40).
We acknowledge that the current analyses do not provide direct functional relevance to the genes identified in our GWAS analysis; however, the lung eQTL and protein expression studies increase confidence that the identified genes are expressed in relevant tissues that are involved in the pathogenesis of airway responsiveness. We also acknowledge that SNPs may contribute to disease phenotype not only through affecting gene expression in lung tissue but also through other mechanisms, including gene expression in nonlung tissue or gene or protein function. In addition, the effect of the polymorphism may only be seen under specific disease or environmental conditions, and the cohort in which the eQTL analyses were done was not specific for COPD. Therefore, we still believe that the other novel loci identified in the GWAS continue to be potential causal loci underlying airway responsiveness in patients with COPD.
In summary, we present findings from the first GWAS of airway responsiveness in smokers with COPD. Four loci reached genome-wide or near genome-wide significance in tests of association with airway responsiveness (4.5 × 10⁻⁹ ≤ P ≤ 4.6 × 10⁻⁶). In particular, the risk alleles for airway responsiveness on chromosomes 5 and 3 were associated with the messenger RNA expression levels of SGCD and MYH15 in the lung. SGCD protein expression was identified in airway smooth muscle of lung tissue specimens, which is responsible for contractility and bronchoconstriction, and MYH15 protein expression was identified in airway epithelium, vascular endothelium, and inflammatory cells. These results highlight the potential importance of SGCD and MYH15 in the pathogenesis of airway responsiveness in patients with COPD.
Acknowledgments
Acknowledgments
This project was part of the Gene, Environment Association Studies (GENEVA) Consortium funded by the National Human Genome Research Institute (NHGRI) to enhance communication and collaboration among researchers conducting genome-wide studies of complex diseases. The authors benefited greatly from the work and efforts of the entire consortium, especially the Coordinating Center (directed by B. Weir and C. Laurie of the University of Washington) in data cleaning and preparation for submission to the Database for Genotypes and Phenotypes (dbGaP). The authors acknowledge the leadership of T. Manolio of NHGRI. The authors thank David Levine for additional technical support; Helen Voelker and Kathy Farnell of the LHS Data Coordinating Center, University of Minnesota for assistance with the LHS database; Corinne Boehm and Jane Romm of the Center for Inherited Disease Research, Johns Hopkins University, for technical support; and Eugene Bleecker and Deborah Meyers for intellectual contributions. The principal investigators and senior staff of the clinical and coordinating centers, the NHLBI, and members of the Safety and Data Monitoring Board of the Lung Health Study are as follows: Case Western Reserve University, Cleveland, OH: M. D. Altose, M.D. (Principal Investigator) and C. D. Deitz, Ph.D. (Project Coordinator). Henry Ford Hospital, Detroit, MI: M. S. Eichenhorn, M.D. (Principal Investigator); K. J. Braden, A.A.S. (Project Coordinator); and R. L. Jentons, M.A.L.L.P. (Project Coordinator). Johns Hopkins University School of Medicine, Baltimore, MD: R. A. Wise, M.D. (Principal Investigator); C. S. Rand, Ph.D. (Co-Principal Investigator); and K. A. Schiller (Project Coordinator). Mayo Clinic, Rochester, MN: P. D. Scanlon, M.D. (Principal Investigator); G. M. Caron (Project Coordinator); and K. S. Mieras, L. C. Walters. Oregon Health Sciences University, Portland: A. S. Buist, M.D. (Principal Investigator); L. R. Johnson, Ph.D. (LHS Pulmonary Function Coordinator); and V. J. Bortz (Project Coordinator). University of Alabama at Birmingham: W. C. Bailey, M.D. (Principal Investigator) and L.B. Gerald, Ph.D., M.S.P.H. (Project Coordinator). University of California, Los Angeles: D. P. Tashkin, M.D. (Principal Investigator) and I.P. Zuniga (Project Coordinator). University of Manitoba, Winnipeg: N. R. Anthonisen, M.D. (Principal Investigator, Steering Committee Chair); J. Manfreda, M.D. (Co-Principal Investigator); R. P. Murray, Ph.D. (Co-Principal Investigator); and S. C. Rempel-Rossum (Project Coordinator). University of Minnesota Coordinating Center, Minneapolis: J. E. Connett, Ph.D. (Principal Investigator); P. L. Enright, M.D.; P. G. Lindgren, M.S.; P. O'Hara, Ph.D. (LHS Intervention Coordinator), M. A. Skeans, M.S.; and H. T. Voelker. University of Pittsburgh, Pittsburgh, PA: R. M. Rogers, M.D. (Principal Investigator) and M. E. Pusateri (Project Coordinator). University of Utah, Salt Lake City: R. E. Kanner, M.D. (Principal Investigator) and G. M. Villegas (Project Coordinator). Safety and Data Monitoring Board: M. Becklake, M.D.; B. Burrows, M.D. (deceased); P. Cleary, Ph.D.; P. Kimbel, M.D. (Chairperson; deceased); L. Nett, R.N., R.R.T. (former member); J.K. Ockene, Ph.D.; R.M. Senior, M.D. (Chairperson); G. L. Snider, M.D.; W. Spitzer, M.D. (former member); and O. D. Williams, Ph.D. Morbidity and Mortality Review Board: T. E. Cuddy, M.D.; R. S. Fontana, M.D.; R. E. Hyatt, M.D.; C. T. Lambrew, M.D.; B. A. Mason, M.D.; D. M. Mintzer, M.D.; and R. B. Wray, M.D. National Heart, Lung, and Blood Institute staff, Bethesda, MD: S. S. Hurd, Ph.D. (Former Director, Division of Lung Diseases); J. P. Kiley, Ph.D. (Former Project Officer and Director, Division of Lung Diseases); G. Weinmann, M.D. (Former Project Officer and Director, Airway Biology and Disease Program, DLD); and M. C. Wu, Ph.D. (Division of Epidemiology and Clinical Applications).
Footnotes
This research was supported by Gene, Environment Association Studies grant U01HG004738, by the Mary Beryl Patch Turnbull Scholar Program (K.C.B.), and by a VA Research Career Scientist award (D.S.). The Lung Health Study I was supported by National Institutes of Health contract NIH/N01-HR-46002. Lung tissue validation studies were supported by the National Heart, Lung and Blood Institute grant HL095406–01. The VA Normative Aging Study is supported by the Cooperative Studies Program/Epidemiology Research and Information Center of the U.S. Department of Veterans Affairs and is a component of the Massachusetts Veterans Epidemiology Research and Information Center, Boston, Massachusetts.
Author Contributions: N.N.H., P.D.P., D.D.S., A.S., D.D., T.H.B., I.R., R.A.M., and K.C.B. contributed to conception and design of the work and to analysis and interpretation of the data. W.M.E., B.A.A., D.S.P., H.M.B., M.H.C., and A.A.L. contributed to acquisition and data analysis. N.R., L.H., C.V., C.D.P., Y.B., M.v.d.B., P.S.H., C.O., R.A.W., J.C., E.R.N., T.H.B., and D.S. contributed to drafting the work or revising it critically for important intellectual content and provided final approval of the version submitted for publication.
This article has an online supplement, which is accessible from this issue’s table of contents at www.atsjournals.org
Originally Published in Press as DOI: 10.1165/rcmb.2014-0198OC on December 16, 2014
Author disclosures are available with the text of this article at www.atsjournals.org.
References
- 1.Mannino DM, Homa DM, Akinbami LJ, Ford ES, Redd SC. Chronic obstructive pulmonary disease surveillance–United States, 1971–2000. Respir Care. 2002;47:1184–1199. [PubMed] [Google Scholar]
- 2.Murray CJ, Lopez AD. Alternative projections of mortality and disability by cause 1990–2020: Global Burden of Disease Study. Lancet. 1997;349:1498–1504. doi: 10.1016/S0140-6736(96)07492-2. [DOI] [PubMed] [Google Scholar]
- 3.Antó JM, Sunyer J, Basagaña X, Garcia-Esteban R, Cerveri I, de Marco R, Heinrich J, Janson C, Jarvis D, Kogevinas M, et al. Risk factors of new-onset asthma in adults: a population-based international cohort study. Allergy. 2010;65:1021–1030. doi: 10.1111/j.1398-9995.2009.02301.x. [DOI] [PubMed] [Google Scholar]
- 4.Postma DS, de Vries K, Koëter GH, Sluiter HJ. Independent influence of reversibility of air-flow obstruction and nonspecific hyperreactivity on the long-term course of lung function in chronic air-flow obstruction. Am Rev Respir Dis. 1986;134:276–280. doi: 10.1164/arrd.1986.134.2.276. [DOI] [PubMed] [Google Scholar]
- 5.Tashkin DP, Altose MD, Bleecker ER, Connett JE, Kanner RE, Lee WW, Wise R The Lung Health Study Research Group. The Lung Health Study: airway responsiveness to inhaled methacholine in smokers with mild to moderate airflow limitation. Am Rev Respir Dis. 1992;145:301–310. doi: 10.1164/ajrccm/145.2_Pt_1.301. [DOI] [PubMed] [Google Scholar]
- 6.Wise RA, Kanner RE, Lindgren P, Connett JE, Altose MD, Enright PL, Tashkin DP. The effect of smoking intervention and an inhaled bronchodilator on airways reactivity in COPD: the Lung Health Study. Chest. 2003;124:449–458. doi: 10.1378/chest.124.2.449. [DOI] [PubMed] [Google Scholar]
- 7.Willemse BW, ten Hacken NH, Rutgers B, Lesman-Leegte IG, Postma DS, Timens W. Effect of 1-year smoking cessation on airway inflammation in COPD and asymptomatic smokers. Eur Respir J. 2005;26:835–845. doi: 10.1183/09031936.05.00108904. [DOI] [PubMed] [Google Scholar]
- 8.Scanlon PD, Connett JE, Waller LA, Altose MD, Bailey WC, Buist AS. Smoking cessation and lung function in mild-to-moderate chronic obstructive pulmonary disease: the Lung Health Study. Am J Respir Crit Care Med. 2000;161:381–390. doi: 10.1164/ajrccm.161.2.9901044. [DOI] [PubMed] [Google Scholar]
- 9.Tashkin DP, Altose MD, Connett JE, Kanner RE, Lee WW, Wise RA The Lung Health Study Research Group. Methacholine reactivity predicts changes in lung function over time in smokers with early chronic obstructive pulmonary disease. Am J Respir Crit Care Med. 1996;153:1802–1811. doi: 10.1164/ajrccm.153.6.8665038. [DOI] [PubMed] [Google Scholar]
- 10.de Marco R, Accordini S, Marcon A, Cerveri I, Anto JM, Gislason T, Heinrich J, Janson C, Jarvis D, Kuenzli N, et al. Risk factors for chronic obstructive pulmonary disease in a European cohort of young adults. Am J Respir Crit Care Med. 2011;183:891–897. doi: 10.1164/rccm.201007-1125OC. [DOI] [PubMed] [Google Scholar]
- 11.Hospers JJ, Postma DS, Rijcken B, Weiss ST, Schouten JP. Histamine airway hyper-responsiveness and mortality from chronic obstructive pulmonary disease: a cohort study. Lancet. 2000;356:1313–1317. doi: 10.1016/S0140-6736(00)02815-4. [DOI] [PubMed] [Google Scholar]
- 12.Hopp RJ, Bewtra AK, Watt GD, Nair NM, Townley RG. Genetic analysis of allergic disease in twins. J Allergy Clin Immunol. 1984;73:265–270. doi: 10.1016/s0091-6749(84)80018-4. [DOI] [PubMed] [Google Scholar]
- 13.Palmer LJ, Burton PR, Faux JA, James AL, Musk AW, Cookson WO. Independent inheritance of serum immunoglobulin E concentrations and airway responsiveness. Am J Respir Crit Care Med. 2000;161:1836–1843. doi: 10.1164/ajrccm.161.6.9805104. [DOI] [PubMed] [Google Scholar]
- 14.Connett JE, Kusek JW, Bailey WC, O'Hara P, Wu M. Design of the Lung Health Study: a randomized clinical trial of early intervention for chronic obstructive pulmonary disease. Control Clin Trials. 1993;14:3S–19S. doi: 10.1016/0197-2456(93)90021-5. [DOI] [PubMed] [Google Scholar]
- 15.Kanner RE. Early intervention in chronic obstructive pulmonary disease: a review of the lung health study results. Med Clin North Am. 1996;80:523–547. doi: 10.1016/s0025-7125(05)70452-1. [DOI] [PubMed] [Google Scholar]
- 16.Hansel NN, Ruczinski I, Rafaels N, Sin DD, Daley D, Malinina A, Huang L, Sandford A, Murray T, Kim Y, et al. Genome-wide study identifies two loci associated with lung function decline in mild to moderate COPD. Hum Genet. 2013;132:79–90. doi: 10.1007/s00439-012-1219-6. [DOI] [PMC free article] [PubMed] [Google Scholar]
- 17.O'Connor G, Sparrow D, Taylor D, Segal M, Weiss S. Analysis of dose–response curves to methacholine: an approach suitable for population studies. Am Rev Respir Dis. 1987;136:1412–1417. doi: 10.1164/ajrccm/136.6.1412. [DOI] [PubMed] [Google Scholar]
- 18.Price AL, Patterson NJ, Plenge RM, Weinblatt ME, Shadick NA, Reich D. Principal components analysis corrects for stratification in genome-wide association studies. Nat Genet. 2006;38:904–909. doi: 10.1038/ng1847. [DOI] [PubMed] [Google Scholar]
- 19.Purcell S, Neale B, Todd-Brown K, Thomas L, Ferreira MA, Bender D, Maller J, Sklar P, de Bakker PI, Daly MJ, et al. PLINK: a tool set for whole-genome association and population-based linkage analyses. Am J Hum Genet. 2007;81:559–575. doi: 10.1086/519795. [DOI] [PMC free article] [PubMed] [Google Scholar]
- 20.Hao K, Bosse Y, Nickle DC, Pare PD, Postma DS, Laviolette M, Sandford A, Hackett TL, Daley D, Hogg JC, et al. Lung EQTLs to help reveal the molecular underpinnings of asthma. PLoS Genet. 2012;8:e1003029. doi: 10.1371/journal.pgen.1003029. [DOI] [PMC free article] [PubMed] [Google Scholar]
- 21.Schadt EE, Molony C, Chudin E, Hao K, Yang X, Lum PY, Kasarskis A, Zhang B, Wang S, Suver C, et al. Mapping the genetic architecture of gene expression in human liver. PLoS Biol. 2008;6:e107. doi: 10.1371/journal.pbio.0060107. [DOI] [PMC free article] [PubMed] [Google Scholar]
- 22.Pruim RJ, Welch RP, Sanna S, Teslovich TM, Chines PS, Gliedt TP, Boehnke M, Abecasis GR, Willer CJ. LocusZoom: regional visualization of genome-wide association scan results. Bioinformatics. 2010;26:2336–2337. doi: 10.1093/bioinformatics/btq419. [DOI] [PMC free article] [PubMed] [Google Scholar]
- 23.Scichilone N, Battaglia S, La SA, Bellia V. Clinical implications of airway hyperresponsiveness in COPD. Int J Chron Obstruct Pulmon Dis. 2006;1:49–60. doi: 10.2147/copd.2006.1.1.49. [DOI] [PMC free article] [PubMed] [Google Scholar]
- 24.Gumerson JD, Michele DE. The dystrophin-glycoprotein complex in the prevention of muscle damage. J Biomed Biotechnol. 2011;2011:210797. doi: 10.1155/2011/210797. [DOI] [PMC free article] [PubMed] [Google Scholar]
- 25.Sharma P, Tran T, Stelmack GL, McNeill K, Gosens R, Mutawe MM, Unruh H, Gerthoffer WT, Halayko AJ. Expression of the dystrophin-glycoprotein complex is a marker for human airway smooth muscle phenotype maturation. Am J Physiol Lung Cell Mol Physiol. 2008;294:L57–L68. doi: 10.1152/ajplung.00378.2007. [DOI] [PubMed] [Google Scholar]
- 26.Skloot G, Togias A. Bronchodilation and bronchoprotection by deep inspiration and their relationship to bronchial hyperresponsiveness. Clin Rev Allergy Immunol. 2003;24:55–72. doi: 10.1385/CRIAI:24:1:55. [DOI] [PubMed] [Google Scholar]
- 27.Chin LY, Bosse Y, Pascoe C, Hackett TL, Seow CY, Pare PD. Mechanical properties of asthmatic airway smooth muscle. Eur Respir J. 2012;40:45–54. doi: 10.1183/09031936.00065411. [DOI] [PubMed] [Google Scholar]
- 28.Desjardins PR, Burkman JM, Shrager JB, Allmond LA, Stedman HH. Evolutionary implications of three novel members of the human sarcomeric myosin heavy chain gene family. Mol Biol Evol. 2002;19:375–393. doi: 10.1093/oxfordjournals.molbev.a004093. [DOI] [PubMed] [Google Scholar]
- 29.Rossi AC, Mammucari C, Argentini C, Reggiani C, Schiaffino S. Two novel/ancient myosins in mammalian skeletal muscles: MYH14/7b and MYH15 are expressed in extraocular muscles and muscle spindles. J Physiol. 2010;588:353–364. doi: 10.1113/jphysiol.2009.181008. [DOI] [PMC free article] [PubMed] [Google Scholar]
- 30.Luke MM, Lalouschek W, Rowland CM, Catanese JJ, Bolonick JI, Bui ND, Greisenegger S, Endler G, Devlin JJ, Mannhalter C. Polymorphisms associated with both noncardioembolic stroke and coronary heart disease: Vienna Stroke Registry. Cerebrovasc Dis. 2009;28:499–504. doi: 10.1159/000236914. [DOI] [PMC free article] [PubMed] [Google Scholar]
- 31.Luke MM, O'Meara ES, Rowland CM, Shiffman D, Bare LA, Arellano AR, Longstreth WT, Jr, Lumley T, Rice K, Tracy RP, et al. Gene variants associated with ischemic stroke: the Cardiovascular Health Study. Stroke. 2009;40:363–368. doi: 10.1161/STROKEAHA.108.521328. [DOI] [PMC free article] [PubMed] [Google Scholar]
- 32.Bare LA, Morrison AC, Rowland CM, Shiffman D, Luke MM, Iakoubova OA, Kane JP, Malloy MJ, Ellis SG, Pankow JS, et al. Five common gene variants identify elevated genetic risk for coronary heart disease. Genet Med. 2007;9:682–689. doi: 10.1097/gim.0b013e318156fb62. [DOI] [PubMed] [Google Scholar]
- 33.Hargreave FE, Dolovich J, O'Byrne PM, Ramsdale EH, Daniel EE. The origin of airway hyperresponsiveness. J Allergy Clin Immunol. 1986;78:825–832. doi: 10.1016/0091-6749(86)90226-5. [DOI] [PubMed] [Google Scholar]
- 34.Gazdik F, Gvozdjakova A, Nadvornikova R, Repicka L, Jahnova E, Kucharska J, Pijak MR, Gazdikova K. Decreased levels of coenzyme Q(10) in patients with bronchial asthma. Allergy. 2002;57:811–814. doi: 10.1034/j.1398-9995.2002.23747.x. [DOI] [PubMed] [Google Scholar]
- 35.Tuder RM, Yoshida T, Fijalkowka I, Biswal S, Petrache I. Role of lung maintenance program in the heterogeneity of lung destruction in emphysema. Proc Am Thorac Soc. 2006;3:673–679. doi: 10.1513/pats.200605-124SF. [DOI] [PMC free article] [PubMed] [Google Scholar]
- 36.Vilarino-Guell C, Wider C, Ross OA, Jasinska-Myga B, Kachergus J, Cobb SA, Soto-Ortolaza AI, Behrouz B, Heckman MG, Diehl NN, et al. LINGO1 and LINGO2 variants are associated with essential tremor and Parkinson disease. Neurogenetics. 2010;11:401–408. doi: 10.1007/s10048-010-0241-x. [DOI] [PMC free article] [PubMed] [Google Scholar]
- 37.Wu YW, Prakash KM, Rong TY, Li HH, Xiao Q, Tan LC, Au WL, Ding JQ, Chen SD, Tan EK. Lingo2 variants associated with essential tremor and Parkinson’s disease. Hum Genet. 2011;129:611–615. doi: 10.1007/s00439-011-0955-3. [DOI] [PubMed] [Google Scholar]
- 38.Speakman JR. Functional analysis of seven genes linked to body mass index and adiposity by genome-wide association studies: a review. Hum Hered. 2013;75:57–79. doi: 10.1159/000353585. [DOI] [PubMed] [Google Scholar]
- 39.van den Berge M, Vonk JM, Gosman M, Lapperre TS, Snoeck-Stroband JB, Sterk PJ, Kunz LI, Hiemstra PS, Timens W, ten Hacken NH, et al. Clinical and inflammatory determinants of bronchial hyperresponsiveness in COPD. Eur Respir J. 2012;40:1098–1105. doi: 10.1183/09031936.00169711. [DOI] [PubMed] [Google Scholar]
- 40.Himes BE, Qiu W, Klanderman B, Ziniti J, Senter-Sylvia J, Szefler SJ, Lemanske RF, Jr, Zeiger RS, Strunk RC, Martinez FD, et al. ITGB5 and AGFG1 variants are associated with severity of airway responsiveness. BMC Med Genet. 2013;14:86. doi: 10.1186/1471-2350-14-86. [DOI] [PMC free article] [PubMed] [Google Scholar]