Abstract
Despite the widely recognized importance of the several species of inositol polyphosphates in cell biology, inositol has not been successfully imaged and quantified inside cells using traditional spectrophotometry. Multi-isotope imaging mass spectrometry (MIMS) technology, however, has facilitated direct imaging and measurement of cellular inositol. After pulsing cells with inositol labeled with the stable isotope Carbon-13 (13C), the label was detected in subcellular volumes by MIMS. The tridimensional localization of 13C within the cell illustrated cellular distribution and local accumulation of inositol. In parallel, we performed control experiments with 13C-Glucose to compare a different 13C distribution pattern. Because many functions recently attributed to inositol polyphosphates are localized in the nucleus, we analyzed its relative nuclear concentration. We engineered yeast with human thymidine permease and viral thymidine kinase, then fed them with 15N-thymidine. This permitted direct analysis of the nuclear DNA through the detection of the 15N isotopic signal. We found practically no co-localization between inositol signal (13C-isotope) and nuclear signal (15N-isotope). The 13C-tag (inositol) accumulation was highest at the plasma membrane and in cytoplasmic domains. In time-course labeling experiments performed with wild type yeast (WT) or modified yeast unable to synthesize inositol from glucose (ino1Δ), the half-time of labeled inositol accumulation was ~1 hour in WT and longer in ino1Δ. These studies should serve as a template to study metabolism and physiological role of inositol using genetically modified yeasts.
Keywords: Multi-isotope Imaging Mass Spectrometry, MIMS, Inositol, Yeast, Signal transduction
INTRODUCTION
Inositol phosphates are a family of soluble or lipid-bound molecules that play fundamental roles in cell signaling1, 2. The large variety shown by inositol phosphates arises from the phosphorylation of the myo-inositol ring at different positions. The many inositol polyphosphate species present in the cytosol, nucleus and membranes of eukaryotic cells constitutes an interconnected grid of molecules regulating almost every aspect of cell physiology. The chief component of this network is the Phospholipase C (PLC)-generated second messenger, IP3, which releases calcium from intracellular stores, representing one of the best-characterized signal transduction paradigms3. The intrinsic inability of the inositol ring, a simple sugar, to be detected using standard spectrophotometer techniques means that, to date, inositol has not been successfully imaged within cells. The development of multi-isotope imaging mass spectrometry (MIMS)4, 5, however, has overcome this limitation. Using inositol labeled with the stable isotope 13C (i.e., 13C6-Inositol) has allowed the visualization and quantification of inositol inside yeast cells by detecting the intracellular distribution of the Carbon-13 tracer6. Our recent yeast study has surprisingly revealed the absence of substantial inositol signal in the yeast nucleus7. The validation of MIMS technology to study intracellular inositol distribution and concentration has opened a new and totally unexplored avenue of research.
METHOD
Synthesis of 13C-Inositol
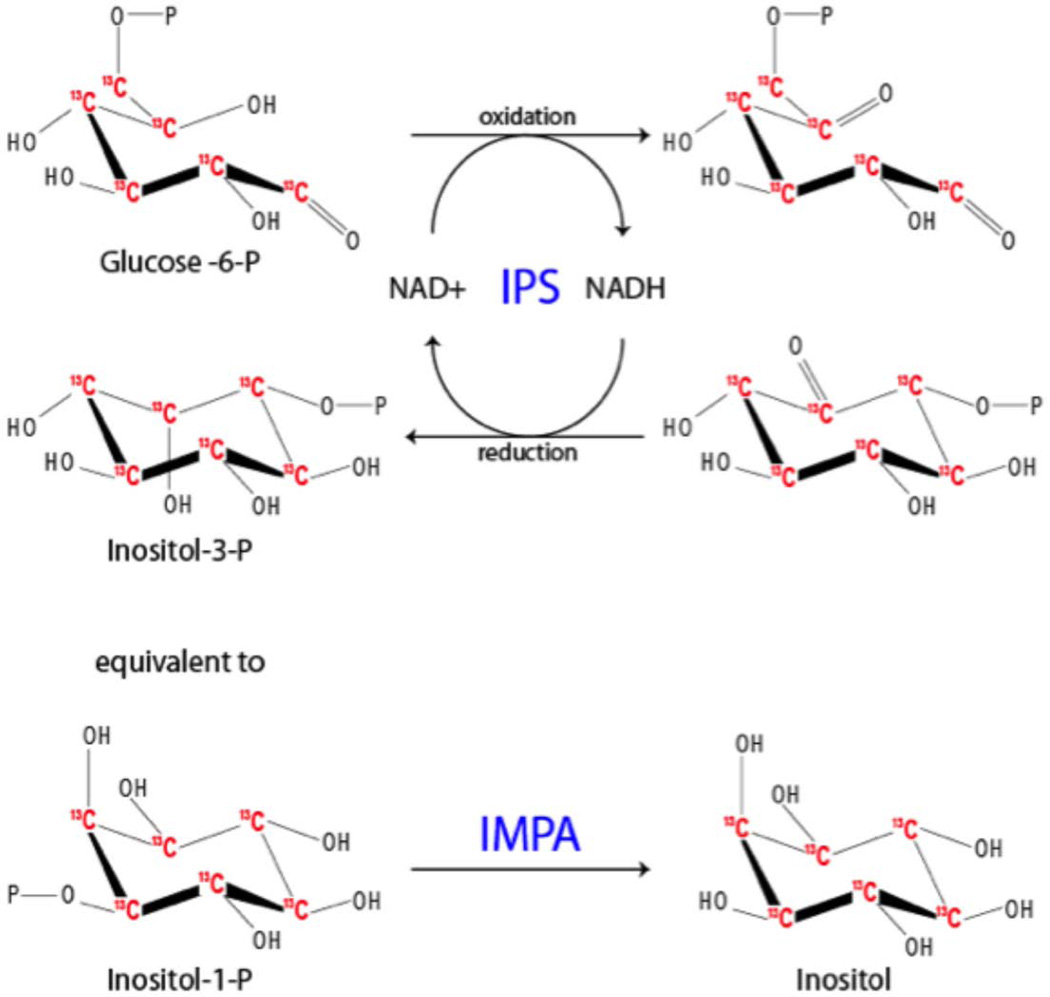
We acquired commercially available 13C6-glucose-6-phosphate and converted it to 13C6-inositol. We used E.coli expressed recombinant inositol phosphate synthase (IPS) and inositol monophosphatase (IMPA) in two step sequential reactions. The final product, 13C-inositol, was then purified from the phosphorylated precursors by Dowex column. Concentration and quality were assayed biologically (Fig. 1).
Figure 1.
Generation of thymidine scavenger pathway in yeast
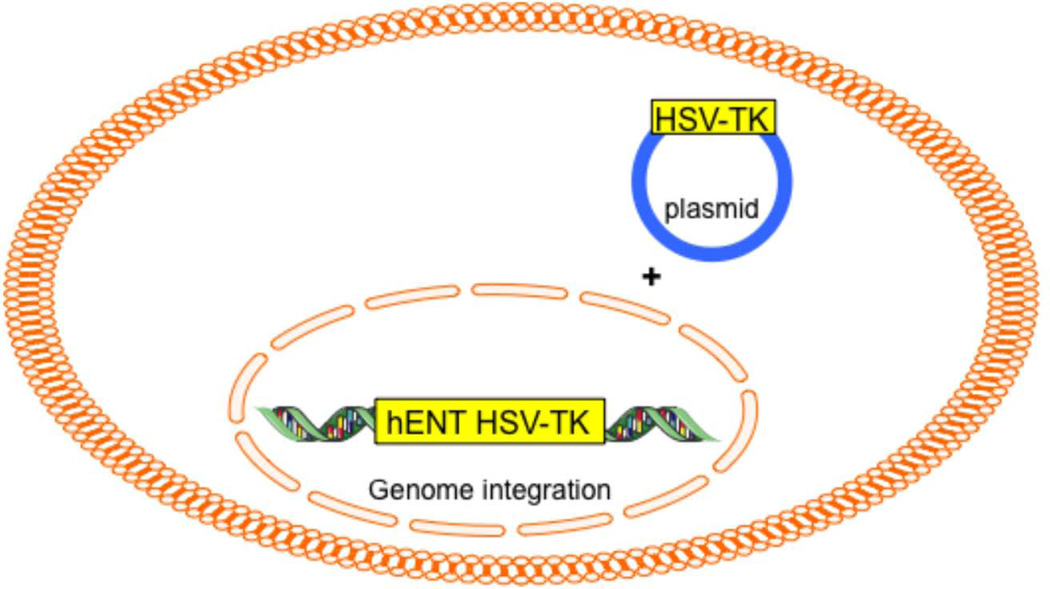
The routine isotopic probe to visualize the nucleus with MIMS 15N-thymidine, which is incorporated into DNA. Unfortunately, yeast lack both an appropriate nucleoside transporter (for thymidine uptake) and thymidine kinase (to phosphorylate thymidine). To visualize the yeast nucleus by MIMS, therefore, we generated a new yeast strain carrying human equilibrative nucleoside transporter (hENT) and the herpes simplex virus thymidine kinases (HSV-TK) integrated in their genome; these yeast were also transformed with a plasmid carrying extra copies of HSV-TK (Fig. 2).
Figure 2.
Labeling
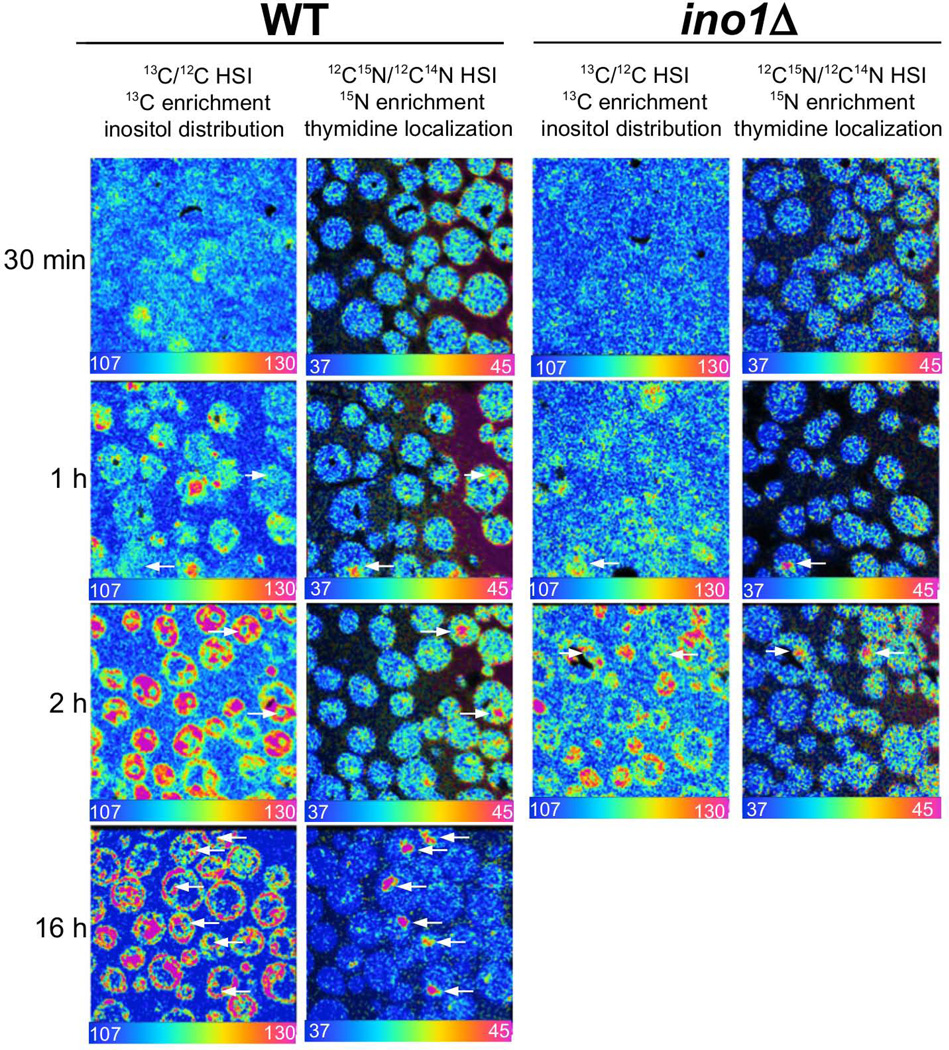
Yeast (both WT and ino1Δ mutant strains) were grown overnight in suspension cultures (at 30°C with shaking) in SD (CSM-Trp-Ura) media. The initial OD600 was 2.0–2.8. For the short-term (≤2hr) labeling experiments, cultured yeasts were then sampled, rinsed in CSM-Ura-Inositol medium, spun, rinsed again, and transferred to a flask containing rinse medium supplemented with 13C6-Inositol and 15N-thymidine to visualize the nucleus (Fig. 3). Samples were collected at 10, 30, 60 and 120 min. For overnight labeling, cultures of the yeasts were started at OD600 0.001 in CSM-Ura-inositol media supplemented with 13C6-Inositol and 15N-thymidine. The final growth density was OD600 1.4 for the wild-type and OD600 0.8 for the ino1Δ mutant strain.
Figure 3.
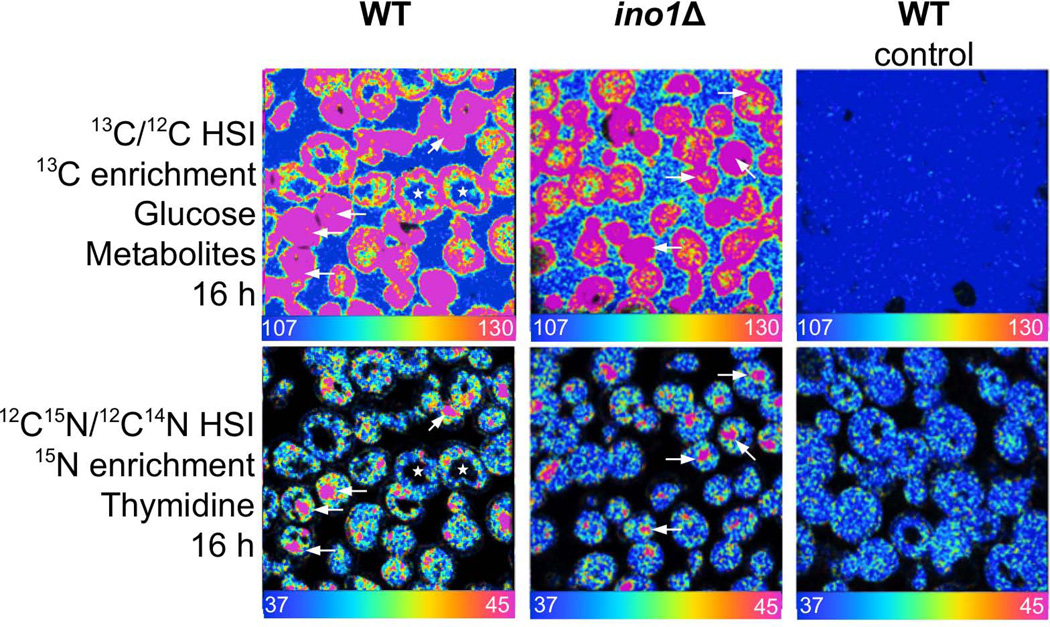
For the control experiment (Fig. 4), cultures of ino1Δ were cultured overnight (from OD600 0.005 to OD600 1.1) in SD (CSM-Ura no glucose) supplemented with either 13C-glucose or normal glucose and 15N-thymidine. Samples were washed and spun twice, then resuspended in growth medium and prepared as described below.
Figure 4.
Preparation for analysis
At each collection time point, the cells were washed (CSM-Ura medium), spun, and then resuspended in wash media to which PFG fixative was added. Fixed yeast were embedded in epon and sectioned.
RESULTS
Quantitative data acquired with MIMS were processed with customized software for image analysis, using a method based on Hue Saturation Intensity (HSI) transformation of the isotope ratio image. The scale of the HSI images follow the color of the rainbow from a lower bound blue set at natural abundance (e.g. 15N/14N=0.0037) to red set above natural abundance. For ease of viewing, all ratio scales are multiplied by a factor of 104, e.g. such that 0.0037 is reported as 37. The figures represent HSI analysis of sectioned yeast: the colors correspond to the excess 13C derived from the measured 13C/12C isotope ratios revealing 13C-inositol enrichment. The 15N signal is measured at 12C15N, thus the 15N-thymidine enrichment HSI analysis is expressed as 12C15N /12C14N (Fig. 3).
In the control experiment, labeling with 13C-glucose resulted in fairly homogeneous uptake of the isotope label (Fig. 4). This is in direct contrast to the localized increased 13C signal that results from labeling with 13C-inositol. Furthermore, with 13C-glucose labeling, isotopic tag co-localizes with 15N from 15N-thymidine.
The analysis of the enrichment in 13C for various incubation times extracted from 13C hot spots for WT and ino1Δ yeasts indicate that these two strains accumulate 13C-inositol in similar fashions. The half-times for inositol incorporation for wild type and for ino1Δ is approximately 70 minutes. While glucose is uniformly distributed within the yeast, inositol distribution is uneven, with accumulation immediately under the capsule.
CONCLUSION
Knowledge of inositol localization and concentration in the subcellular compartments of eukaryotic cells is of fundamental importance. Furthermore, considering the immense consequences of altered inositol signaling in human diseases such as cancer8 or in neurological disorders including schizophrenia and depression9, visualizing intracellular inositol metabolism will have far reaching implications for human health. We can now localize and measure inositol incorporation in subcellular domains of a single yeast. Taking advantage of yeast mutants, we are now be able to dissect the metabolic pathways of an essential player in signal transduction. This will shed light on how the dynamic network of signaling inositides is maintained and regulated inside cells, and should catalyze a leap forward in inositol polyphosphate research.
ACKNOWLEDGEMENTS
C. Lechene is funded by the NIH (5P41EB001974-13, AG034641,R01 AG040019, R21AG034641-01, R01 AG040209), Human Frontier Science Program (RGP0048) and the Ellison Medical Foundation (AG-SS-2215-08). A. Saiardi is funded by Human Frontier Science Program Grant. Agreement: RGP00048/2009-C and Medical Research Council support of the Cell Biology Unit.
REFERENCES
- 1.Irvine RF, Schell MJ. Nat. Rev. Mol. Cell Biol. 2001;2(5):327–338. doi: 10.1038/35073015. PMID: 11331907. [DOI] [PubMed] [Google Scholar]
- 2.Resnick AC, Saiardi A. Front. Biosci. 2008;13:856–866. doi: 10.2741/2726. PMID: 17981594. [DOI] [PubMed] [Google Scholar]
- 3.Irvine RF. Nat. Rev. Mol. Cell Biol. 2003;4(7):586–590. doi: 10.1038/nrm1152. PMID: 12838341. [DOI] [PubMed] [Google Scholar]
- 4.Lechene C, Hillion F, McMahon G, Benson D, Kleinfeld AM, Kampf JP, Distel D, Luyten Y, Bonventre J, Hentschel D, Park KM, Ito S, Schwartz M, Benichou G, Slodzian G. J. Biol. 2006;5(6):20. doi: 10.1186/jbiol42. PMCID: PMC1781526. [DOI] [PMC free article] [PubMed] [Google Scholar]
- 5.Steinhauser ML, Bailey AP, Senyo SE, Guillermier C, Perlstein TS, Gould AP, Lee RT, Lechene CP. Nature. 2012;481(7382):516–519. doi: 10.1038/nature10734. PMCID: PMC3267887. [DOI] [PMC free article] [PubMed] [Google Scholar]
- 6.Saiardi A, Lechene C. HFSP Awardees Meeting Kovalam. Kerala, India: 2010. 31 October – 3 November, Abstract 84. [Google Scholar]
- 7.Saiardi A, Guillermier C, Poczatek JC, Loss O, Lechene C C. HFSP Awardees Meeting. Daegu, South Korea: 2012. Jul 1–4, Abstract 47. [Google Scholar]
- 8.Raimondi C, Falasca M. Curr. Med. Chem. 2011;18(18):2763–2769. doi: 10.2174/092986711796011238. PMID: 21568903. [DOI] [PubMed] [Google Scholar]
- 9.Berridge MJ, Lipp P, Bootman MD. Nat. Rev. Mol. Cell. Biol. 2000;1(1):11–21. doi: 10.1038/35036035. PMID: 11413485. [DOI] [PubMed] [Google Scholar]


