Abstract
Cell division is commonly quantified by the administration of nucleotide labels that are incorporated by the nucleotide salvage pathway. A new approach uses precursors of the de novo nucleotide synthesis pathway, such as labeled water or glucose. Because such precursors are not specific for DNA synthesis, studies utilizing this approach have analyzed isolated genomic DNA to exclude nonspecific background labeling. We hypothesized that pulse-chase administration of stable isotope labeled water would result in sufficient nuclear labeling to enable discrimination of recently divided cells by quantitative ion microscopy. We administered deuterated (D)-water and 15N-thymidine to mice concurrently, guided by the rationale that 15N-thymidine incorporation would serve as a “gold standard” to identify dividing cells. We show both qualitatively and quantitatively that dividing cells in the small intestine (15N-labeled) demonstrate a discernable D-signal in the nucleus not observed in undivided cells (15N-unlabled). Correlation with 31P− and 12C15N−:12C14N− images demonstrate preferential localization of 2H labeling in regions of the nucleus with high DNA content as expected of labeling being incorporated during DNA synthesis and cell division. These data support the concept that stable isotope tagged precursors of the de novo nucleotide synthesis pathway can be used in concert with NanoSIMS to study cell division in vivo. A major implication of this study then is the possibility of using stable isotope tagged water and MIMS to study human cell turnover.
Introduction
Quantifying cell division is of broad relevance in biology, in particular to the fields of cancer, developmental, and regenerative biology. DNA labels, which are incorporated into the replicating genome during cell division, are used to capture cumulative division events occurring during a period of label administration. Commonly used nucleotide labels, including radiolabeled thymidine or halogenated analogues, have well-documented pitfalls however, including reagent toxicity[1, 2]. These limitations provide strong rationale for the application of multi-isotope imaging mass spectrometry (MIMS) to study cell division with innocuous stable isotope DNA labels.
We define MIMS as the combination of using stable isotope tracers with their measurement by high-resolution ion microscopy (NanoSIMS, Cameca)[3]. We previously used MIMS to study DNA synthesis, using stable isotope tagged thymidine to measure cell division in tissues ranging from the mouse small intestine to human white blood cells, in vivo[4]. The current study explores a complementary approach to measure cell division based on the de novo nucleotide synthesis pathway and building on work by Hellerstein and colleagues who measured the incorporation of de novo pathway labels with gas chromatography-isotope ratio mass spectrometry in bulk samples[5, 6]. Here we demonstrate the power of MIMS to detect dividing cells in tissues after in vivo pulse-chase administration of deuterated water.
Methods
NanoSIMS
Analyses were performed using the NanoSIMS 50L (Cameca). Instrumental conditions for each analysis are described in the results section and figure legends. Ratio images are displayed using a hue saturation intensity transformation with the lower bound of the scale set at natural abundance. For ease of viewing, all ratio scales are multiplied by a factor of 104.
Mice
Osmotic minipumps (Alzet) were inserted subcutaneously into male C57Bl6 mice (8-10 wks, Charles River), delivering 20 μg/h 15N-thymidine (Cambridge Isotopes Laboratory, Inc). Sterile deuterium oxide (>97% D) was injected intraperitoneally, 200 μl on day 1, and then 60 μl per day on days 2 and 3.
Sample preparation
Tissues were fixed with 4% paraformaldehyde, embedded in LR white, sectioned (0.5 μm), and mounted on silicon chips. Sections were examined using differential interference contrast microscopy and areas containing longitudinally oriented crypts and villi were photographed and their coordinates recorded. These coordinates were transferred to the NanoSIMS instrument to enable anatomically targeted analysis.
Statistics
In this proof-of-principle study, D-signal was measured in two cell populations, 15N-labeled and 15N-unlabeled cells. The analysis shown here is from one mouse per time-point and one histologic section of small intestine; however, the data are representative of experiments conducted using 3 different D-water dosing protocols. Statistical analyses were performed using Prism version 6.0 (Figure 2) or Jmp version 10 (Figure 3). The Student’s t-test was used to compare two, independent, normally distributed groups. Non-parametric data was compared using the Mann-Whitney test. A p value of <0.05 on a two-tailed test was used to indicate significance.
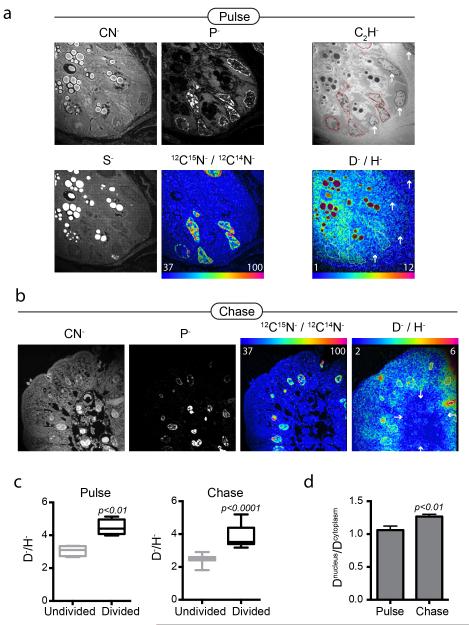
Figure 2. D-water labeling discriminates dividing cells in the mouse small intestine.
Mice pulsed for 3 days with D-water, while also receiving 15N-thymidine (20 μg/h). Samples of small intestine were harvested after 3-day pulse and again after 3-day label-free chase. (a) Small intestinal crypt. The field was first analyzed for masses CN, P, S, then masses C2H, D, and H. Nuclei are seen brightly in the P image. Sulfur rich granules in Paneth cells are seen brightly in the S image. The 12C15N:12C14N HSI image shows dividing crypt cells. The D:H HSI image shows higher D signal in the cells that have divided (15N+, nuclear ROI traced) compared to the undivided cells (arrows). Field = 28 × 28 μm, 85 planes; pixels = 256 × 256, 1.0 ms/pixel. (b) After 3-day chase, divided epithelial cells (15N+) at villus tip also show D label (nuclear ROI traced); whereas undivided (15N−) cells on the interior of the villus show low D labeling. Field = 28 × 28 μm, 77 planes; pixels = 256 × 256, 1.0 ms/pixel. (c) Graphs of nuclear D-signal in divided cells (15N+, n=7-12) versus undivided (15N−, n=4-11) cells. Box and whisker plot shows max/min. (d) Graph of the ratio of nuclear to cytoplasmic D-signal in divided cells (15N+, n=7-12). With chase, the ratio of nuclear to cytoplasmic D-signal increases, consistent with stability of genomic labeling and decay of signal in non-genomic material (e.g. protein). Data expressed as mean +/− S.E.M.
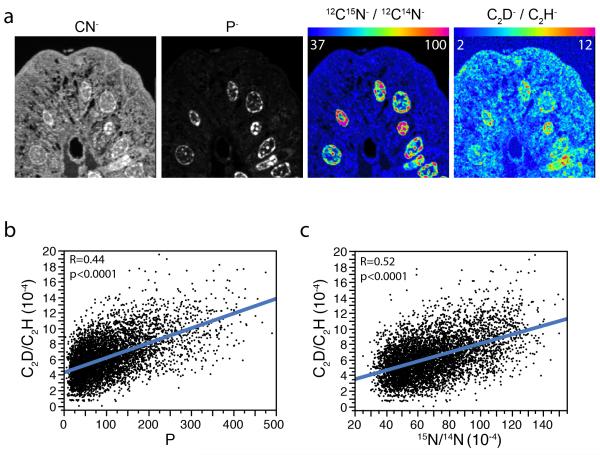
Figure 3. D-labeling of dividing cells correlates with both 15N-thymidine labeling and the phosphorus signal, consistent with its incorporation in newly synthesized DNA.
(a) Deflection plate switching allowed measurement of C2D−/C2H− and 12C15N−/12C14N− in an alternating sequence with successive planes. Intestinal villus after 3d D-water/15N-thymidine pulse and 3d chase. P, 15N, and D are preferentially localized in the nuclei in a distribution expected of chromatin. Field = 28 × 28 μm, 77 planes; pixels = 256 × 256, 66 s/plane. (b) Pixel-by-pixel correlation between the C2D− and P− signals. Blue line: best-fit linear regression line. (c) Pixel-by-pixel correlation between C2D and 15N shows similar linear relationship, consistent with incorporation of D in the nuclear DNA of divided cells.
Results
Theoretical basis for preferential labeling of DNA by D-water
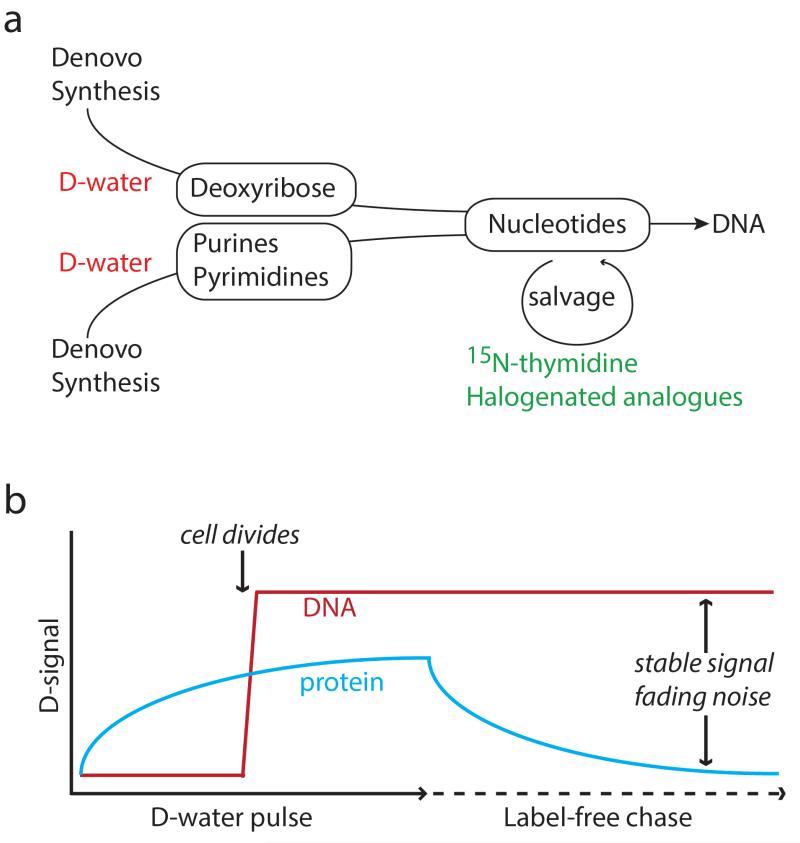
A prerequisite for identifying dividing cells using labeled precursors to de novo nucleotide synthesis (Figure 1a) is that nonspecific incorporation into non-DNA molecules does not obscure the signal. This problem has been solved for analysis of bulk samples by performing compound specific measurement of genomic DNA with GC-IRMS[5, 6]. We hypothesized that pulse-chase labeling protocols would allow discrimination of divided from non-divided cells based on the inherent stability of DNA relative to other cellular constituents, such as proteins. While a nonspecific label like D-water may be universally incorporated, labeling intensity should depend on the biosynthetic rate. Therefore, DNA labeling of a dividing cell where the entire genome is rapidly replicated is likely to exceed the background incorporation by biosynthetic reactions in quiescent cells. DNA labeling should also become more easily discriminated during a label-free chase period due its stability, in contrast to the expected dilution of non-specific labeling due to ongoing turnover of cellular constituents (e.g. protein).
Figure 1. Labeling DNA synthesis and cell division via the de novo nucleotide synthesis pathway.
(a) Schematic of contrasting DNA labeling strategies. The most common approach to tracking DNA synthesis is by accessing the nucleotide salvage pathway with labeled thymidine (e.g. 15N-thymidine, 3H-thymidine) or halogenated nucleotide analogues (e.g. bromodeoxyuridine-BrdU). In contrast, D-water is incorporated by de novo nucleotide synthesis. (b) During cell division, rapid DNA synthesis coincides with complete replication of the genome, which should lead to rapid D incorporation, exceeding incorporation by maintenance biosynthetic pathways (e.g. protein turnover). During chase, D contained in protein will be diluted by ongoing turnover, whereas signal contained in genomic DNA remains relatively stable until the next cell division.
Identifying dividing cells with D-water labeling
We compared the labeling patterns in the murine small intestine after pulse-chase with D-water to those achieved with the specific nucleotide label, 15N-thymidine. During a 3-day pulse period, mice were administered 15N-thymidine continuously and D-water by daily i.p. injection, a dose chosen to achieve a total body concentration of D-water of approximately 1-2%. Mice were sacrificed after 3-day pulse and again after a 3-day label free chase. 15N-thymidine labeling was considered the “gold standard” for cell division, allowing for comparison of nuclear D-labeling in divided (15N+) to undivided (15N−) cells. After both pulse and pulse-chase, D-signal was significantly higher in the nuclei of divided cells. As predicted, however, D-labeling became qualitatively more evident during label-free chase as the nuclear D-signal now resembled chromatin. Consistent with this observation, the ratio between nuclear and cytoplasmic D-labeling during chase increased (Figure 2d), consistent with the model shown in Fig 1b where the D-signal fades in the non-genomic cellular constituents due to ongoing turnover, while the DNA signal remains. Interestingly, we also observed high D-signal in the Paneth cell granules (Figure 2a), presumably reflecting their high rate of turnover.
D-water is incorporated into the DNA of dividing cells
If D-water was incorporated into DNA, we predicted that its signal would correlate with both phosphorus (higher in chromatin)[7] and to 15N, due to the specific incorporation of thymidine in DNA. The capacity for parallel detection of multiple ionic masses allowed the assessment of signal correlation on a pixel-by-pixel basis. We measured C2D:C2H as a surrogate for D:H because it gives approximately 6-fold higher count rates and it allowed imaging of phosphorus (mass 31). Phosphorus images show nuclear predominance in a pattern consistent with chromatin. Due to its specific incorporation into newly synthesized DNA via the nucleotide salvage pathway, the 15N signal (12C15N:12C14N) localized to phosphorus rich regions of the nucleus. While deuterium is not exclusively found in the nucleus, regions of high D-labeling resemble both the 15N and and P signals, and similar to chromatin (Figure 3A). When each ion of interest was measured on a pixel-by-pixel basis from the nuclei of divided cells (15N-thymidine-labeled), the C2D:C2H ratio showed a positive correlation with the 12C15N:12C14N ratio and P counts, consistent with the incorporation of deuterium in newly synthesized DNA. This offers quantitative evidence supporting the use of D-water to label DNA, while also underscoring the power of parallel quantitation of multiple masses.
Discussion
This study aimed to develop a practical approach to label dividing cells, in vivo, with an orally administered stable isotope tracer, specifically D-water, a precursor to de novo nucleotide synthesis (Figure 1a) previously shown to be incorporated into DNA by measurements of isotope ratio in bulk samples[5]. An important question in this study was whether nonspecific labeling of quiescent cells would make it impossible to discriminate dividing cells. The data shown here support the concept (Figure 1b) that high-precision quantitative ion microscopy (NanoSIMS) can distinguish dividing cells after pulse-chase labeling with D-water. Indeed, divided cells are resolvable after pulse labeling, presumably because the rate of synthesis of DNA and other nuclear constituents during mitosis exceeds the maintenance turnover of cellular constituents in non-cycling cells. Moreover, the signal-to-noise ratio improves during label-free chase, presumably because DNA label is stably incorporated, whereas proteins and other cellular constituents continue to turn over.
The methodology described here will be particularly useful for slowing dividing cell populations where stable isotope enriched water enables DNA labeling over extended time-scales. For such challenging biological questions, the advantage of scaling DNA labeling over months to years may outweigh the loss of labeling specificity. Given the favorable safety profile of stable isotopes and their extensive precedent of safe use in humans[8], D-water-labeling is a practical strategy for studying human cell turnover.
References
- [1].Wilson A, Laurenti E, Oser G, van der Wath RC, Blanco-Bose W, Jaworski M, Offner S, Dunant CF, Eshkind L, Bockamp E, Lio P, Macdonald HR, Trumpp A. Cell. 2008;135:1118. doi: 10.1016/j.cell.2008.10.048. [DOI] [PubMed] [Google Scholar]
- [2].Hu VW, Black GE, Torres-Duarte A, Abramson FP. Faseb J. 2002;16:1456. doi: 10.1096/fj.02-0142fje. [DOI] [PubMed] [Google Scholar]
- [3].Lechene C, Hillion F, McMahon G, Benson D, Kleinfeld AM, Kampf JP, Distel D, Luyten Y, Bonventre J, Hentschel D, Park KM, Ito S, Schwartz M, Benichou G, Slodzian G. J Biol. 2006;5:20. doi: 10.1186/jbiol42. [DOI] [PMC free article] [PubMed] [Google Scholar]
- [4].Steinhauser ML, Bailey AP, Senyo SE, Guillermier C, Perlstein TS, Gould AP, Lee RT, Lechene CP. Nature. 2012;481:516. doi: 10.1038/nature10734. [DOI] [PMC free article] [PubMed] [Google Scholar]
- [5].Neese RA, Misell LM, Turner S, Chu A, Kim J, Cesar D, Hoh R, Antelo F, Strawford A, McCune JM, Christiansen M, Hellerstein MK. Proc Natl Acad Sci U S A. 2002;99:15345. doi: 10.1073/pnas.232551499. [DOI] [PMC free article] [PubMed] [Google Scholar]
- [6].Hellerstein MK, Hoh RA, Hanley MB, Cesar D, Lee D, Neese RA, McCune JM. J Clin Invest. 2003;112:956. doi: 10.1172/JCI17533. [DOI] [PMC free article] [PubMed] [Google Scholar]
- [7].Guerquin-Kern JL, Hillion F, Madelmont JC, Labarre P, Papon J, Croisy A. Biomed Eng Online. 2004;3:10. doi: 10.1186/1475-925X-3-10. [DOI] [PMC free article] [PubMed] [Google Scholar]
- [8].Steinhauser ML, Lechene CP. Semin Cell Dev Biol. 2013 doi: 10.1016/j.semcdb.2013.05.001. [DOI] [PMC free article] [PubMed] [Google Scholar]


