

Background: Steap metalloreductases are critical to metal homeostasis and linked to multiple diseases.
Results: Single b-type heme, FAD, and iron binding sites are identified in the Steap3 transmembrane domain and kinetically characterized.
Conclusion: Steap transmembrane domains contain a single b-type heme and a high affinity FAD binding site that coordinates intrasubunit, transmembrane electron transfer.
Significance: The findings extend to Steap family proteins in general, including Steap1.
Keywords: copper, copper transport, flavin adenine dinucleotide (FAD), iron, iron metabolism, Steap1, Steap3, b-type cytochrome, cupric reductase, ferric reductase
Abstract
Six-transmembrane epithelial antigen of the prostate 3 (Steap3) is the major ferric reductase in developing erythrocytes. Steap family proteins are defined by a shared transmembrane domain that in Steap3 has been shown to function as a transmembrane electron shuttle, moving cytoplasmic electrons derived from NADPH across the lipid bilayer to the extracellular face where they are used to reduce Fe3+ to Fe2+ and potentially Cu2+ to Cu1+. Although the cytoplasmic N-terminal oxidoreductase domain of Steap3 and Steap4 are relatively well characterized, little work has been done to characterize the transmembrane domain of any member of the Steap family. Here we identify high affinity FAD and iron biding sites and characterize a single b-type heme binding site in the Steap3 transmembrane domain. Furthermore, we show that Steap3 is functional as a homodimer and that it utilizes an intrasubunit electron transfer pathway through the single heme moiety rather than an intersubunit electron pathway through a potential domain-swapped dimer. Importantly, the sequence motifs in the transmembrane domain that are associated with the FAD and metal binding sites are not only present in Steap2 and Steap4 but also in Steap1, which lacks the N-terminal oxidoreductase domain. This strongly suggests that Steap1 harbors latent oxidoreductase activity.
Introduction
The daily production of 200 billion erythrocytes accounts for nearly 80% of the total iron demand in humans (1). To meet this need, developing erythrocytes utilize the transferrin cycle to import iron into the cell. In this process, iron-loaded transferrin is bound at the cell surface by the transferrin receptor. This is followed by endocytosis and acidification of the endosomal compartment, which promotes release of Fe3+. The Fe3+ is then reduced to Fe2+ by six-transmembrane epithelial antigen of the prostate 3 (Steap3),2 the major ferric reductase of the erythroid transferrin cycle (2, 3). Finally, Fe2+ is transported across the endosomal membrane by divalent metal transporter 1 where it supports the synthesis of hemoglobin and other cellular needs or in iron-replete cells is sequestered within the iron storage protein ferritin.
Among proteins comprising the transferrin cycle, Steap3 is the most recent to be identified (2–4). The work by Ohgami et al. (2) included protein homology analyses that provided initial clues to its function and mechanism. Steap3 and its homologs Steap2 and Steap4 were predicted to be composed of two distinct domains: an N-terminal cytoplasmic domain and a C-terminal transmembrane domain (2, 5–7). The closest homolog for the N-terminal cytoplasmic domain is the prokaryotic F420:NADP+ oxidoreductase. F420H2:NADP+ oxidoreductase utilizes an elaborated Rossmann or dinucleotide binding domain to bind NADPH and the flavin-derivative F420 (8). In methanogens, F420H2:NADP+ oxidoreductase reduces F420 to F420H2, which is subsequently used to reduce CO2 to methane. Because the flavin analog F420 is not known in mammals, the homology suggested that the N-terminal domain of Steap3 would instead bind NAD(P)H and a flavin, such as FAD or FMN.
The C-terminal domain was predicted to contain six transmembrane α-helices with distant homology to yeast ferric reductases and to mammalian NADPH oxidase among others (2). Thus, collectively, the transmembrane domains of the Steap, ferric reductase, and NADPH oxidase protein families place each of these within the greater “ferric reductase domain” (FRD) superfamily (9). In this light, members of the ferric reductase and NADPH oxidase families utilize cytosolic domains or subunits to transfer electrons from NADPH to FAD. The reduced FADH2 then transfers its electrons to the transmembrane domain of these proteins, which utilizes two embedded heme cofactors to move the electrons across the membrane to the extracellular or luminal face of the protein for the reduction of iron or O2, respectively. For ferric reductase and NADPH oxidase, the two heme moieties are coordinated by four histidine residues in their transmembrane segments. Interestingly, in Steap3 and its mammalian homologs, only two of these histidine residues are conserved, thus predicting only a single transmembrane heme (2).
The crystal structures of the truncated cytoplasmic oxidoreductase domains have been determined for Steap3 and Steap4 (10, 11). Their structures are quite similar with a backbone root mean square deviation of 1 Å (11). In each case, these oxidoreductase domains crystallized as 2-fold symmetric dimers. Furthermore, the N-terminal Steap3 oxidoreductase domain was found to dimerize at low millimolar concentrations in solution. Collectively, these observations suggest that full-length Steap3 may be present in cellular membranes as a homodimer.
As expected, F420H2:NADP+ oxidoreductase was indeed found to be a structural homolog to the Steap oxidoreductase domain (Steap3 backbone root mean square deviation of 1.44 Å) (10). Furthermore, like F420H2:NADP+ oxidoreductase, both Steap3 and Steap4 were co-crystallized with NADPH. Unlike F420H2:NADP+ oxidoreductase, however, neither could be co-crystallized with a flavin. And in contrast to F420H2:NADP+ oxidoreductase, the crystal structures of the isolated oxidoreductase domains of Steap3 and Steap4 show that the nicotinamide ring of NADPH lies in an open, solvent-exposed pocket.
Although structural studies of the isolated Steap3 and Steap4 oxidoreductase domains failed to identify a flavin binding site, flavin-dependent NADPH oxidase activity was observed for the truncated Steap4 domain (11). However, this truncated construct exhibits extremely high, nonphysiological Km values (>100 μm) for each of the flavins examined (FAD, FMN, and riboflavin). Thus, contrary to initial expectations, these observations collectively suggested that the oxidoreductase domain does not contain a fully functional flavin binding site. Furthermore, by process of elimination, it also suggested that structural elements within the C-terminal transmembrane domain could play a major role in flavin recognition.
Thus, although biochemical and structural studies have provided valuable insights into Steap structure-function relationships in the N-terminal oxidoreductase domain, many questions remain regarding the C-terminal transmembrane domain and the full-length protein. Specifically, although sequence analysis identifies one pair of heme-coordinating residues, does the transmembrane domain indeed contain only a single heme cofactor? Or is there a second, cryptic heme present; and if so, how is it bound, and what type of heme is utilized (heme a, b, or c)? Does the full-length protein form a homodimer, and if so, what is the functional impact of dimerization? Does the full-length protein bind a specific flavin with high affinity? Does the transmembrane domain play a pivotal role in flavin recognition, and if so, which elements in the transmembrane domain are responsible for high affinity flavin recognition? Finally, where is the iron binding site? Does the iron bind adjacent to the heme, or are electrons transferred from the heme to an iron bound at a more distant site?
Experimental Procedures
Cloning and Mutagenesis of Steap3 Expression Constructs
Homo sapiens STEAP3 cDNA was PCR-amplified with primers that generate a HindIII restriction site on the 5′-end of the transcript and a KpnI restriction site on the 3′-end (HindIII.Steap3 and Steap3.KpnI, respectively; Table 1). The gene was cloned into the pcDNA3.1 (Invitrogen) expression plasmid utilizing HindIII and KpnI restriction sites in the multiple cloning site. To generate fluorescent protein-tagged gene products, the Invitrogen Gateway cloning system (12) was used. Briefly, pDEST vectors for this work were made by cloning the Gateway recombination cassette (12) into Venus and Venus fragment plasmids (kindly provided by Dr. Chang-Deng Hu; Ref. 13). H. sapiens STEAP3 cDNA was PCR-amplified to add complete attB sites at each termini in two subsequent reactions, the first with attB1.Steap3 and Steap3.attB2 primers and the second with Universal.attB1 and Universal.attB2 primers. The product was cloned into pDONR201 using BP Clonase II (Invitrogen). An expression clone was then generated by LR Clonase II enzyme mixture (Invitrogen)-mediated recombination between the Steap3 entry clone and the destination vector pDEST.Venus. The resulting expression clone, Steap3.Venus, encodes a Steap3 fusion with an N-terminal FLAG tag and C-terminal Venus fluorescent protein. Subsequent mutations were introduced into the Steap3 gene using the QuikChange Lightning site-directed mutagenesis kit (Stratagene) with primers designed according to the manufacturer's protocols. All mutations were verified by sequencing prior to use.
TABLE 1.
Primers used in Steap3 cloning
| Cloning primers | |
|---|---|
| HindIII.StrepII | 5′-AAG CTT GCC GCC ATG TGG AGC CAC CCG CAG TTC GAA AAA TCG GCC-3′ |
| Steap3.KpnI | 5′-GGT CTC GGT ACC TCA TAC GTG GCT CGT CTT CTC-3′ |
| attB1.hSteap3 | 5′-GTA CAA AAA AGC AGG CTC CAT GCC AGA AGA GAT GGA CAA GC-3′ |
| hSteap3.attB2 | 5′-GTA CAA GAA AGC TGG GTC CTA CGT GGC TCG TCT TCT CG-3′ |
| Universal.attB1 | 5′-GGG GAC AAG TTT GTA CAA AAA AGC AGG CTC C-3′ |
| Universal.attB2 | 5′-GGG GAC CAC TTT GTA CAA GAA AGC TGG GTC C-3′ |
| NheI-StrepII | 5′-GGT CTC GCT AGC ATG TGG AGC CAC CCG CAG TTC-3′ |
| StrepII-Steap3 | 5′-ACC CGC AGT TCG AAA AAT CGG CGC CAG AAG AGA TGG ACA AGC-3′ |
| Steap3-EcoRI | 5′-GCG CAC GAA TTC CTA CTC GAT GTT GTG GCG GAT CTT-3′ |
| SalI-His_tag | 5′-GGT CTC GTC GAC ATG CAT CAC CAT CAC CAT CAC ATG CCA G-3′ |
| His_tag-Steap3 | 5′-CAT CAC CAT CAC CAT CAC ATG CCA GAA GAG ATG GAC AAG C-3′ |
| Steap3-NotI | 5′-GAG ACC GCG GCC GCT TAC TTG TAC AGC TCG TCC ATG CCG-3′ |
For bimolecular fluorescence complementation (BiFC) microscopy studies, Steap3 was cloned into two variants of the pDEST.Venus vector using the Gateway system. The variant pDEST.VN173 encodes a truncation of Venus containing residues 1–173. The variant pDEST.VC155 encodes a truncation of Venus containing residues 155–238 (13). The resulting expression plasmids were designated Steap3.VN173 and Steap3.VC155, respectively.
For BiFC activity studies, Steap3.VN173 was PCR-amplified with primers adding a NheI restriction site and StrepII tag on the 5′-end and an EcoRI restriction site on the 3′-end of the Steap3.VN173 product (NheI.StrepII, StrepII.Steap3, and Steap3.EcoRI, respectively). Steap3.VC155 was PCR-amplified with primers adding a SalI restriction site and hexahistidine tag on the 5′-end and NotI restriction site on the 3′-end of the Steap3.VC155 product (SalI-His_tag, His_tag-Steap3, and Steap3-NotI, respectively). Each amplified PCR product was cloned into the pIRES bicistronic vector (Clontech) into the first (Steap3.VN173) and second (Steap3.VC155) multiple cloning sites to yield pIRES.Steap3VN.Steap3VC.
Expression and Solubilization of Steap3
HEK-293F cells (Invitrogen) were maintained in Freestyle 293 Expression Medium (Invitrogen) in spinner flasks at 37 °C and 5% CO2. For transfection, cells were resuspended in fresh media at a density of 2.5 × 10⁶ cells/ml. The expression plasmid was added to cells at a concentration of 3 μg/ml of culture volume and allowed to mix for 5 min. Linear polyethyleneimine (molecular weight, 25,000; Polysciences, Inc.) was then added to the cultures at a concentration of 9 μg/ml of culture. After 8 h, the expression cultures were supplemented with 2.2 mm valproic acid and 0.5 mm 5-aminolevulinic acid, and the culture volume was doubled by addition of fresh medium. Cells were harvested 48 h post-transfection by centrifugation (1,000 × g for 10 min) and resuspended in hypotonic buffer (20 mm HEPES, pH 7.5, 4 °C) at a density of 4 ml of buffer/g of cell pellet. All subsequent steps were performed at 4 °C. Cells were lysed by Dounce homogenization followed by passage through a 24-gauge needle three times and sonication for 10 s. The lysate was centrifuged for 20 min at 1,000 × g to remove unlysed cells and debris. The supernatant was recovered followed by isolation of membranes by ultracentrifugation (125,000 × g for 1 h). The pelleted membranes were resuspended by Dounce homogenization in resuspension buffer (20 mm HEPES, pH 7.5, 150 mm NaCl) at a concentration of 2–3 mg/ml. Detergent-activated membranes were then prepared by addition of 1% Triton X-100 followed by rotation for 1 h.
Steap3 Ferric Reductase Assay
Triton X-100-activated membranes were assayed for ferric reductase activity using the following standard conditions. Membranes were added to reaction buffer (25 mm MES, 25 mm MOPS, 140 mm NaCl, 5.4 mm KCl, 5 mm glucose, 1.8 mm CaCl2, 800 μm MgCl2, pH 7.0, 37 °C) containing 200 μm Fe3+-NTA, 400 μm ferrozine, and 5 μm FAD. The reaction was initiated by addition of 100 μm NADPH. Ferric ion reduction at 37 °C and formation of the Fe2+-ferrozine complex was monitored at 562 nm using a thermostated Varian Cary 50 spectrophotometer using an extinction coefficient for the complex of 27,886 M−1 cm−1 (11). In each case, the reported activities are the differences between Steap3-transfected cells and empty vector controls. Titration data were subsequently fit to a Michaelis-Menten model with GraphPad Prism 5.0 software to determine the Michaelis constant (Km) and maximum reaction velocity (Vmax). Reported kinetic constants are the result of at least three completely independent experiments.
Confocal Microscopy
HEK-293F cells were maintained in DMEM supplemented with 10% FBS in T-75 flasks at 37 °C and 5% CO2. Twenty-four hours prior to transfection, cells were plated onto glass coverslips in a 6-well dish. Co-transfections were performed with Lipofectamine 2000 (Invitrogen) according to the manufacturer's protocol with Steap3.VN173 and Steap3.VC155 expression plasmids. Twenty-four hours post-transfection, cells were washed three times with PBS, and then plasma membranes were stained by incubation with wheat germ agglutinin-Alexa Fluor 633 conjugate (Invitrogen) for 15 min, washed three times with PBS, and fixed in 4% formaldehyde in PBS for 15 min. Cells were then washed three times with PBS, stained with DAPI for 5 min, and mounted on glass cover slides with Vectashield mounting medium (Vector Laboratories). Samples were visualized with a Leica SP5 confocal microscope. Fluorophores were visualized at the following excitation and emission wavelengths: Venus, excitation, 514 nm; emission, 525–560 nm; DAPI, excitation, 405 nm; emission, 450–470 nm; wheat germ agglutinin, excitation, 633 nm; emission, 650–00 nm. Images were processed with Imaris software (Bitplane).
Heme Absorbance Analysis
Triton X-100-activated membranes were analyzed for heme content by absorbance spectroscopy on a Varian Cary 50 spectrophotometer. To obtain oxidized spectra, air-oxidized membranes (1 mg/ml) had their absorbance spectra recorded from 300 to 700 nm. To obtain reduced spectra, a few grains of sodium dithionite were added to the same sample used for the air-oxidized spectrum followed by an immediate spectral analysis from 300 to 700 nm. Finally, difference spectra were obtained by subtracting the oxidized from the reduced spectra.
Results
Ferric Reductase Activity of Steap3
Expression of exogenous human Steap3 (STEAP3) was performed in the Freestyle 293F system, an HEK-293-derived cell line that is easily transfectable and can grow to high densities in suspension cultures. To characterize the enzymatic activity of full-length Steap3, we first developed a ferric reductase activity assay for the intact protein in isolated membranes (see “Experimental Procedures”). Previous enzymatic assays monitored either cell surface ferric reductase activity (2, 3, 11) or flavin-dependent NADPH oxidase activity in a truncated protein (11). In contrast, this assay follows the formation of the Fe2+-ferrozine complex (λmax = 562 nm) and allows the determination of kinetic constants for the full-length protein upon the addition of cytoplasmic (NADPH and FAD) and extracellular substrates (Fe3+).
We then attempted to purify Steap3 to homogeneity. To this end, we screened a variety of commonly used detergents from which Triton X-100 was selected for its ability to solubilize Steap3 ferric reductase activity. However, although Steap3 in detergent-activated membranes retained activity for an extended period of time (days), all attempts to affinity-purify Steap3 activity from the detergent-activated membranes, including the use of anti-FLAG, Strep-tactin, and nickel-NTA resins, resulted in near total loss of enzyme activity. It is not clear whether some critical lipid or cofactor is lost during the on-column immobilization or whether the solubilized protein is simply unstable, but add-back experiments, reconstitution of eluted Steap3 into lipid vesicles, and the use of alternative detergents each failed to preserve or restore activity.
However, during the course of this work, it became clear that His6, FLAG, and Strep-II fusions at the C terminus of Steap3 did not adversely impact enzymatic activity in detergent-activated membranes. This suggested that we could potentially quantitate the amount of Steap3 present in the detergent-activated membranes by fusing Venus fluorescent protein to the C terminus of Steap3 (Steap3-Venus). Indeed, the fusion did not impact activity (Fig. 1A) and thus allowed the measurement of specific activity based upon the fluorescent content of the sample (Table 2). For these reasons, the Triton X-100-activated fraction (“crude membranes + Triton X-100”) of the Steap3-Venus fusion expressed in the presence of δ-aminolevulinic acid (see below) was used for subsequent enzymatic analysis because it contained the highest level of Steap3 specific activity (Table 2). Furthermore, we found that Steap3 expression was enhanced when valproic acid was added to the transfection medium. Valproic acid is a histone deacetylase inhibitor that has been shown previously to enhance transient gene expression in HEK-293 cells (14). The presence of valproic acid in the 293F transfection medium resulted in a ∼1.6-fold increase in expression of Steap3-Venus over unsupplemented expression.
FIGURE 1.
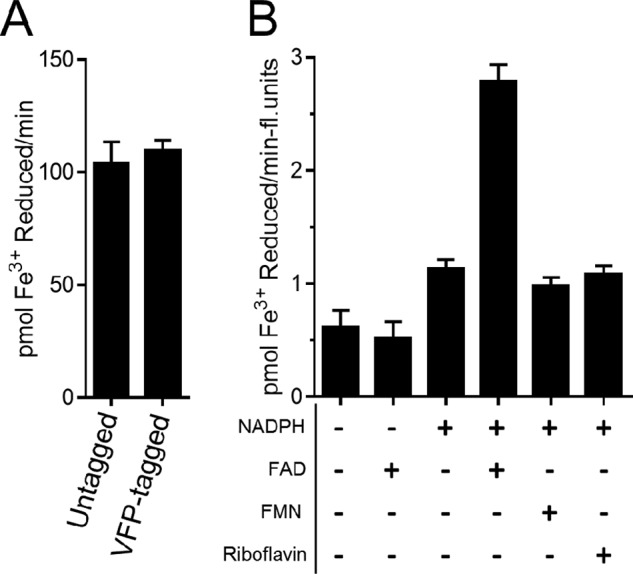
Triton X-100-activated Steap3 is an NADPH- and FAD-dependent ferric reductase. A, Venus fluorescent protein fused to the C terminus of Steap3 does not alter ferric reductase activity and was thus utilized for activity studies. B, Steap3-containing Triton X-100-activated membranes exhibit maximal ferric reductase activity in the presence of both NADPH and FAD. The increase in activity observed with NADPH alone suggests that low levels of endogenous flavin are present in the membranes. Because the addition of FMN and riboflavin does not increase ferric reductase activity above that seen in the absence of exogenous flavin, full-length Steap3 shows a distinct preference for FAD. In each case, the reported activities are the differences between Steap3-transfected cells and empty vector controls.
TABLE 2.
Fractionation of ferric reductase activity in Steap3-Venus-transfected cells
fluor, fluorescence; TX-100, Triton X-100.
| Fraction | Specific activity | Total fluorescence | Total activity |
|---|---|---|---|
| pmol Fe3+ reduced/min/fluor unit | pmol Fe3+ reduced/min | ||
| Lysate | 2.8 | 2,460 | 6,900 |
| Ultracentrifugation supernatant | 0 | 400 | 0 |
| Crude membranes | 2.3 | 2,080 | 4,780 |
| Crude membranes + TX-100 | 4.6 | 2,060 | 9,470 |
| Insoluble membranes | 1.4 | 1,510 | 2,110 |
| Solubilized membranes | 1.8 | 660 | 2,440 |
FAD Is the Preferred Flavin for Steap3
As described above, Steap3 detergent-activated membranes exhibit NADPH- and FAD-dependent ferric reductase activity. Importantly, however, the addition of other exogenous flavins, specifically FMN and riboflavin, did not contribute to increased ferric reductase activity above that seen for detergent-activated membranes in the absence of exogenous flavin (Fig. 1). This strongly suggests that full-length Steap3 does not utilize FMN or riboflavin as a substrate and that FAD is the physiologically relevant flavin.
Steap3 Is a b-type Cytochrome
δ-Aminolevulinic acid (ALA) is a protoporphyrin precursor that is generated in vivo by δ-aminolevulinic acid synthase, the rate-limiting reaction in heme biosynthesis. ALA supplementation has thus been utilized in a variety of expression systems to improve heme incorporation in exogenously expressed hemoproteins (15, 16). We found that supplementation with 0.5 μm ALA resulted in greater than a 2-fold increase in the difference spectrum Soret band at 429 nm in Steap3-containing membranes and an ∼80% increase in membrane ferric reductase activity. Furthermore, the reduced-minus-oxidized difference spectra obtained for Triton X-100-treated membranes of wild-type Steap3-expressing cells indicate α, β, and γ Soret peaks at 560, 531, and 428 nm, respectively (Fig. 2A), indicative of the binding of a b-type heme cofactor.
FIGURE 2.
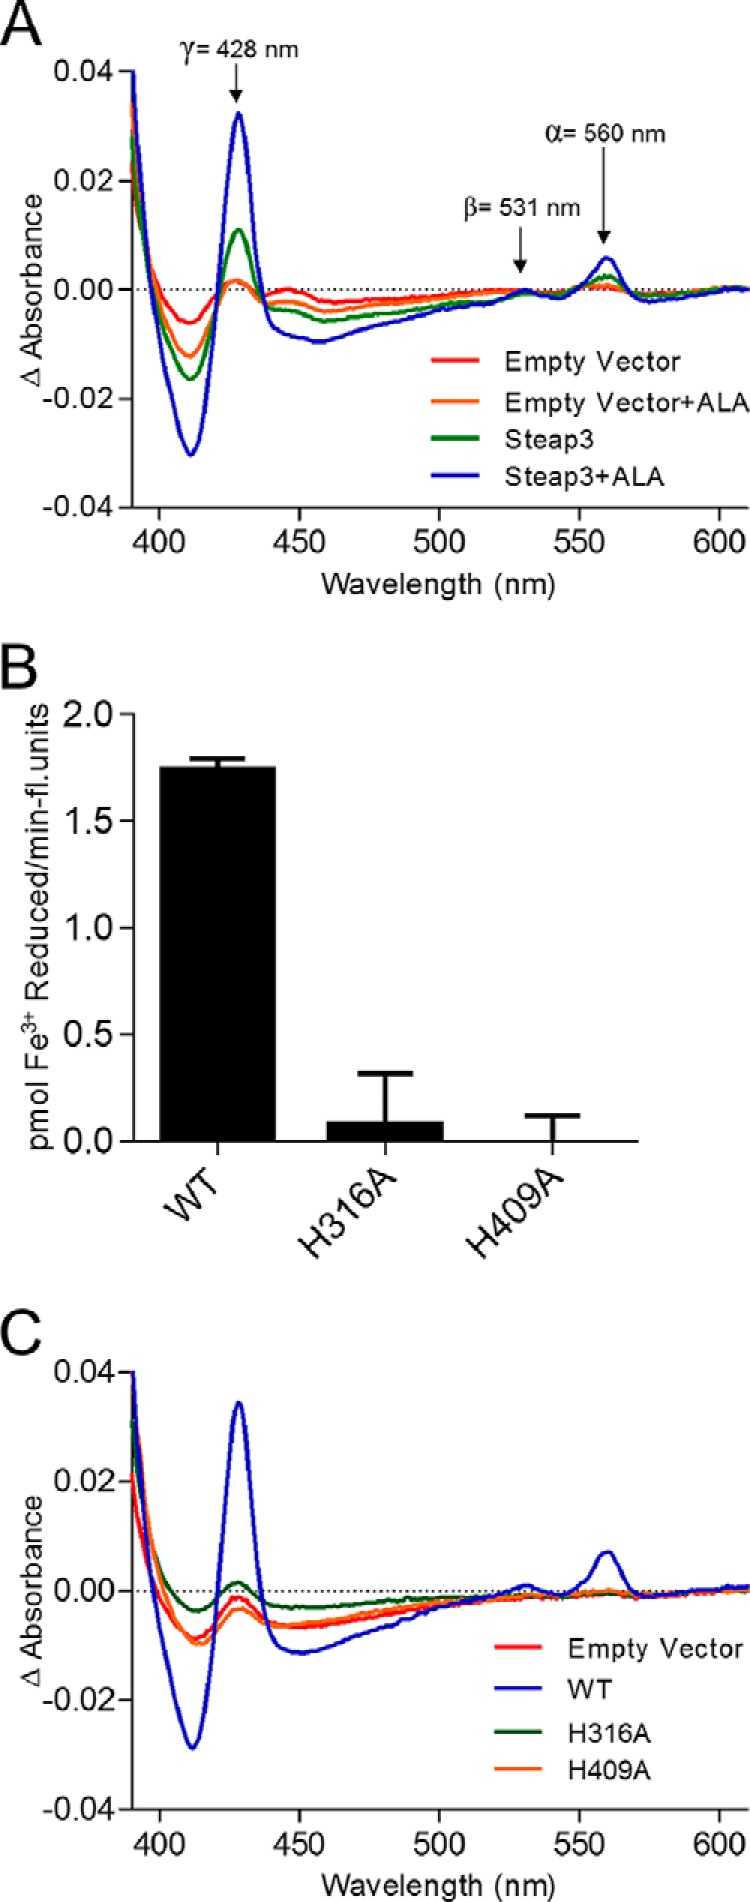
Steap3 transmembrane domain binds a single b-type heme with coordination through His-316 and His-409. A, the reduced-minus-oxidized difference spectra for Triton X-100-activated membranes of HEK-293 cells transfected with either empty vector or Steap3.Venus plus or minus supplementation of transfection medium with 0.5 μm ALA. Supplementation with ALA resulted in a significant increase in heme incorporation, allowing detection of α, β, and γ Soret peaks that are indicative of a b-type heme. B, the strictly conserved histidine residues His-316 and His-409 are also each strictly required for ferric reductase activity as mutation of either to alanine results in an inactive construct. Error bars represent S.D. Fluorescence per total protein indicated that expression levels were similar (0.52, 0.47, and 0.46 fluorescence (fl.) units/μg of protein for wild type and H319A and H409A mutants, respectively). C, the reduced-minus-oxidized difference spectra of each histidine mutant reveal a complete deficiency in Steap3-specific heme incorporation. This strongly suggests that Steap3 utilizes only a single heme cofactor in the transmembrane domain.
Steap3 Contains a Single b-type Heme Cofactor
Sequence homology predicted that Steap3 utilizes bishistidine coordination via His-316 and His-409 to bind a heme cofactor in the transmembrane domain (2). However, other model systems for transmembrane ferric reduction, including yeast Fre1, mammalian duodenal cytochrome b, and mammalian NADPH oxidase, all utilize two heme groups to move electrons across the membrane. Thus, it has not been clear whether a second, cryptic heme binding site is present in Steap family proteins or whether Steap family metalloreductases differ significantly from these other systems in utilizing a single heme cofactor. For this reason, we utilized site-directed mutagenesis to reexamine heme incorporation in the H316A and H409A variant proteins. As expected and consistent with previous work by Ohgami et al. (2), mutating either conserved histidine to alanine resulted in complete loss of ferric reductase activity (Fig. 2B). More interesting, however, the Steap3-specific heme signal was completely eliminated in each of these histidine variants (Fig. 2C). This strongly suggests that Steap family metalloreductases utilize only a single heme cofactor to shuttle electrons across the transmembrane domain and that mechanistically they are fundamentally different from yeast Fre1 and mammalian proteins duodenal cytochrome b and NADPH oxidase.
Steap3 Forms an Active Homodimer
The isolated Steap3 N-terminal oxidoreductase domain has been reported to dimerize at low millimolar concentrations in solution and in the crystal, suggesting that full-length Steap3 may function as a homodimer in cellular membranes (10). However, a co-precipitation experiment utilizing FLAG-tagged Steap3 as bait and StrepII-tagged Steap3 as prey with Strep-tactin affinity resin did not produce evidence of an interaction (data not shown). Thus, dimerization may be transient or incompatible with co-precipitation conditions. To characterize a potential homodimer in vivo, a BiFC assay, which enables visualization of protein interactions in their natural cellular environment, was performed (17, 18). In the BiFC assay, proteins of interest are tagged with two complimentary fragments of a split fluorescent protein. If the proteins interact, the non-fluorescent fragments are brought together, which in turn facilitates folding and “maturation” of an active protein and results in a fluorescent readout. For the Steap3 BiFC assay, HEK-293 cells were co-transfected with Steap3 fused to N-terminal (Steap3.VN173) and C-terminal (Steap3.VC155) fragments of Venus. Transfected cells visualized at Venus emission wavelengths exhibited a distribution of cellular fluorescence similar to that seen in cells transfected with Steap3 fused to full-length Venus (Fig. 3). This strongly suggests that a Steap3 oligomer does indeed form in vivo.
FIGURE 3.

Steap3 forms homodimers in the BiFC assay. HEK-293F cells were transfected with Steap3.Venus or co-transfected with the BiFC pair (Steap3.VN173 (C-terminal fusion of residues 1–173 of Venus) and Steap3.VC155 (C-terminal fusion of residues 155–238 of Venus)). In addition, membranes were stained with wheat germ agglutinin-Alexa Fluor 633 conjugate (WGA; red), and nuclei were stained with DAPI (blue). Single confocal Z-sections are shown for Steap3.Venus (top row, green) and the BiFC pair (bottom row, green) and indicate formation of an active BiFC pair, thus suggesting the presence of a Steap3 homodimer. Furthermore, the subcellular distribution of Steap3.Venus (top row) resembles that of the BiFC pair (bottom row) and is also consistent with previous microscopy studies of Steap3 (2, 30). White scale bars indicate 10 μm. Negative controls using cells transfected with either Steap3.VN173 or Steap3.VC155 alone did not exhibit a fluorescence signal (not shown).
We also wished to analyze the ferric reductase activity of the BiFC dimer; thus the Steap3.VN173 and Steap3.VC155 fusions were cloned into the pIRES dual expression vector (pIRES.Steap3VN.Steap3VC). This ensured the presence of both constructs in each transfected cell. Using this dual expression vector, we found that the specific activity of the BiFC pair was 9.9 pmol of Fe3+ reduced/min/fluorescence unit, which is actually greater than the specific activity of cells transfected with Steap3.Venus. The increased specific activity was due primarily to decreased fluorescence, which is expected due to the presence of, at most, a single mature Venus per Steap3 dimer. Interestingly, it is believed that once the split fluorescent protein has matured, it remains stable, and the N- and C-terminal fragments do not dissociate, leading to a constitutive oligomer (17, 18). Thus, not only is Steap3 able to form homodimers in the relevant cellular compartments but it is also enzymatically active in the dimeric state.
Steap3 Electron Transfer Follows an Intrasubunit Pathway
Steap3 is composed of two linked domains: the transmembrane domain and a cytoplasmic oxidoreductase domain. Upon dimerization, protomers may thus be capable of performing intersubunit electron transfer wherein the oxidoreductase domain of one protomer transfers electrons to the transmembrane domain of the other (Fig. 4A). To examine the possibility of such “domain swapping,” cells were again transfected with the BiFC dual expression vector containing two Steap3 genes (pIRES.Steap3VN.Steap3VC). In this case, the two Steap3 constructs were either both wild type or contained two different Steap3 variants that inactivated either the N- or C-terminal domain, respectively (Fig. 4B). Specifically, one variant contained an inactivated oxidoreductase domain (S58I; defective for NADPH binding), and the other contained an inactivated transmembrane domain (H409A; heme-deficient variant) (2). The ferric reductase activity in cells expressing the wild-type pair and the mutant pair were then tested. In the case of intrasubunit electron transfer, lesions in the electron transfer pathway in each subunit of the heterodimer should result in the ablation of all activity (Fig. 4B, left). In contrast, for intersubunit electron transfer, one path is expected to suffer from lesions in both the oxidoreductase and transmembrane domains, whereas the second pathway would be expected to utilize the functional oxidoreductase domain from one subunit and the functional transmembrane domain of the second, resulting in measurable activity (Fig. 4B, right). However, although activity was observed for the wild-type Steap3 pair, the variant pair did not exhibit ferric reductase activity above that of the empty vector controls (Fig. 4C). This suggests that Steap3 does not form a domain-swapped dimer and that Steap3 utilizes an intrasubunit rather than intersubunit electron transfer pathway.
FIGURE 4.
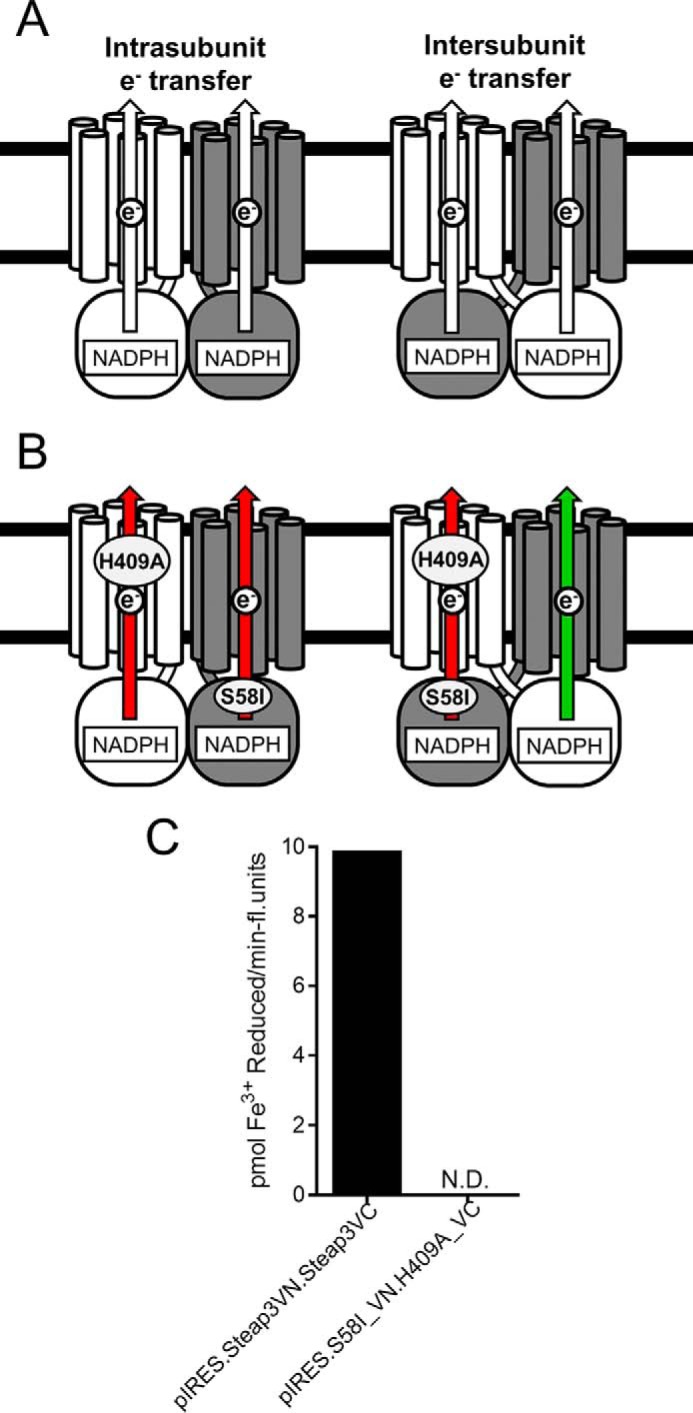
Investigating Steap3 electron transfer pathway. A, a Steap3 dimer could potentially transfer electrons in an intra- or intersubunit manner. In intrasubunit electron transfer (A, left side), electrons from the NADPH-binding oxidoreductase domain would be transferred to the subunit's own transmembrane domain. In intersubunit electron transfer (A, right side), a domain-swapped dimer would result in the electrons from one oxidoreductase domain transferred to the transmembrane domain of the other subunit. B, to differentiate between these two alternatives, mutations were introduced to inactivate the cytoplasmic NADPH oxidase domain of one subunit (S58I.VN173) and the transmembrane domain of the other subunit (H409A.VC155). Cells were transfected with a dual expression vector containing the S58I.VN173 and H409A.VC155 constructs (pIRES.S58I_VN.H409A.VC). If the Steap3 dimer undergoes intrasubunit electron transfer, the mutational lesions in the respective subunits would prohibit electron transfer in both subunits (red arrow). In intersubunit electron transfer, the BiFC heterodimers would complement one another, restoring one of the two electron transfer pathways (green arrow). Thus, the presence of an intersubunit electron transfer pathway would be indicated by the partial restoration of ferric reductase activity. C, in contrast to cells expressing the wild-type BiFC pair (pIRES.Steap3VN.Steap3VC), ferric reductase activity was not detectable (N.D.; limit of detection, 0.4 pmol of Fe3+ reduced/min/fluorescence unit) in cells expressing the mutant BiFC pair (pIRES.S58I_VN.H409A_VC). Expression levels were not significantly altered in the mutant BiFC pair (0.13 fluorescence unit/μg of protein) from the wild-type pair (0.14 fluorescence unit/μg of protein); thus the lack of activity was not due to loss of stable protein expression. The lack of complementation indicates an intrasubunit electron transfer pathway as illustrated in B (left side).
FAD Binding Site
The identification and characterization of a flavin binding site for any full-length Steap family member has not been reported, and the development of the enzymatic assay described above is the first indication that FAD is the preferred flavin for Steap3 (Fig. 1). To this end, we measured Fe3+ reductase activity as a function of FAD concentration. When fit to the Michaelis-Menten model (Fig. 5), we found a Km of 0.9 μm for FAD, indicating the presence of a physiologically relevant FAD binding site. Relative to the isolated N-terminal oxidoreductase domain, the Km value for full-length Steap3 is lower by more than 2 orders of magnitude, indicating that the transmembrane domain plays a critical role in the recognition of FAD.
FIGURE 5.
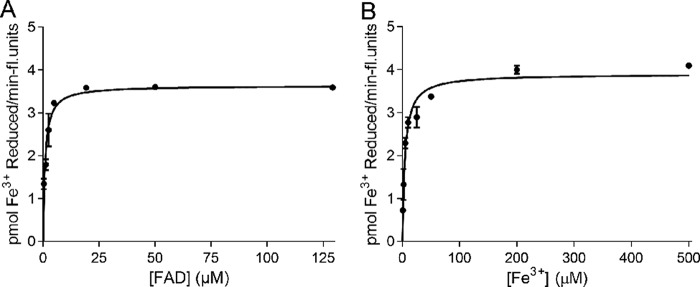
Enzyme kinetics of Steap3 in detergent-activated membranes with FAD and Fe3+ substrates. FAD (A) and Fe3+-NTA (B) kinetics curves were generated from a nonlinear regression analysis with the Michaelis-Menten equation in GraphPad Prism 5.0. Error bars represent the S.E. from at least two measurements. Kinetic values in Tables 3 and 4 resulted from the mean of at least three independent experiments. fl., fluorescence.
Multiple sequence alignments are frequently used to identify residues critical to protein function. For Steap3, specifically, the utility of this approach can be assessed by mapping strictly conserved residues to the surface of the Steap3 oxidoreductase domain for which crystal structures have been determined (10). Toward this goal, the NCBI non-redundant protein sequence database was utilized to obtain a total of 461 Steap2, Steap3, and Steap4 sequences (Steap1 lacks the oxidoreductase domain), which were then aligned with Clustal Omega (19). We found that 10 residues in the oxidoreductase domain are strictly conserved, seven of which are surface-exposed. Importantly, five of the seven are found in the NADPH binding pocket of the Steap3 crystal structure (Fig. 6A). Thus, Steap family sequence alignments are able to discriminate residues involved in substrate recognition.
FIGURE 6.
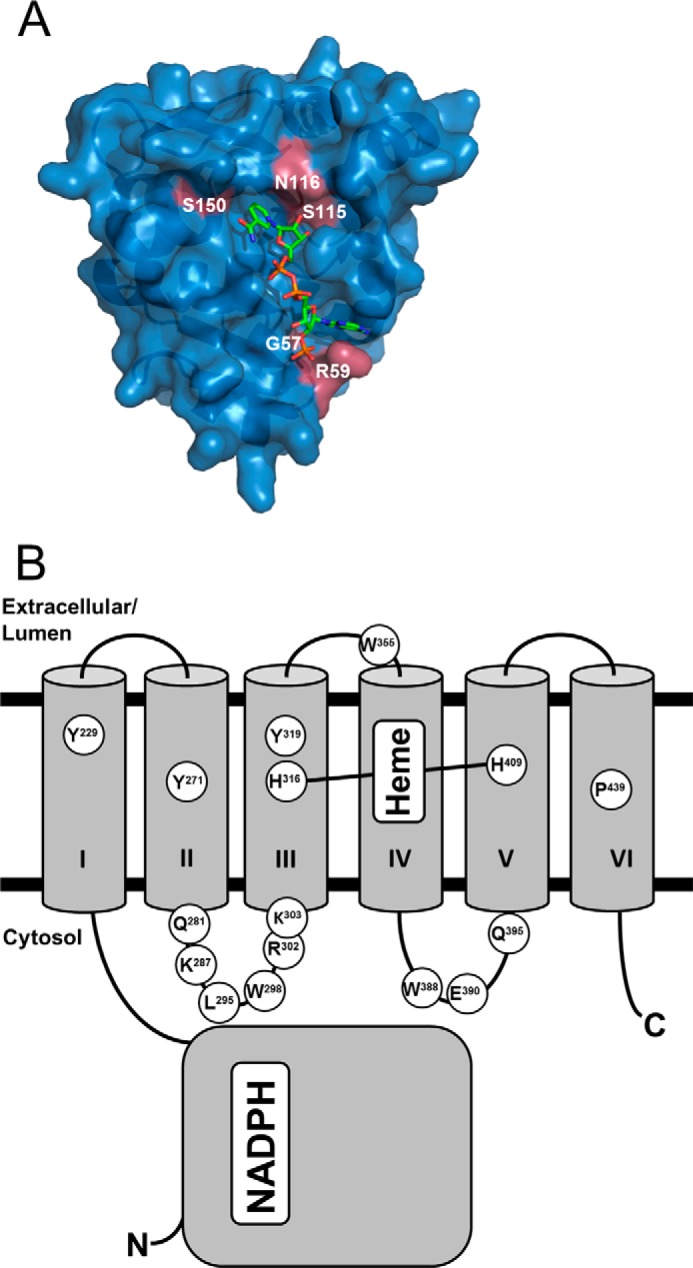
Amino acid conservation of Steap family oxidoreductase and transmembrane domains. Amino acid sequences from Steap family members in the NCBI non-redundant database were aligned with Clustal Omega (19). A, strictly conserved residues (magenta) from all Steap2, Steap3, and Steap4 sequences are mapped on the surface of the crystal structure forthe Steap3 oxidoreductase domain (Protein Data Bank code 2VQ3 (10)). The NADPH binding site includes five of the 10 strictly conserved residues in the oxidoreductase domain. B, a second alignment with all Steap1–4 sequences was generated to identify putative ligand binding site residues in the transmembrane domain. Transmembrane α-helices are numbered by roman numerals. The topology prediction program TopPred (20) was used to predict approximate locations for strictly conserved residues in the Steap3 transmembrane domain. Heme coordination by His-316 and His-409 is represented by a connecting line. Tyr-319 is not strictly conserved (>98%) but was targeted for mutagenesis studies because of conservation in earlier sequence alignments (11) and its proximity to His-316.
We then undertook a similar analysis but with the inclusion of Steap1 sequences to identify potential FAD binding siteresidues in the transmembrane domain. 607 Steap family sequences were aligned, and strictly conserved amino acids were assigned approximate positions within the membrane bilayer as predicted by the membrane topology program TopPred (Fig. 6B and supplemental Fig. 1 and a list showing Steap family alignment species) (20). Of the 15 strictly conserved residues in the transmembrane domain, nine are predicted to lie on cytoplasmic loops between transmembrane helices II and III (the αII/III loop) or helices IV and V (the αIV/V loop). As these residues lie in between the N-terminal oxidoreductase domain and histidine residues implicated in heme binding, we considered these as potential residues involved in recognition of FAD.
The nine strictly conserved residues in the αII/III and αIV/V loops of the transmembrane domain were individually mutated to alanine, and the kinetic parameters for FAD-dependent ferric reductase activity were determined (Table 3). With an increase in the Km from the wild-type value of 0.9 to 17.7 μm, the E395A variant showed the most significant decrease in affinity for FAD; however, the Vmax was essentially unchanged. Although not as large, we also found a significant increase (p < 0.05) in the FAD Km value for the E390A variant (Km = 4.5 μm), which is also in the αIV/V loop. Because the hallmark of residues involved predominately in substrate recognition is an increase in Km with little or no change in Vmax, these data strongly implicate Glu-390, Gln-395, and the αIV/V loop in formation of the FAD binding site.
TABLE 3.
FAD kinetic characterization of Steap3 Fe3+ reductase activity
The transmembrane topology prediction was generated by the TopPred program (20). Fluorescence (Fluor unit) per microgram of protein is represented to indicate approximate expression levels of the respective construct. Values are represented as mean ± S.D. with means from n ≥ 3 independent experiments. ND, not determinable (limit of detection = 0.4 pmol of Fe3+ reduced/min/fluorescence (fluor) unit).
| Variant | Topology prediction of mutant | Vmax | Km | Vmax/Km | Fluor unit/μg protein |
|---|---|---|---|---|---|
| pmol Fe3+/min/fluor unit | μm FAD | ||||
| Wild type | 3.7 ± 1.9 | 0.9 ± 0.4 | 4.4 ± 2.5 | 0.47 ± 0.13 | |
| Q281A | αII-αIII loop | ND | ND | 0.48 ± 0.12 | |
| K287A | αII-αIII loop | ND | ND | 0.40 ± 0.19 | |
| L295A | αII-αIII loop | ND | ND | 0.35 ± 0.18 | |
| W298A | αII-αIII loop | 2.8 ± 0.3 | 2.2 ± 0.4 | 1.3 ± 0.3a | 0.52 ± 0.05 |
| R302A | αII-αIII loop | 1.4 ± 0.8 | 2.8 ± 1.4 | 0.6 ± 0.4a | 0.35 ± 0.19 |
| R302E | αII-αIII loop | ND | ND | 0.56 ± 0.09 | |
| K303A | αII-αIII loop | 2.5 ± 1.2 | 2.8 ± 0.6 | 0.9 ± 0.4a | 0.54 ± 0.10 |
| K303E | αII-αIII loop | 2.7 ± 1.7 | 4.6 ± 2.9a | 0.6 ± 0.4a | 0.50 ± 0.18 |
| R302A/K303A | αII-αIII loop | 1.4 ± 0.9 | 4.0 ± 2.2a | 0.5 ± 0.5a | 0.50 ± 0.13 |
| W388A | αIV-αV loop | 2.3 ± 1.5 | 3.0 ± 0.6 | 0.7 ± 0.4a | 0.56 ± 0.07 |
| E390A | αIV-αV loop | 3.0 ± 1.2 | 4.5 ± 1.0a | 0.6 ± 0.1a | 0.55 ± 0.07 |
| Q395A | αIV-αV loop | 4.4 ± 1.8 | 18 ± 4.4a | 0.3 ± 0.2a | 0.52 ± 0.10 |
a Statistically significant differences (p < 0.05) versus wild type from one-way analysis of variance and Dunnett's multiple comparison test.
The exact role of residues in the αII/III loop was more difficult to assess. Simple alanine substitution for Gln-281, Lys-287, and Leu-295 all resulted in complete loss of activity. It is not clear whether this was because the variants were unable to bind FAD or because these are instead key catalytic or structural residues. However, it does clearly indicate a critical role for the αII/III loop. However, measurable activity was found for the W298A, R302A, and K303A variants, and in each case, we did find increased Km values for FAD. However, compared with wild type, the differences were not statistically significant (p > 0.05). We thus considered the possibility that Arg-302 and Lys-303 might utilize their positive charge to interact with negative charge on FAD and that negatively charged substitutions might interfere with such interactions. Indeed, the K303E variant gave a significantly increased Km (4.6 μm) with a minimally disturbed Vmax. The R302E mutation however, showed a complete loss of activity, confounding interpretation of the results. Finally, we also investigated the R302A/K303A double mutant and found a slightly increased Km relative to each individual alanine mutant indicative of an additive effect for these residues. More importantly, the double mutant also showed a statistically significant increase in Km (4.0 μm) over wild-type Steap3. Collectively, our mutational analysis thus also implicates Arg-302, Lys-303, and the αII/III loop in general in FAD binding. In conjunction with previous work on the Steap4 oxidoreductase domain demonstrating the lack of a high affinity flavin binding site in the oxidoreductase domain, we conclude that major elements of the high affinity FAD binding site lie in the transmembrane domain of Steap3 and that conserved residues within the αII/III and αIV/V loops are of particular importance.
Fe3+ Binding Site of Steap3
Ferric and cupric reductase activities have been reported for Steap2, Steap3, and Steap4 (2, 3). More recently, the first determination of Km values for any Steap family member for Fe3+ and Cu2+ was reported for rat Steap4 using the cell surface metalloreductase assay (11). Collectively, this work suggested that Steap proteins contain high affinity binding sites for both Fe3+ and Cu2+ and that Steap family members are likely to be physiologically relevant cupric and ferric reductases involved in homeostasis of these metals. However, to date, metal Km values have not been reported for Steap3. For this reason, using Fe3+-NTA as the substrate, we determined that the Km for Fe3+ was 5.0 μm (Fig. 5 and Table 4), which is nearly identical to that found for Steap4 using the cell surface assay. Unfortunately, Cu2+ was spontaneously reduced to Cu1+ under these assay conditions due to the presence of NADPH, precluding measurement of a Km value for Cu2+.
TABLE 4.
Fe3+ kinetic characterization of Steap3 Fe3+ reductase activity
Fluorescence per microgram of protein is represented to indicate approximate expression levels of the respective constructs. Values are represented as mean ± S.D. with means from n ≥ 3 independent experiments. ND, not determinable (limit of detection = 0.4 pmol of Fe3+ reduced/min/fluorescence unit).
| Variant | Vmax | Km | Vmax/Km | Fluor. units/μg protein |
|---|---|---|---|---|
| pmol Fe3+/min/fluor unit | μm Fe3+ | |||
| Wild type | 3.0 ± 1.6 | 5.0 ± 1.4 | 0.60 | 0.54 ± 0.19 |
| Y229A | 2.7 ± 2.0 | 12 ± 3.9a | 0.21 | 0.39 ± 0.30 |
| Y229F | 1.9 ± 1.2 | 15 ± 2.9a | 0.13a | 0.42 ± 0.08 |
| Y271A | ND | ND | 0.50 ± 0.13 | |
| Y271F | 2.6 ± 0.4 | 5.7 ± 0.2 | 0.45 | 0.57 ± 0.10 |
| Y319A | 3.5 ± 1.3 | 9.9 ± 1.6 | 0.35 | 0.40 ± 0.17 |
| Y319F | 2.7 ± 0.7 | 18 ± 4.5* | 0.15a | 0.52 ± 0.10 |
| Y229F/Y319F | 1.7 ± 0.7 | 24 ± 2.8a | 0.07a | 0.49 ± 0.05 |
a Statistically significant differences (p < 0.05) versus wild type from one-way analysis of variance and Dunnett's multiple comparison test.
Specific residues involved in metal recognition have not been reported for any member of the Steap family. However, our success in identifying residues involved in FAD recognition suggested that conserved residues in the luminal or extracellular half of the transmembrane domain, i.e. residues above the heme-coordinating histidines in Fig. 6B, might participate in iron recognition. Two strictly conserved residues, Tyr-229 and Trp-355, are predicted by TopPred to lie on the extracellular/luminal side of the heme-coordinating histidine residues (Fig. 5B). Because of its non-polar side chain, Trp-355 was not chosen for mutation. In addition, a third residue, Tyr-319, was also selected for mutation because of its high degree of conservation (>98%) and proximity to the heme cofactor. Specifically, Tyr-319 is predicted to lie approximately one helical turn nearer to the luminal face than the heme-binding His-316 and could thus be well positioned to participate in iron binding and reduction. Indeed, when these tyrosine residues were individually mutated to alanine or phenylalanine, impaired iron reduction was observed. For the conservative Y319F substitution, the Km for Fe3+ increased by more than 3-fold from 5 to 17 μm, whereas Vmax was essentially unchanged. Similarly, the Y229F variant showed an inflated Km of 15 μm, suggesting that each of these residues play significant roles in recognition of Fe3+. The double mutation Y229F/Y319F was also examined, and the Km increased to 24 μm with only an insignificantly small decrease in Vmax.
Tyr-271, also strictly conserved, is predicted to lie near the midpoint of the bilayer in helix αIII (Fig. 5B). This location seemed inconsistent with a residue involved in iron recognition. Nevertheless, we considered the possibility that its location could be mispredicted or that its side chain might reach up toward the iron binding site. However, when mutated to phenylalanine, no effect was seen on ferric reductase kinetics, whereas mutation to alanine resulted in complete loss of activity (Table 4). With no indication of a role in iron binding, the phenyl ring of Tyr-271 serves an as yet undefined structural or functional role in transmembrane electron transfer.
Although additional residues are likely to participate in iron binding and reduction, the characterization of these conserved tyrosine residues provides significant insight into the location and nature of the iron binding site. First, the location of Tyr-319 approximately one helical turn past heme-coordinating His-316 suggests that the iron biding site lies near the “top” edge of the heme cofactor in the transmembrane domain. Second, it suggests that the topological arrangement of the transmembrane helices will bring Tyr-229 and Tyr-319 in close proximity to each other, allowing them to work in concert to form a recessed iron binding site adjacent to the heme.
Discussion
Steap1 Shares the Steap Family FAD and Iron Binding Motifs
Steap1 is highly expressed in multiple cancers and has received interest as an immunotherapeutic target (21, 22). However, Steap1 lacks the N-terminal oxidoreductase domain found in Steap2, Steap3, and Steap4 and instead substitutes a 70-residue N-terminal tail. In addition, attempts to demonstrate Steap1 ferric or cupric reductase activities have been unsuccessful (3). Thus, it has been unclear whether Steap1 is a functional transmembrane oxidoreductase. However, because the FAD and iron binding motifs that we have identified here in Steap3 are also present in Steap1, it seems that Steap1 might indeed harbor latent transmembrane oxidoreductase activity. If so, this would obviously require a cytosolic source of FAD(H2). In addition, it remains possible that Steap1 might oxidize or reduce an alternative extracellular or luminal substrate.
Steap3 Homodimer
In conjunction with the crystallographic structures of the isolated oxidoreductase domains of Steap3 and Steap4, the BiFC study presented here suggests that Steap3 is indeed active as a homodimer. One potential explanation for dimer formation was that Steap3 might utilize an intersubunit electron transfer pathway through a domain-swapped dimer. However, the inability of the S58I and H409A mutants to complement each other suggests otherwise. Thus, the functional or regulatory significance of the homodimer remains unclear. However, it is possible that Steap3 may function within a larger complex with the 2-fold symmetric transferrin receptor (23). A Steap3 dimer and its cargo of four electrons is stoichiometrically matched to the transferrin-transferrin receptor complex that carries four iron atoms (10). In addition to specifying the correct stoichiometry between endosomal Fe3+ and cytosolic NADPH, a transferrin receptor-Steap3 complex might also ensure recruitment of Steap3 into iron-laden endosomes (10).
Steap3 Transmembrane Domain Binds a Single, b-type Heme
Ohgami et al. (2) proposed a model for iron reduction by Steap3 in which a heme cofactor acts as a key intermediary in the transfers of electrons from NADPH and flavin bound in the N-terminal oxidoreductase domain to iron bound at the extracellular or luminal face of the transmembrane domain. Here we confirm their prediction that Steap3 binds a single heme in a bishistidine fashion (His-316 and His-409) and show that it is a b-type heme. These histidine residues lie in transmembrane helices 3 and 5 with predicted locations slightly above the center of the bilayer toward the extracellular or luminal space (Fig. 7). These residues are a core feature of the FRD superfamily, which includes such members as yeast ferric reductase (Fre1) and human NADPH oxidase (9). However, in contrast to a single transmembrane heme in the Steap proteins, other members of the FRD superfamily contain a second heme cofactor localized near the cytoplasmic face of the membrane (9). In this context, the transmembrane domain of Steap family proteins appears unique. In fact, to our knowledge, there exists no functional evidence for monoheme cytochromes that perform transmembrane electron transport beyond the Steap family metalloreductases and their bacterial YedZ homologs (24) for which sulfite oxidase activity has been demonstrated (25).
FIGURE 7.
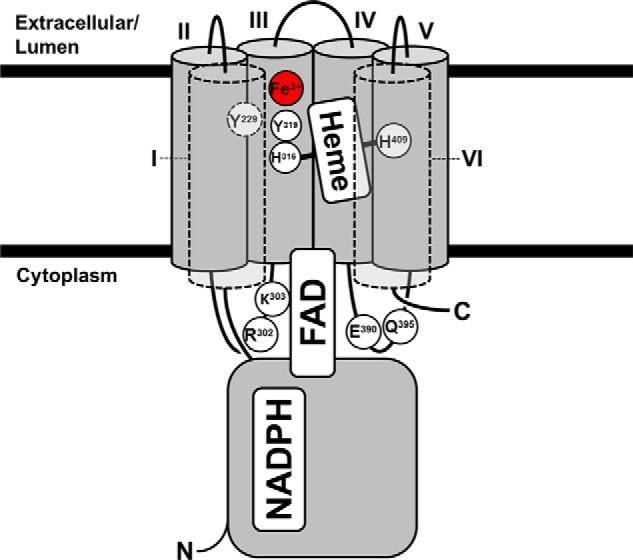
Structural model of the Steap3 transmembrane domain. Strictly conserved residues key to Fe3+, heme, or FAD binding are shown. Residues are oriented based on predictions by the TopPred topology server (20). The electron source, NADPH, is oriented approximately according to that found in the Steap3 oxidoreductase domain crystal structure with “H” representing the hydride-containing nicotinamide moiety. The hydride is transferred to FAD, which is bound by the αII/III and the αIV/V loops, including interactions with strictly conserved residues Arg-302, Lys-303, Glu-390, and Gln-395. Single electrons are transferred to a single b-type heme bound in a bishistidine fashion via His-316 and His-409. Tyr-229 and Tyr-319 are implicated in binding an Fe3+ atom adjacent to the heme cofactor. Foreground segments are represented by dashed boundaries, and Tyr-229 is positioned on the backside of helix I in close proximity to Tyr-319 and Fe3+. Transmembrane α-helices are numbered by roman numerals. The transmembrane helices have been split open for purposes of illustration to reveal the interior heme- and metal-binding residues. However, by analogy to other transmembrane cytochromes, we expect helices I and VI to contact each other such that the helices completely encircle the heme cofactor.
Steap3 Iron-binding Residues Adjacent to the Heme Cofactor
In our mutational analysis, Tyr-229 and Tyr-319 were found to participate in iron binding. Tyr-229 is predicted to reside in the first transmembrane helix at approximately the same “height” as Tyr-319, which is located one α-helical turn above His-316 (Fig. 7). The Tyr-319 side chain is thus expected to lie near the top of the porphyrin ring. This in turn suggests that the iron binding site is also near the top edge of the heme cofactor as opposed to a more distant site composed of extracellular loops. This raises the possibility that one or perhaps both of the propionate arms of the heme cofactor might serve to coordinate iron in a manner similar to manganese coordination observed in manganese peroxidase (26). This would require the heme to be oriented with the propionate arms pointed toward the extracellular space. Such an orientation is indeed observed in structures of integral membrane cytochromes such as the ascorbate-dependent ferric reductase duodenal cytochrome b (27) and the cytochrome b subunit of the bc complex (28).
The Transmembrane Domain Contains a High Affinity FAD Binding Site
We have shown for the first time that Steap family proteins do indeed utilize a flavin in the reduction of Fe3+. In addition, we found that Steap3 exhibits a clear preference for FAD as the addition of exogenous FMN or riboflavin did not increase activity above the flavin-free control. This suggests that the activity in the flavin-free control is due to low levels of endogenous FAD present in the membrane preparations.
We measured a Km for FAD in full-length Steap3 of ∼1 μm, which is greater than 2 orders of magnitude lower than the non-physiological flavin Km values (>100 μm) measured for the isolated N-terminal oxidoreductase domains of Steap3 and Steap4 (11). Indeed, the structural and kinetic work on these isolated domains previously suggested that the N-terminal oxidoreductase has only a weak interaction with FAD and other flavins and that this low affinity recognition is primarily via the isoalloxazine ring. We now conclude that the elements necessary for high affinity FAD binding reside primarily within the Steap transmembrane domain.
The αII/III and αIV/V Loops Form the FAD Binding Site
Among the 15 strictly conserved residues in the transmembrane domain (Fig. 6B), nine are predicted to lie within loops connecting helix II to helix III and helix IV to helix V. Our mutational analysis clearly shows that these loops are critical for Steap3 activity where they contribute to FAD binding. Thus, although these loops are distant within the linear sequence, they are expected to lie close to each other in the folded protein structure, working together to bind FAD (Fig. 7). Interestingly, the αII/III loop also contains the endosomal targeting motif for AP-2 (Y288XXΦ where Φ is bulky hydrophobic Phe-291) (29). Whether AP-2 might alter the activity of Steap3 during clathrin-mediated endocytosis remains an open question.
The Transmembrane Domain FAD Binding Site Replaces the Cytoplasmic Facing Heme
As shown above, Steap proteins contain an extracellular or luminal facing heme that is common to all members of the FRD superfamily (9) but appear to lack the second cytoplasmic facing heme. Interestingly, a bioinformatics analysis of the FRD superfamily shows that YedZ and Steap family proteins are differentiated from other members of the FRD superfamily by replacement of the histidine residues coordinating a cytoplasmic facing heme with conserved arginine and glutamine residues. Importantly, in Steap3, the arginine and glutamine residues in this superfamily sequence alignment correspond to Arg-302 and Gln-395. Here we have shown that these residues contribute to the FAD binding pocket in the transmembrane domain (Table 3). Thus, the Steap and YedZ family proteins have apparently lost their cytoplasmic facing heme binding site and replaced it with a cytoplasmic facing FAD binding site.
Predicted Structure for the Transmembrane Domain
The recently solved crystal structure of duodenal cytochrome b reveals an FRD-like structure in which the cytoplasmic and extracellular facing hemes are surrounded by six transmembrane helices (27). Interestingly, the helices follow one another in succession as they work their way around the heme cofactors. If a similar helical arrangement is considered for the transmembrane domain of Steap3 (Fig. 7), several observations consistent with the biochemical data can be made. First, the arrangement results in placement of the heme-coordinating histidine residues on opposite sides of the heme cofactor. Second, it brings the αII/III loop in close proximity to the αIV/V loop so they might collectively work to bind FAD. Third, it could bring the tyrosine residues implicated in iron binding (Tyr-229 and Tyr-319) into close proximity. For these reasons, we propose the structure shown in Fig. 7 for the Steap3 transmembrane domain as it is consistent with the structures of integral membrane cytochromes in general and with the unique structural and biochemical properties of the Steap family that we have elucidated here, namely utilization of a single b-type heme and the location of the iron and FAD binding sites. Furthermore, it is expected that the structure of this transmembrane electron transfer domain is shared by all Steap family members, including Steap1, and the related YedZ family of bacterial proteins.
Author Contributions
M. D. K. was responsible for the bulk of the data acquisition. M. D. made the Gateway vectors and helped revise the manuscript. M. D. K. and C. M. L. conceived and coordinated the study and wrote and revised the paper.
Supplementary Material
Acknowledgments
We are deeply grateful to Mark D. Fleming for valuable insight and careful reading of the manuscript. We thank Chang-Deng Hu (Purdue University) for providing Venus plasmids that were used for making Gateway vectors. The Montana State University confocal microscope was purchased with funding from the National Science Foundation Major Research Instrumentation Program and the M. J. Murdock Charitable Trust. We also thank Jan Phillipp Kreysing for gracious help in producing Fig. 6.
This work was supported, in whole or in part, by National Institutes of Health Grant RO1 GM084326 (to C. M. L. and M. D. F.). The authors declare that they have no conflicts of interest with the contents of this article.

This article contains supplemental Fig. 1 and a list showing Steap family alignment species.
- Steap
- six-transmembrane antigen of the prostate
- ALA
- δ-aminolevulinic acid
- BiFC
- bimolecular fluorescence complementation
- F420
- 8-hydroxy-5-deazaflavin
- FRD
- ferric reductase domain
- NTA
- nitrilotriacetic acid.
References
- 1. Hentze M. W., Muckenthaler M. U., Andrews N. C. (2004) Balancing acts: molecular control of mammalian iron metabolism. Cell 117, 285–297 [DOI] [PubMed] [Google Scholar]
- 2. Ohgami R. S., Campagna D. R., Greer E. L., Antiochos B., McDonald A., Chen J., Sharp J. J., Fujiwara Y., Barker J. E., Fleming M. D. (2005) Identification of a ferrireductase required for efficient transferrin-dependent iron uptake in erythroid cells. Nat. Genet. 37, 1264–1269 [DOI] [PMC free article] [PubMed] [Google Scholar]
- 3. Ohgami R. S., Campagna D. R., McDonald A., Fleming M. D. (2006) The Steap proteins are metalloreductases. Blood 108, 1388–1394 [DOI] [PMC free article] [PubMed] [Google Scholar]
- 4. Ohgami R. S., Campagna D. R., Antiochos B., Wood E. B., Sharp J. J., Barker J. E., Fleming M. D. (2005) nm1054: a spontaneous, recessive, hypochromic, microcytic anemia mutation in the mouse. Blood 106, 3625–3631 [DOI] [PMC free article] [PubMed] [Google Scholar]
- 5. Hubert R. S., Vivanco I., Chen E., Rastegar S., Leong K., Mitchell S. C., Madraswala R., Zhou Y., Kuo J., Raitano A. B., Jakobovits A., Saffran D. C., Afar D. E. (1999) STEAP: a prostate-specific cell-surface antigen highly expressed in human prostate tumors. Proc. Natl. Acad. Sci. U.S.A. 96, 14523–14528 [DOI] [PMC free article] [PubMed] [Google Scholar]
- 6. Moldes M., Lasnier F., Gauthereau X., Klein C., Pairault J., Fève B., Chambaut-Guérin A. M. (2001) Tumor necrosis factor-α-induced adipose-related protein (TIARP), a cell-surface protein that is highly induced by tumor necrosis factor-α and adipose conversion. J. Biol. Chem. 276, 33938–33946 [DOI] [PubMed] [Google Scholar]
- 7. Porkka K. P., Nupponen N. N., Tammela T. L., Vessella R. L., Visakorpi T. (2003) Human pHyde is not a classical tumor suppressor gene in prostate cancer. Int. J. Cancer 106, 729–735 [DOI] [PubMed] [Google Scholar]
- 8. Warkentin E., Mamat B., Sordel-Klippert M., Wicke M., Thauer R. K., Iwata M., Iwata S., Ermler U., Shima S. (2001) Structures of F420H2:NADP+ oxidoreductase with and without its substrates bound. EMBO J. 20, 6561–6569 [DOI] [PMC free article] [PubMed] [Google Scholar]
- 9. Zhang X., Krause K. H., Xenarios I., Soldati T., Boeckmann B. (2013) Evolution of the ferric reductase domain (FRD) superfamily: modularity, functional diversification, and signature motifs. PLoS One 8, e58126. [DOI] [PMC free article] [PubMed] [Google Scholar]
- 10. Sendamarai A. K., Ohgami R. S., Fleming M. D., Lawrence C. M. (2008) Structure of the membrane proximal oxidoreductase domain of human Steap3, the dominant ferrireductase of the erythroid transferrin cycle. Proc. Natl. Acad. Sci. U.S.A. 105, 7410–7415 [DOI] [PMC free article] [PubMed] [Google Scholar]
- 11. Gauss G. H., Kleven M. D., Sendamarai A. K., Fleming M. D., Lawrence C. M. (2013) The crystal structure of six-transmembrane epithelial antigen of the prostate 4 (Steap4), a ferri/cuprireductase, suggests a novel interdomain flavin-binding site. J. Biol. Chem. 288, 20668–20682 [DOI] [PMC free article] [PubMed] [Google Scholar]
- 12. Hartley J. L., Temple G. F., Brasch M. A. (2000) DNA cloning using in vitro site-specific recombination. Genome Res. 10, 1788–1795 [DOI] [PMC free article] [PubMed] [Google Scholar]
- 13. Shyu Y. J., Liu H., Deng X., Hu C. D. (2006) Identification of new fluorescent protein fragments for bimolecular fluorescence complementation analysis under physiological conditions. BioTechniques 40, 61–66 [DOI] [PubMed] [Google Scholar]
- 14. Backliwal G., Hildinger M., Kuettel I., Delegrange F., Hacker D. L., Wurm F. M. (2008) Valproic acid: a viable alternative to sodium butyrate for enhancing protein expression in mammalian cell cultures. Biotechnol. Bioeng. 101, 182–189 [DOI] [PubMed] [Google Scholar]
- 15. Chang S., Johnston R. J. Jr., Frøkjaer-Jensen C., Lockery S., Hobert O. (2004) MicroRNAs act sequentially and asymmetrically to control chemosensory laterality in the nematode. Nature 430, 785–789 [DOI] [PubMed] [Google Scholar]
- 16. Jones T. A., Zou J. Y., Cowan S. W., Kjeldgaard M. (1991) Improved methods for building protein models in electron density maps and the location of errors in these models. Acta Crystallogr. A 47, 110–119 [DOI] [PubMed] [Google Scholar]
- 17. Hu C. D., Chinenov Y., Kerppola T. K. (2002) Visualization of interactions among bZIP and Rel family proteins in living cells using bimolecular fluorescence complementation. Mol. Cell 9, 789–798 [DOI] [PubMed] [Google Scholar]
- 18. Kerppola T. K. (2008) Bimolecular fluorescence complementation (BiFC) analysis as a probe of protein interactions in living cells. Annu. Rev. Biophys. 37, 465–487 [DOI] [PMC free article] [PubMed] [Google Scholar]
- 19. Sievers F., Wilm A., Dineen D., Gibson T. J., Karplus K., Li W., Lopez R., McWilliam H., Remmert M., Söding J., Thompson J. D., Higgins D. G. (2011) Fast, scalable generation of high-quality protein multiple sequence alignments using Clustal Omega. Mol. Syst. Biol. 7, 539. [DOI] [PMC free article] [PubMed] [Google Scholar]
- 20. Claros M. G., von Heijne G. (1994) TopPred II: an improved software for membrane protein structure predictions. Comput. Appl. Biosci. 10, 685–686 [DOI] [PubMed] [Google Scholar]
- 21. Moreaux J., Kassambara A., Hose D., Klein B. (2012) STEAP1 is overexpressed in cancers: a promising therapeutic target. Biochem. Biophys. Res. Commun. 429, 148–155 [DOI] [PubMed] [Google Scholar]
- 22. Spratt D. E., Doran M. G., Wongvipat J., Lewis J. S., Evans M. J. (2014) 89Zr-MSTP2109A, a novel antibody based radiotracer to evaluate and guide the clinical translation of antibody-drug conjugates targeting STEAP1. Int. J. Radiat. Oncol. Biol. Phys. 90, S791 [Google Scholar]
- 23. Lawrence C. M., Ray S., Babyonyshev M., Galluser R., Borhani D. W., Harrison S. C. (1999) Crystal structure of the ectodomain of human transferrin receptor. Science 286, 779–782 [DOI] [PubMed] [Google Scholar]
- 24. Sanchez-Pulido L., Rojas A. M., Valencia A., Martinez-A C., Andrade M. A. (2004) ACRATA: a novel electron transfer domain associated to apoptosis and cancer. BMC Cancer 4, 98. [DOI] [PMC free article] [PubMed] [Google Scholar]
- 25. Brokx S. J., Rothery R. A., Zhang G., Ng D. P., Weiner J. H. (2005) Characterization of an Escherichia coli sulfite oxidase homologue reveals the role of a conserved active site cysteine in assembly and function. Biochemistry 44, 10339–10348 [DOI] [PubMed] [Google Scholar]
- 26. Sundaramoorthy M., Kishi K., Gold M. H., Poulos T. L. (1994) The crystal structure of manganese peroxidase from Phanerochaete chrysosporium at 2.06-Å resolution. J. Biol. Chem. 269, 32759–32767 [PubMed] [Google Scholar]
- 27. Lu P., Ma D., Yan C., Gong X., Du M., Shi Y. (2014) Structure and mechanism of a eukaryotic transmembrane ascorbate-dependent oxidoreductase. Proc. Natl. Acad. Sci. U.S.A. 111, 1813–1818 [DOI] [PMC free article] [PubMed] [Google Scholar]
- 28. Solmaz S. R., Hunte C. (2008) Structure of complex III with bound cytochrome c in reduced state and definition of a minimal core interface for electron transfer. J. Biol. Chem. 283, 17542–17549 [DOI] [PubMed] [Google Scholar]
- 29. Lambe T., Simpson R. J., Dawson S., Bouriez-Jones T., Crockford T. L., Lepherd M., Latunde-Dada G. O., Robinson H., Raja K. B., Campagna D. R., Villarreal G. Jr., Ellory J. C., Goodnow C. C., Fleming M. D., McKie A. T., Cornall R. J. (2009) Identification of a Steap3 endosomal targeting motif essential for normal iron metabolism. Blood 113, 1805–1808 [DOI] [PMC free article] [PubMed] [Google Scholar]
- 30. Amzallag N., Passer B. J., Allanic D., Segura E., Théry C., Goud B., Amson R., Telerman A. (2004) TSAP6 facilitates the secretion of translationally controlled tumor protein/histamine-releasing factor via a nonclassical pathway. J. Biol. Chem. 279, 46104–46112 [DOI] [PubMed] [Google Scholar]
Associated Data
This section collects any data citations, data availability statements, or supplementary materials included in this article.