

Background: Glycogen contains a low level of covalent phosphate that is significantly increased in Lafora disease.
Results: Exercise removes phosphate from muscle glycogen, but not in a Lafora disease mouse model. Restoration of glycogen level and structure is much faster than phosphate accumulation.
Conclusion: Absence of laforin affects glycogen remodeling.
Significance: Glycogen phosphorylation is slow, consistent with the teenage onset of Lafora disease.
Keywords: exercise; glycogen; Lafora disease (Lafora progressive myoclonic epilepsy, MELF); laforin; phosphorylation; branching
Abstract
Glycogen, the repository of glucose in many cell types, contains small amounts of covalent phosphate, of uncertain function and poorly understood metabolism. Loss-of-function mutations in the laforin gene cause the fatal neurodegenerative disorder, Lafora disease, characterized by increased glycogen phosphorylation and the formation of abnormal deposits of glycogen-like material called Lafora bodies. It is generally accepted that the phosphate is removed by the laforin phosphatase. To study the dynamics of skeletal muscle glycogen phosphorylation in vivo under physiological conditions, mice were subjected to glycogen-depleting exercise and then monitored while they resynthesized glycogen. Depletion of glycogen by exercise was associated with a substantial reduction in total glycogen phosphate and the newly resynthesized glycogen was less branched and less phosphorylated. Branching returned to normal on a time frame of days, whereas phosphorylation remained suppressed over a longer period of time. We observed no change in markers of autophagy. Exercise of 3-month-old laforin knock-out mice caused a similar depletion of glycogen but no loss of glycogen phosphate. Furthermore, remodeling of glycogen to restore the basal branching pattern was delayed in the knock-out animals. From these results, we infer that 1) laforin is responsible for glycogen dephosphorylation during exercise and acts during the cytosolic degradation of glycogen, 2) excess glycogen phosphorylation in the absence of laforin delays the normal remodeling of the branching structure, and 3) the accumulation of glycogen phosphate is a relatively slow process involving multiple cycles of glycogen synthesis-degradation, consistent with the slow onset of the symptoms of Lafora disease.
Introduction
Glycogen, a branched polymer of glucose, is a major energy reserve in many tissues and is especially important in skeletal muscle (1). The bulk synthesis of glycogen is mediated by glycogen synthase (GS)3 with the branch points introduced by the glycogen branching enzyme (GBE). The cytosolic pathway for glycogen degradation involves phosphorolytic cleavage of the main α1,4-glycosidic linkages by glycogen phosphorylase (GPh) and the action of the debranching enzyme (AGL) to remove the branches. Muscle glycogen content is linked to physiological status: it is degraded during exercise and synthesized during periods of recovery or after feeding. Control of these processes is generally attributed to the hormonal regulation of GPh and GS activities by covalent phosphorylation and allosteric regulators such as glucose-6-P and AMP (1). Glycogen is also degraded in the lysosome although the quantitative contribution of this pathway is less well defined. Its importance, however, is underscored by the severity of Pompe disease in which the lysosomal α-glucosidase (GAA) is defective, resulting in the overaccumulation of glycogen and the loss of lysosomal function (2). The mechanism by which glycogen is transferred to lysosomes is not well understood but likely involves autophagy or an autophagy-like pathway (1, 3). In Pompe disease, glycogen accumulates not only in lysosomes but also in pre-lysosomal vesicles that resemble autophagosomes (4).
Over 30 years ago, glycogen was first reported to contain trace amounts of phosphate (5) as was later confirmed by Whelan and colleagues (6–8) who suggested that it was present as C6-phosphomonoesters and C1-C6-phosphodiesters. From analysis of phospho-oligosaccharides purified from rabbit muscle glycogen by NMR, we reported the presence of C2- and C3-phosphomonoesters but not C6 mono- or diesters (9). Nitschke et al. (10) later confirmed the presence of C2- and C3-phosphoesters, also failed to detect C1-C6-phosphodiesters but did report the presence of C6-phosphomonoesters. We subsequently also identified C6-phosphate in glycogen, which accounts for ∼20% of the total (11). The current consensus, then, is that three of the four carbons of glucose not involved in α1,4-glycosidic linkages are susceptible to phosphorylation, although the overall prevalence of phosphate is very low, perhaps in the range of 1 phosphate per 500–2000 glucose residues, depending on the source of the glycogen (1). Recent attention has been drawn to glycogen phosphorylation in large part because of its association with Lafora disease (12–16), an autosomal recessive and fatal juvenile-onset epilepsy, caused by mutations in either the EPM2A or EPM2B/NHLRC1 genes, which, respectively, encode proteins called laforin (17, 18) and malin (19). The hallmark of Lafora disease is the accumulation of Lafora bodies, composed of a poorly branched and insoluble form of glycogen termed polyglucosan, in various tissues including skeletal muscle, heart, skin, and brain (12–15, 20). Laforin is, by sequence, a member of the atypical dual specificity protein phosphatase subfamily (21) but has been shown to dephosphorylate polysaccharides including glycogen and amylopectin in vitro (22, 23). In addition, glycogen in Epm2a knock-out mice has elevated phosphate content (22), indicating that laforin functions as a glycogen phosphatase in vivo. With age, as the glycogen of Epm2a−/− mice becomes more phosphorylated it also becomes poorly branched and insoluble, properties consistent with Lafora body formation (24). Therefore, one hypothesis to explain Lafora disease due to EPM2A mutation is that the lack of functional laforin to remove phosphate results in glycogen that is hyper-phosphorylated, of aberrant structure and prone to form Lafora bodies.
Little is known of the details of the metabolism of glycogen phosphate in vivo, particularly the dynamics. In the present study, we used exhaustive exercise as a means to severely deplete muscle glycogen and then monitored glycogen branching and phosphorylation during the recovery phase when glycogen was re-synthesized. Post-exercise glycogen re-synthesis correlated with a reduction of glycogen branching that gradually reverted to normal and decreased phosphorylation that persisted over a more extended period. However, remodeling of the glycogen branching structure was delayed in the absence of laforin. We also conclude that, during this protocol, removal of phosphate occurs primarily during glycogen degradation and, from analysis of Epm2a−/− mice, that laforin is responsible. In wild type mice, re-synthesized glycogen was less phosphorylated and only slowly increased its phosphorylation state.
Experimental Procedures
Animal Models
For the initial exercise experiments, C57Bl/6J mice were purchased from Jackson Laboratories. For experiments with laforin knock-out mice, we used control wild type animals from our own colony that matched the genetic background of the knock-out mice, as previously described (25). All mice were males, ∼3 months old. Mice were maintained in temperature and humidity-controlled conditions with 12:12 h light-dark cycle and were allowed food and water ad libitum. The standard chow was composed of a mixture of 19% protein, 9% fat, and 55% carbohydrate (Harlan Teklad global 2019S). All mouse studies were conducted in accordance with federal guidelines and were approved by the Institutional Animal Use and Care Committee of Indiana, University School of Medicine.
Mouse Exercise Protocol
Exercise to exhaustion on a treadmill (Exer6M, Columbus Instruments) followed the procedure described previously (26). Mice were removed from the belt upon exhaustion as judged by their inability to remain on the belt. Work performed (J) was calculated as previously described (26). Immediately after exercise, the mice received a bolus of 3.6 g of glucose/kg of body weight by oral gavage and sacrificed at different times post-exercise as indicated. As a control, glucose was administered to mice that were not exercised and muscle samples taken 3 h and 2 days after sacrifice. Post-exercise mice had access to food and water ad libitum. Mice were sacrificed by cervical dislocation and the posterior hind limb skeletal muscles immediately collected, frozen in liquid nitrogen, and stored at −80 °C until use. Blood glucose was measured using a Breeze 2 glucometer (Bayer).
Western Blotting
40 mg of powdered frozen skeletal muscle was homogenized for 20 s with a Tissue TearorTM and 20 s by sonication in 20 volumes of ice-cold RIPA buffer supplemented with 4 mm EDTA, 2 mm EGTA, 100 mm NaF, 10% glycerol, 0.35% β-mercaptoethanol, 2 mm pyrophosphate, 20 mm β-glycerophosphate, 1 mm orthovanadate, 0.1 mm Nα-p-tosyl-l-lysine chloromethyl ketone, 10 μg/ml of leupeptin, 2 mm benzamidine, 0.5 mm phenylmethylsulfonyl fluoride. The lysate was incubated for 10 min on ice, centrifuged at 10,000 × g for 10 min, and the supernatant was used for Western blot analyses as described previously (27). Antibodies against the following proteins were used: glycogen synthase and LC3 (Novus Biologicals NB110-57010; NB100-2331); AGL (Abgent number 2402); GBE and laforin (Abnova H00002632-A01 and H00007957-M02 respectively); pGS(3a), AMP protein-activated kinase α subunit (AMPK) and pAMPKα (Thr-172) (Cell Signaling numbers 3891, 2532, and 2535, respectively); GAPDH (Biodesign H86504M); p62 (MBL PM045); GPh (from Dr. Gerald M. Carlson, University of Kansas); phosphorylated GPh (GPh a; from Dr. Matthew Brady, University of Chicago); and Stbd1 (28). For LC3, lysates were separated using a 16% acrylamide Tricine SDS-PAGE system (29) and transferred to PVDF.
Glycogen Measurements
Total glycogen content in skeletal muscle was determined by measuring glucose released by amyloglucosidase treatment of glycogen from total tissue (27) or in the low speed supernatant and pellet after centrifugation of the tissue homogenates at 6,000 × g (24). Purification of glycogen for covalent phosphate determination and measurement of inorganic phosphate were performed as previously described (22). Total glycogen phosphate is calculated as the product of the glycogen phosphorylation stoichiometry (mol/mol) and the total tissue glycogen (mol of glucose equivalents per g of tissue).
Glycogen Branching Assay
The absorption spectrum of glycogen, 350–700 nm, in the presence of iodine, was determined by the method of Krisman (30) as described previously (31), as an index of glycogen branching. To determine glycogen chain length, 100 μg of purified glycogen was treated with 28,500 units of isoamylase in 100 mm sodium acetate (pH 3.5) for 16 h at 40 °C. The 14,000 × g supernatant was filtered with a 0.22-μm Spin-X column (Costar). The resulting glucose polymers (2.5 μg) were separated by high-performance anion exchange chromatography (HPAEC) using a Dionex ICS3000 with a PA-200 column with pulsed amperometric detection. Standards (0.25 nmol) of glucose oligomer standards from monomeric glucose to maltooctaose were also analyzed. Eluent A consisted of 100 mm NaOH and eluent B 100 mm NaOH with 1 m sodium acetate. The samples were eluted with a continuous gradient from 0–50% of eluent B over 60 min with a flow rate of 0.3 ml/min. Average chain length was calculated as the integral of polymer signal × polymer length, divided by the sum of all polymer signals. For large polymers like glycogen, the degree of branching expressed as a percentage corresponds to the inverse of the average chain length ×100.
Co-sedimentation of Stbd1 and Laforin with Glycogen
Protein binding to glycogen was assessed by co-sedimentation after high speed centrifugation as described previously for recombinant Stbd1 (28) and laforin (22). The blank substituted buffer for glycogen and purified glycogen from 12-month-old Epm2a−/− was included as a positive control. Glycogen from C57Bl/6J that were not exercised was compared with glycogen at 3 h post-exercise at which time glycogen was less branched. Proteins were analyzed in pellets and supernatants by Western blotting with anti-Stbd1 or anti-laforin antibodies.
Statistical Analyses
For each parameter, kurtosis and skewness were calculated to test for a normal distribution. In normally distributed data, groups were compared using analysis of variance, followed by the LSD post hoc test unless otherwise indicated. When only 2 sample groups were compared, Student's t test was used. A value of p < 0.05 was considered statistically significant. In some instances, measurements are associated with groupings of lowercase letters (e.g. ab); if two measurements do not share a letter, there is statistical significance (e.g. ab and cde).
Results
Effects of Exercise/Recovery on Glycogen Phosphorylation and Branching
To study the metabolism of the covalent phosphate in skeletal muscle glycogen in vivo, 3-month-old C57Bl/6J mice were exercised to exhaustion on a treadmill to deplete the polysaccharide and then administered an oral bolus of glucose and allowed free access to food (Fig. 1). Mice reached exhaustion after 30–40 min of exercise, and there was no difference in work performed or in blood glucose among the different experimental groups (Table 1). The total glycogen content in the skeletal muscle was decreased by ∼75% following exercise (Fig. 1A). After exercise, glycogen was rapidly resynthesized and by 3 h had reached levels ∼60% above the starting value, an example of the well established phenomenon of glycogen super-compensation (32–34). By 24 h, the glycogen level had reverted to normal and remained constant.
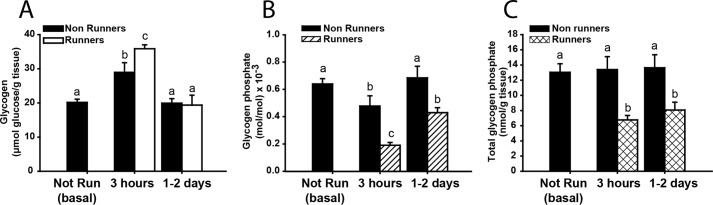
FIGURE 1.

Skeletal muscle glycogen in exercised C57Bl/6J mice. A, total glycogen expressed as μmol of glucose/g of tissue (open bars, exercised; filled bars, not run). B, phosphorylation state of glycogen, expressed as mol of phosphate/mol of glucose × 10−3 (striped bars, exercised; filled bars, not run). C, total glycogen phosphate content expressed as mol of phosphate/g of tissue (crossed bars, exercised; filled bars, not run). In these three panels, bars with the same letter are not significantly different from each other; different letters indicate p < 0.05. D, experimental protocol. OG, glucose administered by oral gavage. E, glycogen branching as assessed by iodine spectra (see “Experimental Procedures”). The absorbance was normalized to the value at 400 nm. Filled circles, not run; 1 h (open diamonds), 3 h (open hexagons), 1 day (open squares), and 6 days (open circles) after exercise. F, chain length distribution of glycogen after isoamylase treatment, as analyzed by HPAEC-PAD comparing non-run (filled circles) and mice 1 h after exercise (open circles). The percentage of the total PAD signal for oligosaccharides from 3 to 45 residues is indicated on the ordinate (see also Fig. 3). G, to simplify presentation of the data of panel F, chains were defined as short (3–15 glucose residues; filled bar) or long (16–45 residues; open bar) and their relative proportions plotted (*, p < 0.05 versus animals that were not run). Number of mice per group, n ≥ 5 (for complete details see Table 1). Data are shown as mean ± S.E.
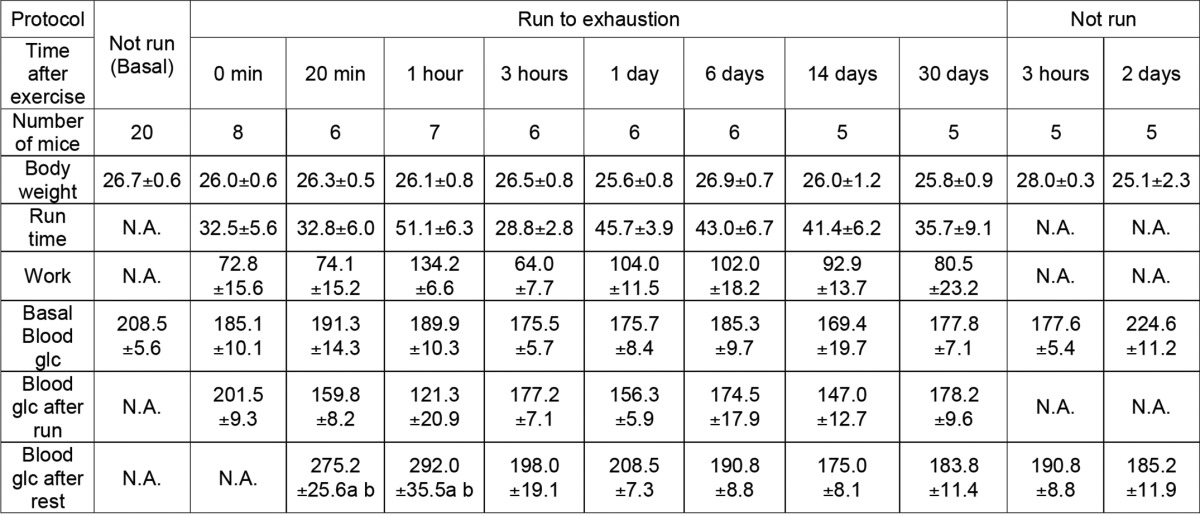
TABLE 1.
Body weight, exercise performance and blood glucose of C57Bl/6J mice
Weight is expressed as grams. Run time is expressed as minutes until reaching exhaustion. Work is expressed as Joules. Blood glucose (glc) is expressed as (mg/dl). Data are mean ± SE. a: p < 0.05 compared to basal blood glucose, same group. b: p < 0.05 compared to blood Glc after run same group. To compare blood glucose analysis of covariance was used. No difference among groups in body weight, run time, or work based on analysis of variance.
Concomitant with exercise-induced depletion of glycogen, ∼65% of the total glycogen-associated phosphate was also removed (Fig. 1C). However, the phosphorylation state of glycogen (expressed as mol of phosphate/mol of glucose) immediately after exercise was increased, suggesting that the degraded glycogen was less densely phosphorylated than what remained (Fig. 1B). During initial resynthesis and super-compensation, the phosphorylation state of glycogen rapidly declined to around 30% of its starting level, indicating that new synthesis of glycogen incorporated few phosphates. The phosphorylation state of the glycogen remained low even once the original glycogen concentration had been restored and, in this experiment, remained suppressed even 30 days after the exercise bout. As a control, non-exercised mice were also administered a glucose bolus (Fig. 2). After 3 h, total glycogen levels increased by ∼30%, less than in the exercised group, and returned to normal after 2 days (Fig. 2A). The total glycogen-associated phosphate was unchanged over this period with the glycogen phosphorylation state modestly reduced at 3 h, presumably because newly synthesized glycogen was less phosphorylated, and was restored to starting levels after 2 days (Fig. 2B). Without exercise, the total glycogen phosphate did not change (Fig. 2C), suggesting that substantial reduction in glycogen stores, such as achieved by exercise, is necessary for the removal of phosphate from glycogen.
FIGURE 2.
Effect of oral glucose bolus on non-exercised C57Bl/6J mice. The effect of administering a bolus of glucose to control mice that were not exercised (filled bars), was compared with the response of exercised mice (open bars; also shown in Fig. 1). A, total glycogen expressed as μmol of glucose/g of tissue. B, phosphorylation state of glycogen, expressed as mol of phosphate/mol of glucose × 10−3. C, total glycogen phosphate content expressed as mol of phosphate/g of tissue. Number of mice per group, n ≥ 5 (see also Table 1). Data are shown as mean ± S.E. Bars with the same letter are not significantly different from each other; different letters indicate p < 0.05.
Irimia et al. (34) had reported that, after intensive contraction of rabbit muscle, the resynthesized glycogen was less branched. We therefore monitored the branching structure of muscle glycogen from the exercised mice of the present study. Iodine spectra of the purified glycogen, in which the presence of longer polyglucose chains shifts the absorbance maximum to a higher wavelength (30), indicated a significant decrease in branching 1 h after exercise. Return of branching to basal levels, like the glycogen phosphorylation state, was relatively slow, not quite complete after 1 day but completely reverted by 6 days (Fig. 1E). The exercise-induced change in glycogen structure was also evaluated by HPAEC analysis of glucose chains released by isoamylase treatment (Figs. 1, F and G, and 3). After 1 h of recovery from exercise, the average chain length was increased from 13.24 ± 0.10 to 15.83 ± 0.10 (p = 0.001) corresponding to a reduction in branching degree from to 7.55 ± 0.06 to 6.32 ± 0.12 (p = 0.0007). However, the changes in branching structure did not alter the proportion of glycogen associated with the pellet following low speed centrifugation (Fig. 4D).
FIGURE 3.
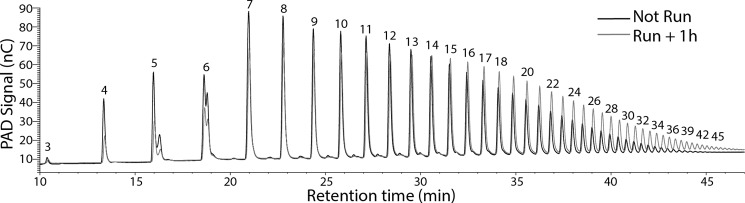
HPAEC-PAD of glucose polymers from isoamylase-treated glycogen. Shown is a representative chromatogram where the signal from pulsed amperometric detection (PAD) in nC is recorded versus retention time in minutes of the resolved glucose polymers. The numbers associated with each peak correspond to the polymer length. Samples from non-exercised mice (black) and 1 h after exercise (gray) are shown. For quantitation as in Fig. 1F, the areas under the curve for each polyglucose species is integrated and expressed as a percentage of the sum of the signals (here from length 3 to 45 residues).
FIGURE 4.

Autophagy and glycogen lysosomal disposal markers of control and exercised C57Bl/6J mice. A, representative Western blots of 3 samples per condition for LC3-II, p62, Stbd1, and laforin with GAPDH as a loading control. LC3-I was only apparent after a longer exposure. B, quantitation of exercised and post-exercise conditions (empty bars) compared with non-exercised conditions (filled bar) for LC3-II, p62, Stbd1, and laforin, all normalized by GAPDH. C, co-sedimentation of Stbd1 (upper strip) and laforin (lower strip) with poorly branched newly synthesized glycogen from 3 h after exercise (R+3h) compared with glycogen from not run (NR) mice. Also included was abnormal glycogen from 12-month-old Epm2a−/− mouse skeletal muscle (LafKO). The blank contained no glycogen. SN, supernatant; P, pellet from centrifugation at 100,000 × g at 4 °C for 90 min. D, distribution of glycogen in the low speed pellet of 6000 × g (as % of the total glycogen) from not run (basal) compared with 3 h after exercise when glycogen is less branched. Data are mean ± S.E. Bars with the same letter are not significantly different from each other; different letters indicate p < 0.05.
Effects of Exercise/Recovery on Glycogen-related Proteins
Concomitant with monitoring the status of glycogen, we also examined the levels and phosphorylation states of several proteins implicated in glycogen metabolism. Exercise caused a reduction in the phosphorylation of site 3a in glycogen synthase that continued through 20 min post-exercise (Fig. 5, A and B), consistent with activation of the enzyme, as has been reported previously (35–37). By 3 h, the phosphorylation was restored to basal. The phosphorylation of phosphorylase followed a similar pattern, although changes did not reach statistical significance (Fig. 5, A and C). In fact, decreased phosphorylation would cause decreased phosphorylase activity but it is likely that elevated AMP levels during exercise override phosphorylation controls. Exercise increased AMPK activity, judged by a 6-fold increase in Thr-172 phosphorylation, consistent with previous studies (34, 37–39), and was returned to its starting level 20 min after exercise (Fig. 5, A and D). The levels of branching and debranching enzyme protein were not substantially altered (Fig. 5, A and E). Although the breakdown of glycogen during exercise is generally attributed to the cytosolic action of phosphorylase, there are reports that exercise induces autophagic activity (40), which could contribute to lysosomal disposal of glycogen. Therefore, two markers of autophagy, LC3-II and p62, were monitored (Fig. 4, A and B). Although there was a trend to increases in both proteins after 20 min of recovery, no statistically significant changes in the groups of mice analyzed were observed (p = 0.65 and 0.16 respectively). Also, as indicators of autophagic activity, LC3-II and p62 should change in opposing directions. Overall, we concluded that there were no major alterations in autophagic activity following the exercise conditions used in the present study, at least as indicated by these markers of the process. Stbd1 is a glycogen-binding protein that we have suggested might be involved in vesicular trafficking of glycogen to lysosomes (28). The level of Stbd1 protein changed little after exercise or during recovery and the same was true for laforin, which is also a known glycogen-associating protein (Fig. 4, A and B). For both Stbd1 and laforin, we also tested whether there was any change in their binding to purified glycogen from non-run animals as compared with the less branched glycogen formed 3 h after exercise. No differences were observed (Fig. 4C).
FIGURE 5.

Glycogen metabolism-related enzymes in exercised C57Bl/6J mice. A, representative blots of 3 samples per condition and quantitation of fold-change of samples from exercised (open bars) compared with non-exercised mice (filled bars) for site 3a phosphorylation of GS normalized by total GS (B), glycogen phosphorylase α (GPha; phospho-S9) normalized by GPh (C), AMPKα phosphorylated at Thr-172 normalized by total AMPKα (D), and GBE (E) normalized by GAPDH. AGL showed no difference under any condition by analysis of variance (p = 0.54). Data are mean ± S.E. Bars with the same letter are not significantly different from each other; different letters indicate p < 0.05.
Role of Laforin in Glycogen Phosphorylation and Branching during Exercise and Recovery
Because of the role of laforin as a glycogen phosphatase (22), we compared glycogen phosphate metabolism in exercised 3-month-old wild type and Epm2a−/− mice of matched genetic background. We intentionally chose young Laforin knock-out mice of this age because, although they are beginning to form Lafora bodies in muscle, heart, and brain, they do not display overt neurological symptoms and there is no evidence of extreme morphological changes in muscle or muscle glycogen (25, 41). In old mice, alterations in glycogen metabolism are potentially secondary to the gross changes in muscle glycogen stores. Mice of both genotypes had the same body weight and exercise performance and followed the same pattern in blood glucose levels except immediately after running, when blood glucose was slightly lower in Epm2a−/− mice (Fig. 6, A–D, Table 2). At this young age, basal muscle glycogen levels were the same in both genotypes and were equally depleted by exercise (Fig. 6E). Likewise, glycogen levels during resynthesis, supercompensation, and return to basal levels were the same. However, as previously reported (22), even at this young age the basal muscle glycogen phosphate was elevated in Epm2a−/− mice (Fig. 6F). In contrast to the results with wild type mice, the total glycogen-associated phosphate in the Epm2a−/− mice was not altered by exercise, despite depletion of ∼75% of the glycogen, and remained essentially constant in the post-exercise period (Fig. 6G). Because the glycogen levels were reduced, the phosphorylation state of glycogen (mol of phosphate/mol of glucose) increased after exercise, was reduced by super-compensation and then reverted to the starting level once glycogen stores were normalized at 24 h (Fig. 6F). Glycogen phosphorylation in the wild type littermates followed a similar pattern as the C57Bl/6J mice through this experimental protocol (Fig. 1). Exercise caused a significant decrease in total glycogen phosphate, which was replenished only slowly, on a time frame of about 1 week, and the glycogen phosphorylation state followed a similar time course. As in the wild type mice, glycogen resynthesis in the Epm2a−/− mice was accompanied by a decrease in branching, as indicated by iodine spectra (Fig. 7, A–C) and HPAEC analysis (Fig. 7D). However, in the Epm2a−/− mice, there was a clear delay in the remodeling of the branching back to its basal state, most evident 1 day after running (Fig. 7B).
FIGURE 6.

Glycogen in exercised Epm2a+/+ and Epm2a−/− mice. Laforin knock-out mice (Epm2a−/−, filled bars) and genetically matched wild type mice (Epm2a+/+, open bars) were exercised to exhaustion and monitored up to 30 days post-exercise. A, total body weight (before exercise). B, exercise performance expressed as work (Joules). C, blood glucose before and immediately after exercise. D, blood glucose at the indicated time after exercise. The numbers in the bars indicate the n values for the given groups. E, total glycogen expressed as micromole of glucose/g of tissue. F, left, phosphorylation state of glycogen, expressed as mole of phosphate/mol of glucose × 10−3; right, expanded ordinate to allow better visualization of WT values. G, total glycogen phosphate content expressed as mole of phosphate/g of tissue. H, LC3-II and P62. Quantitation Western blot analyses of Epm2a−/− (filled bars) and genetically matched wild type mice Epm2a+/+ (open bars) for LC3-II and P62 normalized by GAPDH. No statistical differences were found in any condition or between genotypes. I, representative blots of 2 samples per condition of autophagy markers LC3 and P62 with GAPDH as loading control. Number of mice per group, n = 3–5, unless otherwise indicated (see also Table 2); for panels A–C, values from different groups were pooled as appropriate. Body weight and work were compared using a t test, whereas other parameters were compared using a multiple-way analysis of variance. Data are mean ± S.E. Bars with the same letter are not significantly different from each other; different letters indicate p < 0.05. Total glycogen was not different between genotypes.
TABLE 2.
Body weight, exercise performance, blood glucose, and glycogen branching of Laforin WT and Epm2a−/− mice
Weight is expressed as grams. Run time is expressed as minutes until reaching exhaustion. Work is expressed as Joules. Blood glucose (Glc) is expressed as (mg/dl). N.A., not applicable. N.M., not measured. Data are mean ± SE. No differences among groups in body weight, run time, work based on analysis of variance. To compare blood glucose analysis of covariance was used. No difference was observed between genotypes in degree of branching and average chain length. Values with the same letter are not different (p < 0.05).
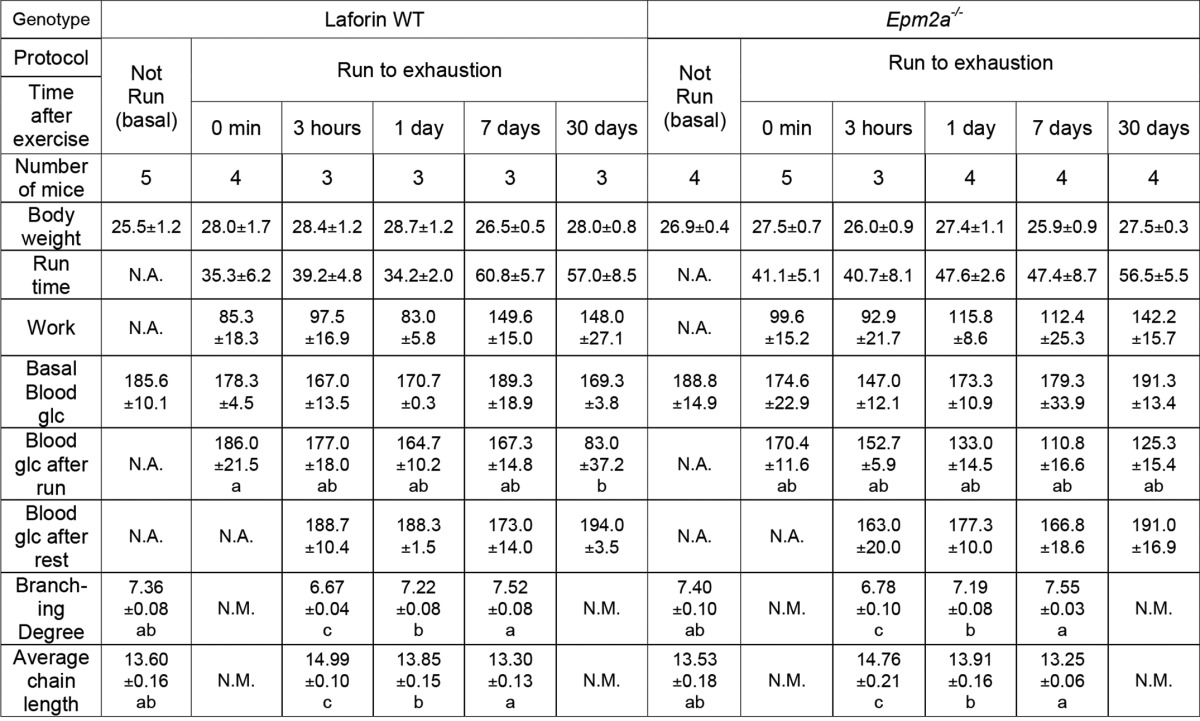
FIGURE 7.

Glycogen branching in exercised Epm2a+/+ and Epm2a−/− mice. Glycogen branching was measured by iodine spectra (with absorbance normalized to 400 nm) as described under “Experimental Procedures” in samples from Epm2a+/+ (filled symbols) and Epm2a−/− (open symbols) mice. A, not run (NR, circles) and 3 h after exercise (triangles). B, not run (NR, circles) and 1 day after exercise (diamonds). C, not run (NR, circles) and 7 days after exercise (squares). D, branching was also monitored by HPAEC-PAD, which separated glucose polymers from 2 to 45 residues after isoamylase treatment. The percentage of chains longer than 15 residues is plotted as an index of the branching state of glycogen from wild type Epm2a+/+ mice (filled bars) or Epm2a−/− mice (open bars) under the indicated condition. Bars with the same letter are not significantly different from each other; different letters indicate p < 0.05.
One explanation for the results is that in the absence of laforin, glycogen cannot be dephosphorylated during its metabolism. However, several reports have connected loss of laforin with decreased autophagy, which could have a role in glycogen disposal (42–46). We therefore also monitored LC3-II and p62 in muscle samples from the experiment described above (Fig. 6, H and I). As seen for the other wild type group (Fig. 4, A and B), there was no significant change in LC3-II. Nor were there statistically significant differences in the Epm2a−/− mice, either with respect to control mice or throughout the experiment. The p62 level was also unchanged in both control and Epm2a−/− groups. Therefore, changes in autophagy did not appear to play a significant role during or after exercise in either wild type or Epm2a−/− mice in this study.
Discussion
Excessive glycogen phosphorylation is associated with aberrant glycogen structure and altered physical chemical properties as well as the accumulation of Lafora bodies in mouse models of Lafora disease, especially as the mice age (24). The goal of the present study was to explore the dynamics of glycogen phosphorylation in mouse skeletal muscle, using exhaustive exercise as a means to deplete glycogen, and then to monitor its synthesis after exercise. The mechanism for the introduction of phosphate into glycogen is not yet fully understood. We (9) reported that the β-phosphate of UDP-glucose could be occasionally incorporated into glycogen during synthesis, as a side reaction to the normal transfer of glucose to the growing non-reducing ends of a glycogen molecule. The estimate was that this reaction occurred once every 10,000 catalytic cycles. Although this mechanism could explain the formation of C2- and possibly C3-phosphomonesters, it is unlikely to account for the C6 phosphate observed in glycogen (10, 11). This mechanism has been challenged by Nitschke et al. (10) who claimed that our measurement of glycogen phosphorylation was the result of [32P]UDP binding to glycogen. We have since carefully re-evaluated our analysis and confirmed our original conclusions, also finding no evidence for significant UDP binding to glycogen in the protocols used.4 However, regardless of the phosphorylation mechanism, removal of phosphate from glycogen can be attributed to laforin, a conclusion reinforced by the results presented here. Laforin can dephosphorylate amylopectin (22, 23), glycogen (22), and phospho-oligosaccharides derived from glycogen (9), and by inference is therefore capable of hydrolyzing phosphomonoesters at C2, C3 and C6 of glucose residues in oligo- and polysaccharides.
The glycogen particles in muscle are heterogeneous, both in size and localization (47). The size heterogeneity was documented by Marchand et al. (48) who found a normal distribution around an average of about 25 nm diameter. Perhaps just as important, particles could be characterized by localization (sarcolemmal, intermyofibrillar and intramyofibrillar) and furthermore, the different pools can be metabolically distinct under conditions of depletion or resynthesis (49, 50). Such heterogenity could conceivably extend to glycogen phosphate metabolism, but current methodology restricts us to analysis of the total glycogen of muscles. Therefore, our measurements are of the overall, average dynamics of the covalent phosphate in glycogen.
In the present study, acute depletion of glycogen by exercise of young wild type mice correlated with a substantial release of total glycogen phosphate although the phosphorylation state (mol phosphate/mol glucose) of the residual glycogen actually increased. This result argues that the degraded outer chains of glycogen were less heavily phosphorylated. A simple explanation is that the inner core of glycogen molecules is more phosphorylated, a finding consistent with the observation that exposure of glycogen to laforin in vitro removed only 20–25% of the total phosphate until glucosidases were added to disrupt glycogen structure (22). He et al. (40) had reported increased autophagy in mice following exercise and we therefore monitored the conventional autophagy markers, LC3-II and p62. However, in our study, there were no significant changes in LC3-II and p62 after exercise indicative of the activation of autophagy. Although we do not fully understand the discrepancy, we speculate that it may lie in differences in time and endurance of the exercise protocols used. Our results suggest, rather, that degradation of glycogen during exercise was via classic cytosolic glycogenolysis. This finding does not exclude the possibility that glycogen, and hence glycogen phosphate, can also be disposed via a lysosomal pathway under other conditions. We observed that laforin is necessary for exercise-induced dephosphorylation of glycogen. When Epm2a−/− mice, which lack laforin, were exercised the reduction in glycogen level was comparable with that of wild type controls but total glycogen phosphate was unchanged. This result is important for two reasons: first, it provides further confirmation that laforin acts as a glycogen phosphatase in vivo and second, it indicates that laforin acts during glycogen breakdown in this experimental protocol, a novel conclusion about laforin function in vivo. One could extrapolate that laforin likely acts during glycogen degradation also under less extreme conditions of glycogenolysis.
Monitoring mice in the post-exercise period allowed us to follow glycogen re-synthesis in vivo in terms of total amount, phosphate content, and branching (Fig. 8). Several phases can be distinguished. First, cessation of exercise coupled with exposure to glucose and nutrients is followed by relatively rapid glycogen synthesis, and super-compensation, over a period of a few hours. The newly synthesized glycogen is less branched, perhaps due to the elongation reactions outpacing the branching activity under these conditions. These results are independent of the presence of laforin, suggesting that laforin has no obligatory role in glycogen synthesis. Relatively little phosphate is added to muscle glycogen during resynthesis, as indicated by the significant reduction in its overall phosphorylation state in wild type animals. At the 3 h post-exercise time point, ∼30 μmol of glycogen/g of tissue had been synthesized with the addition of ∼2 nmol of phosphate/g of tissue, the equivalent of 1 phosphate per 7,700 glucose residues. The analogous calculation for laforin knock-out mice is inconclusive because of the high basal state of glycogen phosphorylation, which would put a value of 2 nmol/g added phosphate within the error of the measurements. However, the data do rule out a significantly greater rate of phosphate incorporation. Whatever mechanism accounts for the introduction of phosphate during the acute phase of glycogen synthesis, it is relatively slow and likely not affected by laforin. The calculated rate of in vivo phosphate incorporation is, interestingly, in the same range as the estimate of 1 phosphate per 10,000 glucose residues introduced in vitro by glycogen synthase (9). During the second phase of post-exercise glycogen metabolism, the elevated, super-compensated glycogen levels begin to revert to their basal state, as does the branching state of the polysaccharide. Re-establishment of the basal glycogen stores is complete by 24 h, again whether or not laforin is present. Restoration of normal structure and branching is slower, requiring more than 24 h. The absence of laforin delays the return to normally branched glycogen molecules, suggesting that excess glycogen phosphorylation interferes with the remodeling of the glycogen structure. From our data, glycogen phosphate depleted during a single bout of exercise is recovered only very slowly, on a time scale of 1 week or more. A possible explanation is that the extreme glycogen breakdown elicited by exercise exposes normally inaccessible internal chains of glycogen molecules to laforin, chains whose phosphate is more metabolically inert, has a lower turnover rate, and is not readily replenished.
FIGURE 8.

Muscle glycogen metabolism and remodeling during exercise and recovery. The figure depicts different phases in the restoration of basal glycogen level and structure following its acute depletion by exhaustive exercise. The slowest processes are the reinstatement of the starting levels of branching and glycogen phosphorylation, which likely entail multiple successive cycles of glycogen synthesis and degradation. Of these, the recovery of glycogen phosphorylation is clearly the slowest, with a time frame of 1 week or more. [Glc], glycogen amount in terms of glucose equivalents; P/Glc, glycogen phosphorylation state expressed as phosphates per glucose residue; LF, laforin; circles, covalent phosphates whose abundance is exaggerated for the sake of pictorial clarity; filled circles, phosphate present before exercise; open circles, phosphate introduced during synthesis/remodeling; gray chains indicate re-synthesized glycogen; ↑, increase compared with starting level; ⦵, equivalent to starting level; ↓, decrease compared with starting level.
In vivo remodeling of the branching structure of glycogen has been reported previously (34) but this phenomenon is much more familiar in studies of amylopectin metabolism (51, 52). However, modulation of amylopectin branching is linked to the normal biosynthetic process and the formation of its specialized branched structure, such that debranching enzymes are considered essential components of amylopectin synthesis (51, 52). In the case of glycogen, the details are less clear but it is likely that multiple normal cycles of glycogen utilization and repletion, as opposed to the stressed resynthesis of our experiments, will allow the basal balance of elongating and branching activities to generate the typically branched glycogen structure (Fig. 8).
Evidence is accumulating to support the notion that Lafora disease is caused by Lafora bodies in neurons because genetic depletion of glycogen in Epm2a−/− or Epm2b−/− mice, by disruption of the gene encoding the glycogen targeting type 1 phosphatase subunit PTG) (protein targeting to glycogen) (53, 54) or glycogen synthase itself (44, 55), reduces glycogen levels, suppresses Lafora body formation, and alleviates neurological symptoms. However, the mechanistic connection between the elevation of phosphate and the decreased frequency of glycogen branching in the polyglucosan formed in Lafora patients or mouse models of the disease is poorly understood and remains one of the central questions regarding the pathology of the disease. In the present study of young mice, the absence of laforin, with the consequent hyper-phosphorylation of glycogen, led to delayed restoration of the native structure to glycogen during recovery from exercise, affirming an interrelationship between phosphorylation and branching. Although phosphorylation of glucose residues in glycogen could directly affect the chemistry and/or enzymology of branching at specific glucose residues, the frequency of phosphorylation, even in glycogen from aged Lafora mice, is so low as to make it hard to envision a reduction in overall branching based on this mechanism (11). Also, it is important to distinguish young versus old laforin knock-out mice. At 3 months of age, glycogen level and branching is normal in Epm2a−/− mice even though muscle glycogen phosphorylation has increased by 4-fold (24). Lafora bodies are beginning to appear in the muscle at this age but their presence does not impact the overall measures of branching or glycogen level or the utilization of glycogen during exercise, as shown in this study. By 9–12 months of age, however, laforin knock-out mice have excessive glycogen deposits, a significant fraction of which is insoluble and poorly branched. It will be interesting to assess the exercise capabilities of these older laforin knock-out mice.
Author Contributions
J. M. I. was involved in the study design, performed and interpreted experiments, interpreted data, and contributed to the writing. V. S. T. made significant contributions to the initial design of experiments. C. M. M. and D. M. S. provided technical support for all the experiments. A. D. R. was involved in performance of some experiments, reviewing, analyzing, and interpreting the data as well as criticizing and revising the manuscript. P. J. R. was involved in the conception of the project, interpretation of the data, and writing the manuscript. All authors reviewed the results and approved the final version of the manuscript.
This work was supported, in whole or in part, by National Institutes of Health Grants DK27221 and NS56454. The authors disclose no actual or perceived conflicts of interest.
C. J. Contreras, D. M. Segvich, K. Mahalingan, V. M. Chikwana, T. D. Hurley, A. A. DePaoli-Roach, and P. J. Roach, unpublished results.
- GS
- glycogen synthase
- AGL
- glycogen debranching enzyme
- AMPK
- AMP-activated protein kinase
- GBE
- glycogen branching enzyme
- GPh
- glycogen phosphorylase
- HPAEC
- high-performance anion exchange chromatography
- LC3
- microtubule-associated protein light chain 3
- p62
- sequestosome 1, SQSTM1
- Stbd1
- starch binding domain containing protein 1
- Tricine
- N-[2-hydroxy-1,1-bis(hydroxymethyl)ethyl]glycine.
References
- 1. Roach P. J., Depaoli-Roach A. A., Hurley T. D., Tagliabracci V. S. (2012) Glycogen and its metabolism: some new developments and old themes. Biochem. J. 441, 763–787 [DOI] [PMC free article] [PubMed] [Google Scholar]
- 2. Hirschhorn R., Reuser A. J. (2000) Glycogen storage disease type II: acid α-glucosidase (acid maltase) deficiency in The Metabolic and Molecular Basis of Inherited Disease. (Scriver C. R., Beaudet A. L., Sly W. S., Valle D., eds) pp. 3389–3420, McGraw-Hill, New York [Google Scholar]
- 3. Raben N., Hill V., Shea L., Takikita S., Baum R., Mizushima N., Ralston E., Plotz P. (2008) Suppression of autophagy in skeletal muscle uncovers the accumulation of ubiquitinated proteins and their potential role in muscle damage in Pompe disease. Hum. Mol. Genet. 17, 3897–3908 [DOI] [PMC free article] [PubMed] [Google Scholar]
- 4. Fukuda T., Roberts A., Ahearn M., Zaal K., Ralston E., Plotz P. H., Raben N. (2006) Autophagy and lysosomes in Pompe disease. Autophagy 2, 318–320 [DOI] [PubMed] [Google Scholar]
- 5. Fontana J. D. (1980) The presence of phosphate in glycogen. FEBS Lett. 109, 85–92 [DOI] [PubMed] [Google Scholar]
- 6. Kirkman B. R., Whelan W. J. (1990) Intermolecular chemical heterogeneity of liver glycogen. Biofactors 2, 193–196 [PubMed] [Google Scholar]
- 7. Lomako J., Lomako W. M., Whelan W. J., Marchase R. B. (1993) Glycogen contains phosphodiester groups that can be introduced by UDPglucose: glycogen glucose 1-phosphotransferase. FEBS Lett. 329, 263–267 [DOI] [PubMed] [Google Scholar]
- 8. Lomako J., Lomako W. M., Kirkman B. R., Whelan W. J. (1994) The role of phosphate in muscle glycogen. Biofactors 4, 167–171 [PubMed] [Google Scholar]
- 9. Tagliabracci V. S., Heiss C., Karthik C., Contreras C. J., Glushka J., Ishihara M., Azadi P., Hurley T. D., DePaoli-Roach A. A., Roach P. J. (2011) Phosphate incorporation during glycogen synthesis and Lafora disease. Cell Metab. 13, 274–282 [DOI] [PMC free article] [PubMed] [Google Scholar]
- 10. Nitschke F., Wang P., Schmieder P., Girard J. M., Awrey D. E., Wang T., Israelian J., Zhao X., Turnbull J., Heydenreich M., Kleinpeter E., Steup M., Minassian B. A. (2013) Hyperphosphorylation of glucosyl C6 carbons and altered structure of glycogen in the neurodegenerative epilepsy Lafora disease. Cell Metab. 17, 756–767 [DOI] [PubMed] [Google Scholar]
- 11. DePaoli-Roach A. A., Contreras C. J., Segvich D. M., Heiss C., Ishihara M., Azadi P., Roach P. J. (2015) Glycogen phosphomonoester distribution in mouse models of the progressive myoclonic epilepsy, Lafora disease. J. Biol. Chem. 290, 841–850 [DOI] [PMC free article] [PubMed] [Google Scholar]
- 12. Delgado-Escueta A. V. (2007) Advances in lafora progressive myoclonus epilepsy. Curr. Neurol Neurosci. Rep. 7, 428–433 [DOI] [PubMed] [Google Scholar]
- 13. Andrade D. M., Turnbull J., Minassian B. A. (2007) Lafora disease, seizures and sugars. Acta Myol. 26, 83–86 [PMC free article] [PubMed] [Google Scholar]
- 14. Gentry M. S., Dixon J. E., Worby C. A. (2009) Lafora disease: insights into neurodegeneration from plant metabolism. Trends Biochem. Sci. 34, 628–639 [DOI] [PMC free article] [PubMed] [Google Scholar]
- 15. Ganesh S., Puri R., Singh S., Mittal S., Dubey D. (2006) Recent advances in the molecular basis of Lafora's progressive myoclonus epilepsy. J. Hum. Genet. 51, 1–8 [DOI] [PubMed] [Google Scholar]
- 16. Roach P. J., DePaoli-Roach A. A. (2013) Glycogen metabolism and Lafora disease. in Protein tyrosine phosphatase control of metabolism (Bence K. K., ed) pp. 239–262, Springer Science+Business Media, New York [Google Scholar]
- 17. Minassian B. A., Lee J. R., Herbrick J. A., Huizenga J., Soder S., Mungall A. J., Dunham I., Gardner R., Fong C. Y., Carpenter S., Jardim L., Satishchandra P., Andermann E., Snead O. C. 3rd, Lopes-Cendes I., Tsui L. C., Delgado-Escueta A. V., Rouleau G. A., Scherer S. W. (1998) Mutations in a gene encoding a novel protein-tyrosine phosphatase cause progressive myoclonus epilepsy. Nat. Genet. 20, 171–174 [DOI] [PubMed] [Google Scholar]
- 18. Serratosa J. M., Gómez-Garre P., Gallardo M. E., Anta B., de Bernabé D. B., Lindhout D., Augustijn P. B., Tassinari C. A., Malafosse R. M., Topcu M., Grid D., Dravet C., Berkovic S. F., de Córdoba S. R. (1999) A novel protein-tyrosine phosphatase gene is mutated in progressive myoclonus epilepsy of the Lafora type (EPM2). Hum. Mol. Genet. 8, 345–352 [DOI] [PubMed] [Google Scholar]
- 19. Chan E. M., Young E. J., Ianzano L., Munteanu I., Zhao X., Christopoulos C. C., Avanzini G., Elia M., Ackerley C. A., Jovic N. J., Bohlega S., Andermann E., Rouleau G. A., Delgado-Escueta A. V., Minassian B. A., Scherer S. W. (2003) Mutations in NHLRC1 cause progressive myoclonus epilepsy. Nat. Genet. 35, 125–127 [DOI] [PubMed] [Google Scholar]
- 20. Collins G. H., Cowden R. R., Nevis A. H. (1968) Myoclonus epilepsy with Lafora bodies: an ultrastructural and cytochemical study. Arch. Pathol. 86, 239–254 [PubMed] [Google Scholar]
- 21. Alonso A., Sasin J., Bottini N., Friedberg I., Friedberg I., Osterman A., Godzik A., Hunter T., Dixon J., Mustelin T. (2004) Protein-tyrosine phosphatases in the human genome. Cell 117, 699–711 [DOI] [PubMed] [Google Scholar]
- 22. Tagliabracci V. S., Turnbull J., Wang W., Girard J. M., Zhao X., Skurat A. V., Delgado-Escueta A. V., Minassian B. A., Depaoli-Roach A. A., Roach P. J. (2007) Laforin is a glycogen phosphatase, deficiency of which leads to elevated phosphorylation of glycogen in vivo. Proc. Natl. Acad. Sci. U.S.A. 104, 19262–19266 [DOI] [PMC free article] [PubMed] [Google Scholar]
- 23. Worby C. A., Gentry M. S., Dixon J. E. (2006) Laforin: a dual specificity phosphatase that dephosphorylates complex carbohydrates. J. Biol. Chem. 281, 30412–30418 [DOI] [PMC free article] [PubMed] [Google Scholar]
- 24. Tagliabracci V. S., Girard J. M., Segvich D., Meyer C., Turnbull J., Zhao X., Minassian B. A., Depaoli-Roach A. A., Roach P. J. (2008) Abnormal metabolism of glycogen phosphate as a cause for Lafora disease. J. Biol. Chem. 283, 33816–33825 [DOI] [PMC free article] [PubMed] [Google Scholar]
- 25. DePaoli-Roach A. A., Segvich D. M., Meyer C. M., Rahimi Y., Worby C. A., Gentry M. S., Roach P. J. (2012) Laforin and malin knockout mice have normal glucose disposal and insulin sensitivity. Hum. Mol. Genet. 21, 1604–1610 [DOI] [PMC free article] [PubMed] [Google Scholar]
- 26. Pederson B. A., Cope C. R., Schroeder J. M., Smith M. W., Irimia J. M., Thurberg B. L., DePaoli-Roach A. A., Roach P. J. (2005) Exercise capacity of mice genetically lacking muscle glycogen synthase: in mice, muscle glycogen is not essential for exercise. J. Biol. Chem. 280, 17260–17265 [DOI] [PubMed] [Google Scholar]
- 27. Pederson B. A., Schroeder J. M., Parker G. E., Smith M. W., DePaoli-Roach A. A., Roach P. J. (2005) Glucose metabolism in mice lacking muscle glycogen synthase. Diabetes 54, 3466–3473 [DOI] [PubMed] [Google Scholar]
- 28. Jiang S., Heller B., Tagliabracci V. S., Zhai L., Irimia J. M., DePaoli-Roach A. A., Wells C. D., Skurat A. V., Roach P. J. (2010) Starch binding domain-containing protein 1/genethonin 1 is a novel participant in glycogen metabolism. J. Biol. Chem. 285, 34960–34971 [DOI] [PMC free article] [PubMed] [Google Scholar]
- 29. Schägger H. (2006) Tricine-SDS-PAGE. Nat. Protoc. 1, 16–22 [DOI] [PubMed] [Google Scholar]
- 30. Krisman C. R. (1962) A method for the colorimetric estimation of glycogen with iodine. Anal. Biochem. 4, 17–23 [DOI] [PubMed] [Google Scholar]
- 31. Pederson B. A., Csitkovits A. G., Simon R., Schroeder J. M., Wang W., Skurat A. V., Roach P. J. (2003) Overexpression of glycogen synthase in mouse muscle results in less branched glycogen. Biochem. Biophys. Res. Commun. 305, 826–830 [DOI] [PubMed] [Google Scholar]
- 32. Jensen T. E., Richter E. A. (2012) Regulation of glucose and glycogen metabolism during and after exercise. J. Physiol. 590, 1069–1076 [DOI] [PMC free article] [PubMed] [Google Scholar]
- 33. Hawley J. A., Schabort E. J., Noakes T. D., Dennis S. C. (1997) Carbohydrate-loading and exercise performance: an update. Sports Med. 24, 73–81 [DOI] [PubMed] [Google Scholar]
- 34. Irimia J. M., Rovira J., Nielsen J. N., Guerrero M., Wojtaszewski J. F., Cussó R. (2012) Hexokinase 2, glycogen synthase and phosphorylase play a key role in muscle glycogen supercompensation. PLoS ONE 7, e42453. [DOI] [PMC free article] [PubMed] [Google Scholar]
- 35. Aschenbach W. G., Suzuki Y., Breeden K., Prats C., Hirshman M. F., Dufresne S. D., Sakamoto K., Vilardo P. G., Steele M., Kim J.-H., Jing S.-L., Goodyear L. J., DePaoli-Roach A. A. (2001) The muscle specific protein phosphatase PP1G/RGL(GM) is essential for activation of glycogen synthase by exercise. J. Biol. Chem. 276, 39959–39967 [DOI] [PubMed] [Google Scholar]
- 36. Nielsen J. N., Richter E. A. (2003) Regulation of glycogen synthase in skeletal muscle during exercise. Acta Physiol. Scand. 178, 309–319 [DOI] [PubMed] [Google Scholar]
- 37. DePaoli-Roach A. A., Tagliabracci V. S., Segvich D. M., Meyer C. M., Irimia J. M., Roach P. J. (2010) Genetic depletion of the malin E3 ubiquitin ligase in mice leads to lafora bodies and the accumulation of insoluble laforin. J. Biol. Chem. 285, 25372–25381 [DOI] [PMC free article] [PubMed] [Google Scholar]
- 38. Winder W. W., Hardie D. G. (1996) Inactivation of acetyl-CoA carboxylase and activation of AMP-activated protein kinase in muscle during exercise. Am. J. Physiol. 270, E299–E304 [DOI] [PubMed] [Google Scholar]
- 39. Friedrichsen M., Mortensen B., Pehmøller C., Birk J. B., Wojtaszewski J. F. (2013) Exercise-induced AMPK activity in skeletal muscle: role in glucose uptake and insulin sensitivity. Mol. Cell. Endocrinol. 366, 204–214 [DOI] [PubMed] [Google Scholar]
- 40. He C., Bassik M. C., Moresi V., Sun K., Wei Y., Zou Z., An Z., Loh J., Fisher J., Sun Q., Korsmeyer S., Packer M., May H. I., Hill J. A., Virgin H. W., Gilpin C., Xiao G., Bassel-Duby R., Scherer P. E., Levine B. (2012) Exercise-induced BCL2-regulated autophagy is required for muscle glucose homeostasis. Nature 481, 511–515 [DOI] [PMC free article] [PubMed] [Google Scholar]
- 41. Ganesh S., Delgado-Escueta A. V., Sakamoto T., Avila M. R., Machado-Salas J., Hoshii Y., Akagi T., Gomi H., Suzuki T., Amano K., Agarwala K. L., Hasegawa Y., Bai D. S., Ishihara T., Hashikawa T., Itohara S., Cornford E. M., Niki H., Yamakawa K. (2002) Targeted disruption of the Epm2a gene causes formation of Lafora inclusion bodies, neurodegeneration, ataxia, myoclonus epilepsy and impaired behavioral response in mice. Hum. Mol. Genet. 11, 1251–1262 [DOI] [PubMed] [Google Scholar]
- 42. Aguado C., Sarkar S., Korolchuk V. I., Criado O., Vernia S., Boya P., Sanz P., de Córdoba S. R., Knecht E., Rubinsztein D. C. (2010) Laforin, the most common protein mutated in Lafora disease, regulates autophagy. Hum. Mol. Genet. 19, 2867–2876 [DOI] [PMC free article] [PubMed] [Google Scholar]
- 43. Knecht E., Aguado C., Sarkar S., Korolchuk V. I., Criado-García O., Vernia S., Boya P., Sanz P., Rodríguez de Córdoba S., Rubinsztein D. C. (2010) Impaired autophagy in Lafora disease. Autophagy 6, 991–993 [DOI] [PMC free article] [PubMed] [Google Scholar]
- 44. Duran J., Gruart A., García-Rocha M., Delgado-García J. M., Guinovart J. J. (2014) Glycogen accumulation underlies neurodegeneration and autophagy impairment in Lafora disease. Hum. Mol. Genet. 23, 3147–3156 [DOI] [PubMed] [Google Scholar]
- 45. Puri R., Ganesh S. (2012) Autophagy defects in Lafora disease: cause or consequence? Autophagy 8, 289–290 [DOI] [PubMed] [Google Scholar]
- 46. Garyali P., Segvich D. M., DePaoli-Roach A. A., Roach P. J. (2014) Protein degradation and quality control in cells from laforin and malin knockout mice. J. Biol. Chem. 289, 20606–20614 [DOI] [PMC free article] [PubMed] [Google Scholar]
- 47. Graham T. E., Yuan Z., Hill A. K., Wilson R. J. (2010) The regulation of muscle glycogen: the granule and its proteins. Acta Physiol. (Oxf.) 199, 489–498 [DOI] [PubMed] [Google Scholar]
- 48. Marchand I., Chorneyko K., Tarnopolsky M., Hamilton S., Shearer J., Potvin J., Graham T. E. (2002) Quantification of subcellular glycogen in resting human muscle: granule size, number, and location. J. Appl. Physiol. 93, 1598–1607 [DOI] [PubMed] [Google Scholar]
- 49. Marchand I., Tarnopolsky M., Adamo K. B., Bourgeois J. M., Chorneyko K., Graham T. E. (2007) Quantitative assessment of human muscle glycogen granules size and number in subcellular locations during recovery from prolonged exercise. J. Physiol. 580, 617–628 [DOI] [PMC free article] [PubMed] [Google Scholar]
- 50. Nielsen J., Holmberg H. C., Schrøder H. D., Saltin B., Ortenblad N. (2011) Human skeletal muscle glycogen utilization in exhaustive exercise: role of subcellular localization and fibre type. J. Physiol. 589, 2871–2885 [DOI] [PMC free article] [PubMed] [Google Scholar]
- 51. Ball S., Guan H. P., James M., Myers A., Keeling P., Mouille G., Buléon A., Colonna P., Preiss J. (1996) From glycogen to amylopectin: a model for the biogenesis of the plant starch granule. Cell 86, 349–352 [DOI] [PubMed] [Google Scholar]
- 52. Zeeman S. C., Kossmann J., Smith A. M. (2010) Starch: its metabolism, evolution, and biotechnological modification in plants. Annu. Rev. Plant Biol. 61, 209–234 [DOI] [PubMed] [Google Scholar]
- 53. Turnbull J., DePaoli-Roach A. A., Zhao X., Cortez M. A., Pencea N., Tiberia E., Piliguian M., Roach P. J., Wang P., Ackerley C. A., Minassian B. A. (2011) PTG depletion removes Lafora bodies and rescues the fatal epilepsy of Lafora disease. PLoS Genet. 7, e1002037. [DOI] [PMC free article] [PubMed] [Google Scholar]
- 54. Turnbull J., Epp J. R., Goldsmith D., Zhao X., Pencea N., Wang P., Frankland P. W., Ackerley C. A., Minassian B. A. (2014) PTG protein depletion rescues malin-deficient Lafora disease in mouse. Ann. Neurol. 75, 442–446 [DOI] [PubMed] [Google Scholar]
- 55. Pederson B. A., Turnbull J., Epp J. R., Weaver S. A., Zhao X., Pencea N., Roach P. J., Frankland P. W., Ackerley C. A., Minassian B. A. (2013) Inhibiting glycogen synthesis prevents lafora disease in a mouse model. Ann. Neurol. 74, 297–300 [DOI] [PMC free article] [PubMed] [Google Scholar]