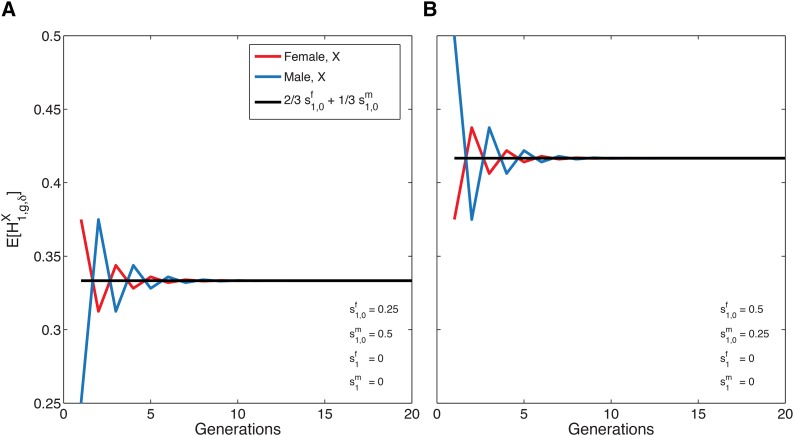
Figure 2.
The mean of the X-chromosomal admixture fraction over time in females (red) and males (blue) from the admixed population, for a single admixture event (Equations 12 and 13). The mean X-chromosomal admixture (from source population 1) oscillates in approaching its limit (Equation 14). The limiting mean, shown in black, is the same for X chromosomes in both females and males. (A) (B)

