

Abstract
Context
Autism spectrum disorder (ASD) is currently on the rise, now affecting approximately 1 in 68 children in the United States according to a 2010 surveillance summary from the Centers for Disease Control and Prevention (CDC). This figure is an estimated increase of 78% from the figure in 2002. The CDC suggests that more investigation is needed to understand this astounding increase in autism in such a short period.
Objective
The aim of this pilot study was to determine whether a group of children with ASD exhibited similar variations in a broad array of potential correlates, including medical histories, symptoms, genetics, and multiple nutritional and metabolic biomarkers.
Design
This study was a retrospective, descriptive chart review.
Setting
The study took place at the University of Kansas Medical Center (KUMC).
Participants
Participants were 7 children with ASD who had sought treatment at the Integrative Medicine Clinic at the medical center.
Results
A majority of the children exhibited an elevated copper:zinc ratio and abnormal vitamin D levels. Children also demonstrated abnormal levels of the essential fatty acids: (1) α-linolenic acid (ALA)— C13:3W3, and (2) linoleic acid (LA)—C18:2W6; high levels of docosahexaenoic acid (DHA); and an elevated ω-6:ω-3 ratio. Three of 7 children demonstrated abnormal manganese levels. Children did not demonstrate elevated urine pyruvate or lactate but did have abnormal detoxification markers. Three of 7 patients demonstrated abnormalities in citric acid metabolites, bacterial metabolism, and fatty acid oxidation markers. A majority demonstrated elevated serum immunoglobulin G (IgG) antibodies to casein, egg whites, egg yolks, and peanuts. A majority had absent glutathione S-transferase (GSTM) at the 1p13.3 location, and 3 of 7 children were heterozygous for the glutathione S-transferase I105V (GSTP1). A majority also exhibited genetic polymorphism of the mitochondrial gene superoxide dismutase A16V (SOD2).
Conclusions
The findings from this small group of children with ASD points to the existence of nutritional, metabolic, and genetic correlates of ASD. These factors appear to be important potential abnormalities that warrant a case control study to evaluate their reliability and validity as markers of ASD.
Autism spectrum disorder (ASD) is currently on the rise, now affecting approximately 1 in 68 children in the United States according to a 2010 surveillance summary, “Prevalence of Autism Spectrum Disorders,” from the Centers for Disease Control and Prevention (CDC).1 This figure is an estimated increase of 78% when compared with surveillance data from 2002. The CDC’s report suggests that more investigation is needed to understand this astounding increase in autism in such a short period.
Despite extensive research on autism, its etiology remains unknown. However, evidence suggests that pre-and postnatal insults, genetics, environmental factors, nutritional issues, and metabolic abnormalities may all play a role. Studies have described metabolic abnormalities, including mitochondrial dysfunction, impaired transmethylation and transsulfuration pathways, oxidative stress, immune dysfunction, gastrointestinal (GI) pathology, and nutritional disorders.2–8
Several reviews have outlined the medical problems in ASD to help improve treatment plans.7,9–11 Current treatment includes behavioral therapies that, on average, cost $40 000 to 60 000 per child per year, in addition to annual medical costs of approximately $10 709.1 It is imperative to identify autism early and to understand the etiology and potential associated metabolic abnormalities in hopes of finding cost-effective treatments that improve quality of life.
Several studies have focused on the metabolic, nutritional, immune system, and genetic abnormalities, but each focused on only a few biomarkers. The aim of the current pilot study was to evaluate and describe multiple metabolic biomarkers in a single group of children with ASD, who presented for treatment at the Integrative Medicine Clinic at the University of Kansas Medical Center (KUMC). Biomarkers may be helpful in subgrouping children and in identifying nutritional and metabolic abnormalities that may be treatable.12
In the current study, the primary hypothesis was that patients with a diagnosis of ASD would show similar variations in medical history, symptoms, genetics, nutrition, and metabolism. The identification of specific metabolic and nutritional derangements may help shape the current research agenda, which may subsequently influence recommendations in ASD treatment and management.
Methods
Participants
Charts of 9 patients who had received treatment for symptoms of ASD through the Integrative Medicine Clinic at KUMC were reviewed. Patients were included if they (1) had received a diagnosis of ASD and (2) were receiving treatment at the clinic. The research team had no knowledge as to whether patients were currently receiving care at another integrative treatment center or had received it in the past. The laboratory markers were done prior to the treatment, because insufficient data were available to include posttreatment laboratory markers. Charts of 2 patients were excluded because they had no formal diagnosis of ASD; therefore, 7 cases were included in the study.
Data Collection
The current retrospective chart review was approved by the institutional review board of KUMC. A data collection instrument (Appendix A) was created by the authors using Microsoft Word (Microsoft Corporation, Redmond, WA, USA) to standardize data collection. It was used to review the current charts from the Integrative Medicine Clinic of all patients who had a formal diagnosis of ASD and were aged 25 and younger at the time of their initial visits. Paper-based medical charts and electronic medical records were reviewed inside the clinic’s office suite by the study’s investigators.
Appendix A.
Data Collection Sheet
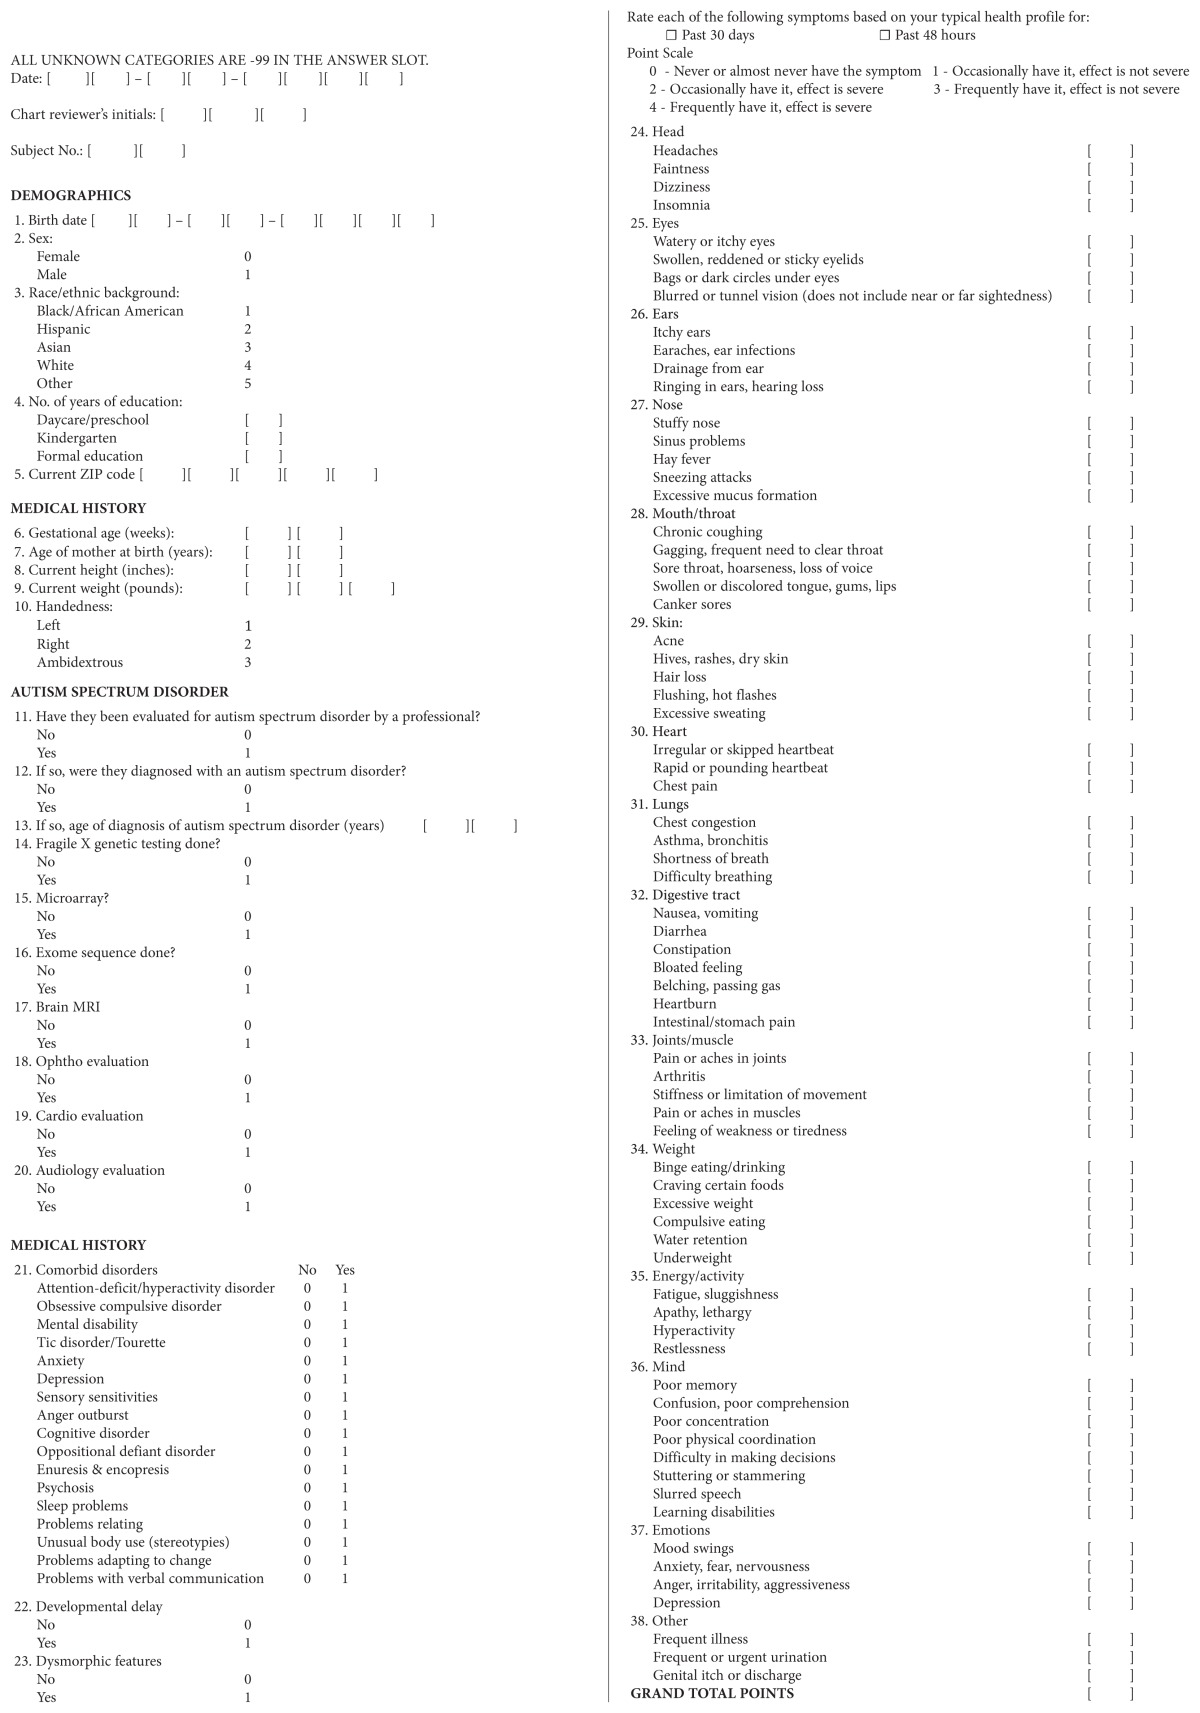
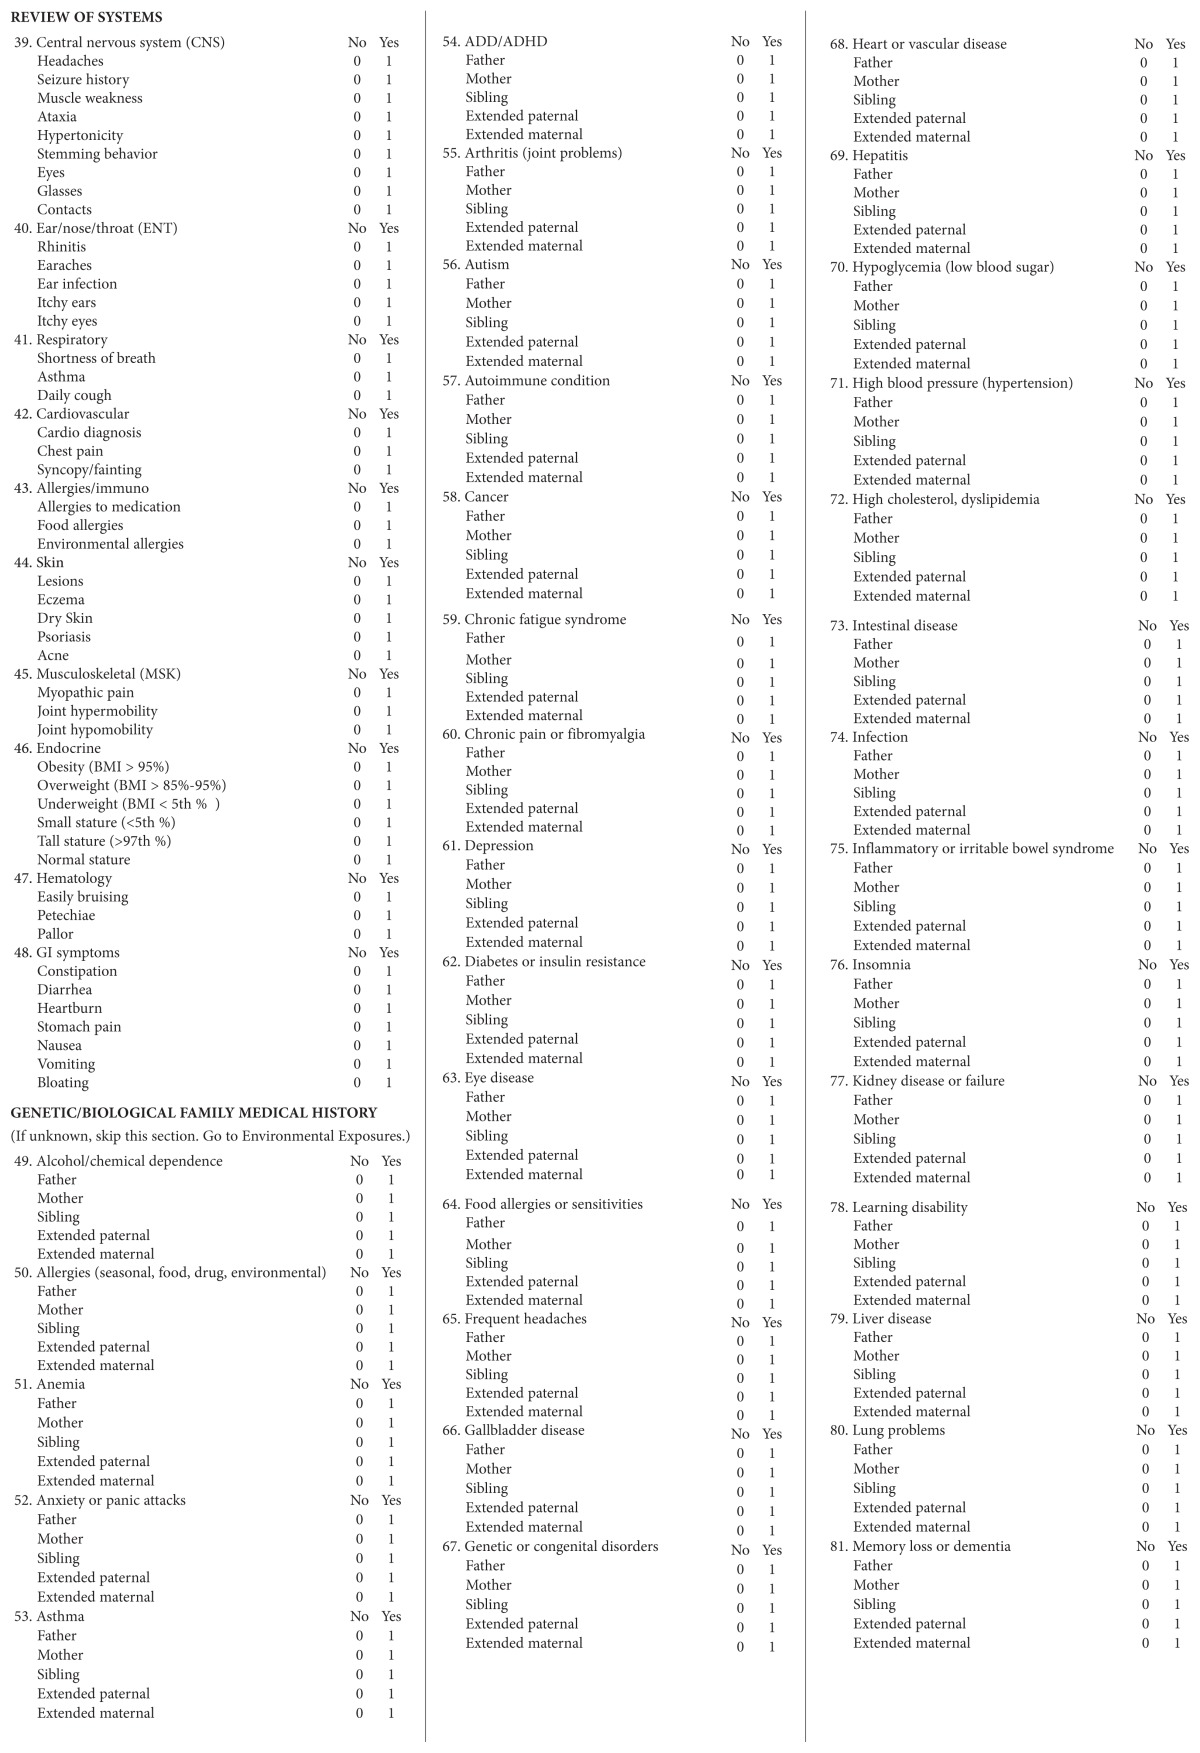
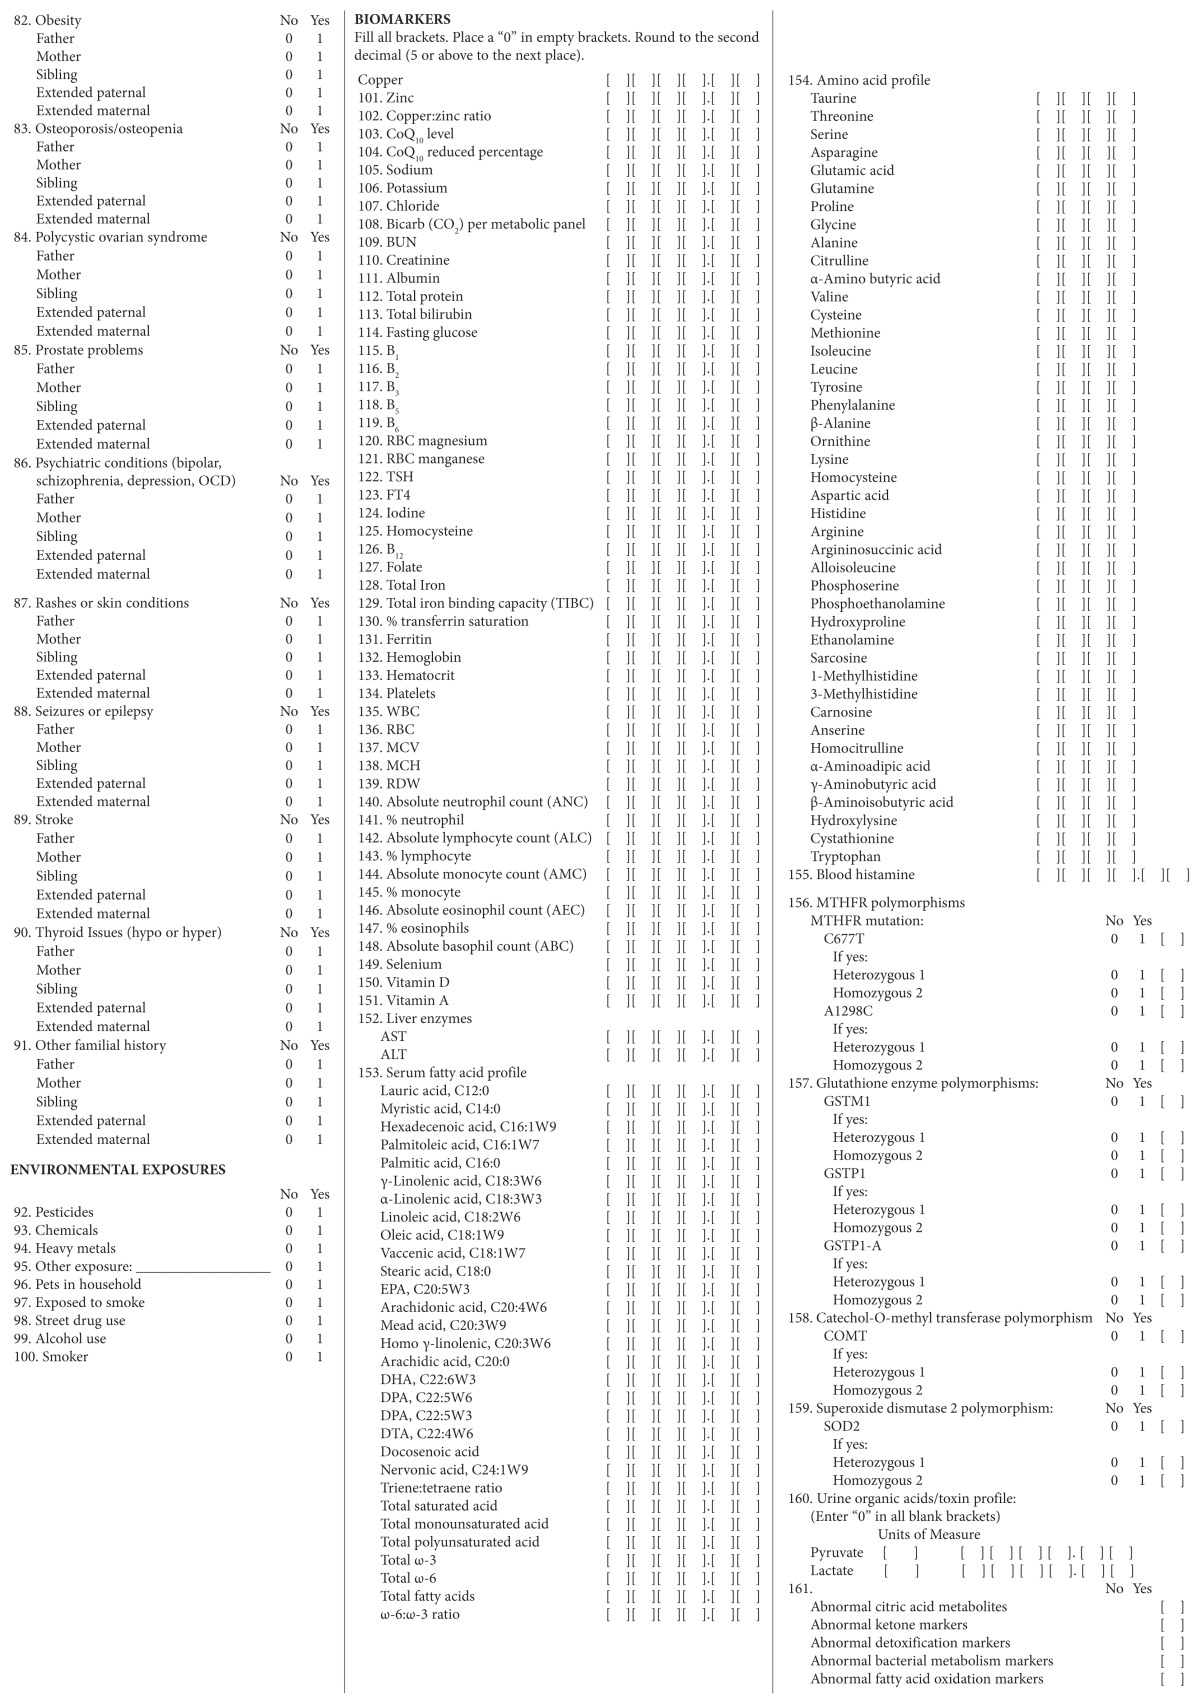
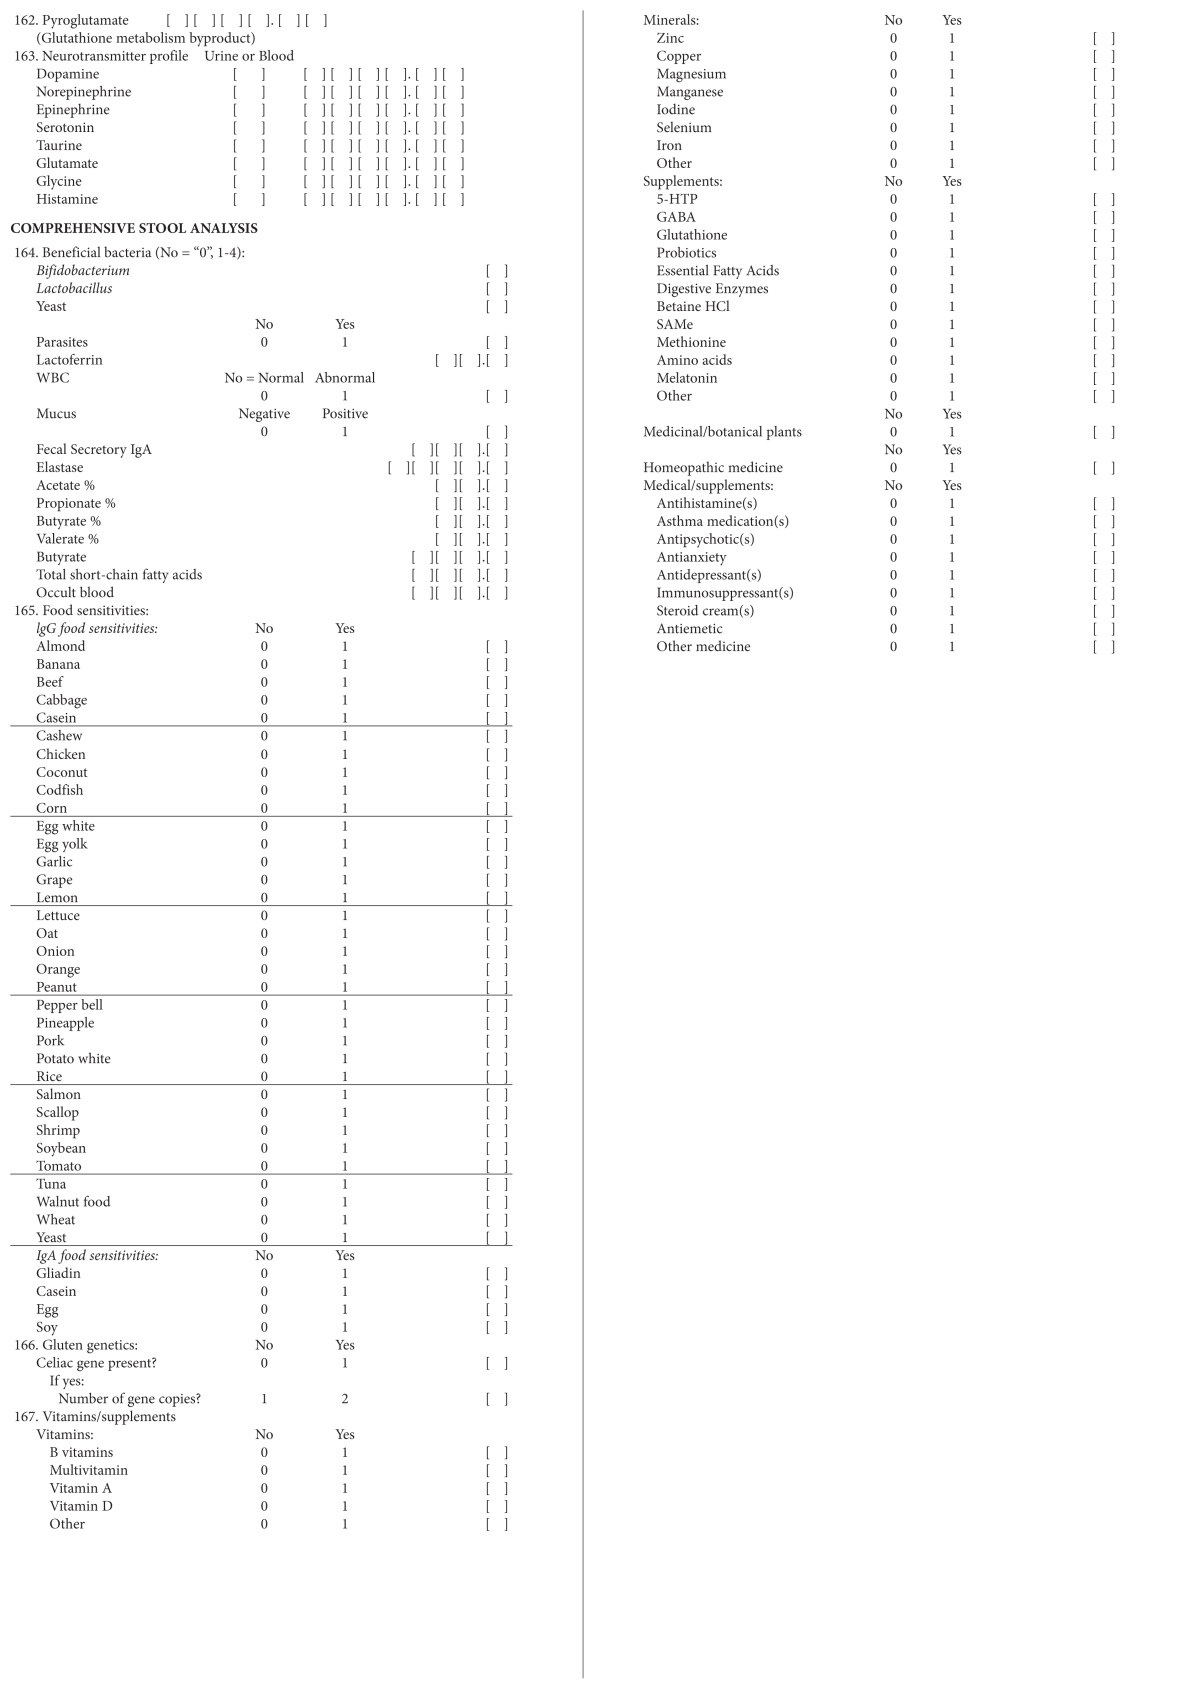
Abbreviations: MRI, magnetic resonance imaging; CNS, central nervous system; ENT, ear/nose/throat; MSK, musculoskeletal; BMI, body mass index; GI, gastrointestinal; ADD, attention-deficit disorder; ADHD, attention-deficit/hyperactivity disorder; OCD, obsessive compulsive disorder; CoQ10, coenzyme Q10; BUN, blood urea nitrogen; RBC, red blood cell; TSH, thyroid-stimulating hormone; FT4, free thyroxine; TIBC, total iron binding capacity; WBC, white blood cell; MCV, mean corpuscular volume; MCH, mean corpuscular hemoglobin; RCD, red cell distribution; ANC, absolute neutrophil count; ALC, absolute lymphocyte count; AMC, absolute monocyte count; AEC, absolute eosinophil count; ABC, absolute basophil count; AST, aspartate aminotransferase; ALT, alanine aminotransferase; EPA, eicosapentaenoic acid; DHA, docosahexaenoic acid; DPA, docosapentaenoic acid; DTA, docosatetraenoic acid; COMT, catechol-Omethyl transferase; SOD2, superoxide dismutase 2; IgA, immunoglobulin A, IgA; IgG, immunoglobulin G; 5-HTP, 5-hydroxytryptophan; GABA, γ-aminobutyric acid; HCl, hydrochloride.
The data collection instrument targeted data on patients’ characteristics, results from their medical symptom questionnaires and laboratory tests used during their initial visits, information from their individualized treatment plans, and results from their posttreatment laboratory tests and medical symptom questionnaires. Data were transferred by hand from the data collection instrument to a Microsoft Excel (Microsoft Corporation, Redmond, WA, USA) database. Also, a second investigator double-checked the accuracy of the recording of information on the data abstraction sheets, making sure that it agreed with the data on the charts. In addition, all units of measure were transformed uniformly in the database.
To preserve patients’ anonymity, a list of eligible charts was created using patients’ names prior to chart selection during the period of data abstraction. From that pool of eligible charts, some were chosen at random and assigned a study number from a second list, and the patients’ names were erased from the list of potential charts. These lists were kept separately, with no link between patients’ names and the study’s findings in the database. Only the study’s investigators had access to patients’ names or other identifying information after data abstraction was complete.
Statistical Analysis
The study was a descriptive one that summarized the data abstracted from the integrative medicine charts. Comparisons of pre- and posttreatment data were not conducted due to the small sample size and the prevalence of missing posttreatment data. A neurotransmitter analysis was excluded because neurotransmitter testing performed at baseline could not be interpreted without follow-up testing. Tests measuring blood histamines, blood counts, iodine, and gluten genetics and those providing a gene analysis for methylenetetrahydrofolate reductase (MTHFR) were also excluded due to insufficient data. A data variable was examined and reported only if at least 3 patients had data for that variable.
Results
A total of 7 patients, aged 7 to 18 years, were included in the current retrospective chart review (Table 1). Three of the patients had received magnetic resonance imaging (MRI) that was intended to assist in evaluation of possible brain abnormalities that might contribute to autistic traits (Table 2).
Table 1.
Patients’ Characteristics and Demographics (n = 7)
| Characteristics | Results |
|---|---|
| Age range | 7–18 y |
| Gender | 5 male, 2 female |
| Ethnicity | 2 white, 1 Hispanic, 4 unknown |
| Education | 7 had completed kindergarten; additional formal education—3 had completed 2 y; 1 had completed 5 y; 1 had completed 12 y; and 1 had completed 13 y |
| Residence | 2 in Missouri; 6 in Kansas |
| Gestational age | Ranged from 35–43 wk |
| Maternal age | Mean age was 31 y; range was 28–36 y |
| Handedness | 3 right handed; 4 unknown handedness |
Table 2.
Evaluation of Autism Following Algorithm
| Evaluation | Results |
|---|---|
| Mean age at ASD diagnosis | 3.3 y |
| Fragile X | 2 did not have fragile X; 5 unknown |
| Microarray analysis | 2 did not have microarray; 5 unknown |
| Exome analysis | 2 did not have exome analysis; 5 unknown |
| MRI | 3 received MRI; 2 had no MRI; 2 unknown |
| Ophthalmologic examination | 1 received exam; 1 did not have exam; 5 unknown |
| Cardiology evaluation | 2 received exam; 5 unknown |
| Audiology evaluation | 1 received exam; 6 unknown |
Abbreviations: ASD, autism spectrum disorder; MRI, magnetic resonance imaging.
The following tables show data only when a majority of the patients had values for a specific factor and a majority of those were abnormal. The patients for whom the investigators did not have data were removed. A denominator of less than 7 indicates missing data variables.
Medical History
A majority of patients had medical problems and comorbid disorders—anxiety, problems relating to others, problems adapting to new situations, and verbal problems (Table 3).
Table 3.
Medical Problems and Comorbid Disorders
| Medical History | Resultsa |
|---|---|
| Anxiety | 6/6 |
| Problems relating | 5/5 |
| Problems adapting | 5/5 |
| Verbal problems | 5/5 |
A denominator < 7 indicates missing data for some patients; findings were included for factors only if more than 50% of patients were positive.
Dietary Supplements and Medications
A majority of patients were on fatty acid supplements and a pharmaceutical medicine (Table 4).
Table 4.
Dietary Supplements and Medications
| Dietary Supplements | Results |
|---|---|
| Fatty acid supplements | 4/7 |
| Other—antifungal, insulin, nasal fluticasone spray, low-dose naltrexone, oxcarbazepine, lamotrigine, lansoprazole, piroxicam, acetaminophen | 5/7 |
Family History
A majority of patients had a maternal history of seasonal allergies and an extended paternal history of heart disease (Table 5).
Table 5.
Family History of Patients
| Family History | Resultsa |
|---|---|
| Maternal seasonal allergies | 4/7 |
| Extended paternal heart disease | 4/6 |
A denominator < 7 indicates missing data for some patients; findings were included for factors only if more than 50% of patients were positive.
Health Profile
A majority of patients had a family history that was positive for anxiety (Table 6).
Table 6.
Medical Symptom Questionnaire (MSQ)— Number of Patients Who Scored 3 or Above in a Category
| Health Profile | Resultsa |
|---|---|
| Anxiety | 4/4 |
A denominator < 7 indicates missing data for some patients; findings were included for factors only if more than 50% of patients were positive.
Review of Symptoms
A majority of patients complained of rhinitis (runny nose/congestion), environmental allergies, diarrhea, and constipation (Table 7).
Table 7.
Review of Systems—Number of Patients Who Had a Positive Review of Systems Under a Category
| Review of Systems | Resultsa |
|---|---|
| Rhinitis | 4/6 |
| Environmental allergies | 5/6 |
| Diarrhea | 4/6 |
| Constipation | 4/6 |
A denominator < 7 indicates missing data for some patients; findings were included for factors only if more than 50% of patients were positive.
Biomarkers
All metabolic biomarkers are reported in Table 8. A majority of patients showed an elevated copper:zinc ratio and low levels of vitamin D (25-OHD), as represented by the note in Table 8. People with low levels of vitamin D (25-OHD) are defined as those at risk of a vitamin D deficiency, with a level lower than 20 ng/mL, and of a vitamin D insufficiency, with a level between 21 and 29 ng/mL.13 Of note, 3 of the 7 children were found to have abnormal manganese levels; for 2 children, the levels were unknown.
Table 8.
Metabolic Biomarkers via Blood Worka
| Biomarkers | Results | |||
|---|---|---|---|---|
| High | Low | Normal | Unknown | |
| Copper | 1 | 1 | 5 | 0 |
| Zinc | 0 | 1 | 6 | 0 |
| Copper:zinc ratioa | 4a | 1a | 2 | 0 |
| CoQ10 level | 0 | 0 | 7 | 0 |
| CoQ10 reduced percentage | 0 | 1 | 5 | 1 |
| B1 | 0 | 0 | 5 | 1 |
| B2 | 0 | 1 | 5 | 1 |
| B3 | 0 | 1 | 5 | 1 |
| B5 | 1 | 0 | 3 | 3 |
| B6 | 2 | 0 | 3 | 2 |
| RBC magnesium | 0 | 1 | 5 | 1 |
| RBC manganesea | 2a | 1a | 2 | 2 |
| TSH | 0 | 0 | 5 | 2 |
| Homocysteine | 1 | 1 | 3 | 2 |
| B12 | 1 | 0 | 4 | 2 |
| Folate | 0 | 0 | 6 | 1 |
| Selenium | 0 | 0 | 6 | 1 |
| Vitamin Da | 0 | 4a | 3 | 0 |
| Vitamin A | 2 | 0 | 4 | 1 |
Abbreviations: CoQ10, coenzyme Q10; RBC, red blood cell; TSH, thyroid-stimulating hormone.
Biomarkers for which a majority of patients showed abnormal levels.
Serum Fatty Acid Profile
Serum fatty acids for patients are shown in Table 9. A majority of patients had abnormal levels of linoleic acid (LA)—C18:2W6, an essential fatty acid. A majority of patients had a high ω-6:ω-3 ratio.
Table 9.
Comprehensive Serum Fatty Acid Panel
| Serum Fatty Acid Profile | Results | |||
|---|---|---|---|---|
| High | Low | Normal | Unknown | |
| Hexadecenoic acid, C16:1W9 | 1 | 0 | 4 | 2 |
| Palmitoleic acid, C16:1W7 | 0 | 1 | 4 | 2 |
| γ-Linolenic acid, C18:3W6 | 0 | 0 | 5 | 2 |
| α-Linolenic acid, C18:3W3a | 2 | 1 | 2 | 2 |
| Linoleic acid, C18:2W6a | 4a | 0 | 1 | 2 |
| Vaccenic acid, C18:1W7a | 0 | 3 | 2 | 2 |
| EPA, C20:5W3 | 1 | 0 | 4 | 2 |
| Arachidonic acid, C20:4W6 | 2 | 0 | 3 | 2 |
| H-γ-Linolenic, C20:3W6 | 0 | 1 | 4 | 2 |
| Arachidic acid, C20:0a | 0 | 3 | 2 | 2 |
| DHA, C22:6W3a | 3 | 0 | 2 | 2 |
| DPA, C22:5W6 | 0 | 2 | 3 | 2 |
| DPA, C22:5W3 | 0 | 1 | 4 | 2 |
| DTA, C22:4W6 | 0 | 1 | 4 | 2 |
| Docosenoic acid | 0 | 1 | 4 | 2 |
| Nervonic acid, C24:1W9 | 0 | 1 | 4 | 2 |
| Triene:tetraene ratio | 0 | 1 | 4 | 2 |
| Total saturated acid | 0 | 0 | 5 | 2 |
| Total monounsaturated acid | 0 | 0 | 5 | 2 |
| Total polyunsaturated acid | 2 | 0 | 3 | 2 |
| Total ω-3 | 1 | 0 | 4 | 2 |
| Total ω-6 | 2 | 0 | 3 | 2 |
| Total fatty acids | 0 | 0 | 5 | 2 |
| ω-6:ω-3 ratioa | 5a | 0 | 0 | 2 |
Abbreviations: EPA, eicosapentaenoic acid; DHA, docosahexaenoic acid; DPA, docosapentaenoic acid; DTA, docosatetraenoic acid.
Serum fatty acids for which a majority of patients showed abnormal levels.
Urine Organic Acids/Toxin Profile
Urine organic acids for patients are shown in Table 10. Participants did not demonstrate elevated urine pyruvate or lactate but did have abnormal detoxification markers, as represented by the note. Only 3 of 7 patients demonstrated abnormalities in citric acid metabolites, bacterial metabolism, and fatty acid oxidation markers.
Table 10.
Urine Organic Acids/Toxicity Panel
| Urine Organic Acids/Toxin Profile | Results | |||
|---|---|---|---|---|
| High | Low | Normal | Unknown | |
| Pyruvate | 0 | 0 | 4 | 3 |
| Lactate | 0 | 0 | 4 | 3 |
| Citric acid metabolitesa | 3 | 0 | 1 | 3 |
| Detoxification markersa | 4a | 0 | 0 | 3 |
| Bacterial Metabolism markersa | 3 | 0 | 1 | 3 |
| Fatty acid oxidation markersa | 3 | 0 | 1 | 3 |
| Pyroglutamate | 1 | 1 | 2 | 3 |
Toxins for which a majority of patients showed abnormal levels.
Immunoglobulin G Food Antibodies
Table 11 shows that a majority of patients showed elevated levels of immunoglobulin G (IgG) antibodies to casein, egg whites, egg yolks, and peanuts.
Table 11.
IgG Food Antibody Panel
| Food Sensitivities | Results |
|---|---|
| Casein | 4/7 |
| Egg Whites | 4/7 |
| Egg Yolks | 4/7 |
| Peanuts | 4/7 |
Abbreviation: IgG, immunoglobulin G.
Genetic Panel of Transsulfuration and Transmethylation and Redox Metabolism
All genetic markers within this panel are shown in Table 12. A majority of patients had absent glutathione S-transferase (GSTM) at the 1p13.3 location, and 3 of 7 were heterozygous for the glutathione S-transferase I105V (GSTP1). A majority also exhibited a genetic polymorphism of the mitochondrial, superoxide dismutase SOD2 (A16V) gene.
Table 12.
Transmethylation/Transsulfuration Genetic Panel
| Genetic Panel | Yes | No | Unknown |
|---|---|---|---|
| GSTM (absent) 1p13.3a | 4a | 1 | 2 |
| GSTP1 (L105V)a | 3 | 2 | 2 |
| Heterozygousa | 3 | 2 | 2 |
| Homozygous | 0 | 5 | 2 |
| GSTP1-A (A114V) | 1 | 4 | 2 |
| Heterozygous | 1 | 4 | 2 |
| Homozygous | 0 | 5 | 2 |
| COMT (V158M) | 2 | 3 | 2 |
| Heterozygous | 1 | 4 | 2 |
| Homozygous | 1 | 4 | 2 |
| SOD2 (A16V)a | 4a | 1 | 2 |
| Heterozygous | 1 | 4 | 2 |
| Homozygousa | 3 | 2 | 2 |
Genetic markers for which a majority of patients showed abnormal results.
Discussion
The current study analyzed several biomarkers to identify trends in children with autism prior to initiation of individualized biomedical treatment at KUMC’s Integrative Medicine Clinic.
Copper:Zinc Ratio
The copper:zinc ratio was elevated in a majority of individuals with autism in this study. Recent evidence based on a case control study comparing 60 children with ASD in a Chinese Han population and 60 age-and-gender-matched children without ASD demonstrated that mean serum copper levels were significantly higher in children with ASD than in the controls.14 That study also found that mean serum zinc levels were significantly lower in the children with ASD than in controls, resulting in an elevated copper:zinc ratio. Copper is a trace mineral important in angiogenesis, hematopoiesis, oxidative stress, and neurotransmission.15,16 However, copper can be toxic to the nervous system and the liver, as demonstrated in Wilson’s disease and Alzheimer’s disease.17,18 Copper by itself has been shown to induce oxidative damage in the phospholipid membranes of children with autism.19
Zinc is an essential trace mineral that participates in at least 300 enzymatic reactions and is used by 2000 transcription factors involved in gene expression.20 It is involved in immune function,21,22 growth and endocrine imbalance,23–25 and brain development and neurotransmitter homeostasis.26 An elevated copper:zinc ratio—greater than a 1:1 ratio—has been reported in other behavior disorders, such as aggression.27 An elevated copper:zinc ratio also has been shown to be associated with elevated inflammatory markers, including interleukin 6 (IL-6), erythrocyte sedimentation rate (ESR), and C-reactive protein (CRP).28 Adjusting copper:zinc ratios to 1:1 should be further evaluated as a potential therapeutic modality for children with ASD.
Vitamin D
Vitamin D was found to be low in the current study’s patients with autism. The study followed US Endocrine Society Guidelines for low vitamin D levels, which define vitamin D deficiency and insufficiency as levels below 20 ng/mL (50 nmol/L) and levels between 21 and 29 ng/mL (52.5–72.5 nmol/L), respectively.12 Vitamin D does not function as other vitamins do, because most of it is manufactured by the skin when exposed to ultraviolet (UVB) radiation.29
An ecological study demonstrated that ASD incidence increased with lower UVB exposure.30 Seasonal variations also existed, with children diagnosed with autism being more commonly born in spring-summer, perhaps suggesting that they received less vitamin D in utero from the mother.31 Maternal vitamin D deficiency is also a risk factor for ASD, because it has a negative effect on the neurodevelopment that occurs in utero.31–34 Higher vitamin D levels in pregnancy were associated with improved neuropsychological development.35
Unlike other vitamins, it is difficult to obtain vitamin D in the diet unless individuals are eating one that consists mostly of wild-caught fresh fish, eggs, and a plethora of fortified cereals, milk, and juice products. However, vitamin D levels may also be insufficient in states of overutilization, such as with oxidative stress, prevalent among children with ASD.3,6–8,36 Vitamin D deficiency has been identified in children with ASD.37–39 However, a study that evaluated nutritional status in children with ASD in Arizona did not find a difference in vitamin D levels between the ASD and the control groups.7 This negative finding is also consistent with a study by Molloy et al40 that found vitamin D deficiency among 61% of an entire cohort when comparing vitamin D levels among participants with ASD without a restricted diet, participants with ASD and a casein-free diet, and unaffected controls.
Vitamin D plays a crucial role in neurodevelopmental disorders because the active form of vitamin D (1,25 OH) acts as a neurosteroid. In fact, low vitamin D levels in autistic children are negatively correlated to scores on the childhood autism rating scale (CARS).41 The vitamin D receptor has been shown to be expressed more prominently in dopaminergic areas of the brain, which may be consistent with evidence that altered dopamine neurotransmission existed in autistic patients.32,42 Ames and Patrick43–45 hypothesized that vitamin D regulates tryptophan metabolism and mediates production of serotonin, both of which are altered in children with ASD. In a review of the literature, Cannell and Grant46 proposed that vitamin D plays multiple roles in ASD, including repairing DNA damage, reducing inflammation, preventing autoimmunity, and preserving mitochondrial function. This finding may imply that vitamin D levels need to be further evaluated with interventional trials in children with autism, as vitamin D homeostasis is significantly involved in neuropsychiatric illness.
Red Blood Cell Manganese
The current study found abnormalities in red blood cell (RBC) manganese. Manganese was either low or elevated in 3 of the 7 patients; values for 2 patients were unknown. Tests for levels of RBC manganese report intracellular RBC levels, which are considered to be a good measure of manganese status in the long term.47 Manganese is a trace mineral and cofactor that is involved in mitochondrial metabolism. It is a cofactor for superoxide dismutase in the mitochondria.48 Superoxide dismutase buffers free radicals by catalyzing superoxide radicals into hydrogen peroxide, which is then removed by glutathione.49
It is interesting to note that the majority of the autistic patients in the current study also had homozygous superoxide dismutase polymorphisms. This polymorphism leads to poor transport of superoxide dismutase into mitochondria and could potentially cause a manganese elevation because it becomes underutilized.50 In addition, elevated manganese is linked to neurotoxicity through mitochondrial disruption and oxidative stress.51,52 These mechanisms may be the underlying reasons why elevated levels of manganese are associated with intellectual dysfunction in children.53 However, one case-control study of 55 children with ASD and 44 neurotypical children did not find a significant association between manganese and risk of ASD.7 To identify nutrient therapies that could potentially help children with autism, a closer look at RBC manganese and its relationship with superoxide dismutase polymorphisms should be evaluated in future studies.
Fatty Acid Profile
In the current study, a majority of the patients had elevated ω-6 polyunsaturated fatty acid (PUFA) LA (n-6). The ω-6:ω-3 ratio (n-6:n-3) was also elevated. The role of PUFA in neurodevelopment is becoming clearer through relatively new research. The brain and nervous tissue rely on ω-3 fatty acids, specifically docosahexaenoic acid (DHA) and eicosapentaenoic acid (EPA), for structural purposes and cell signaling.54 Hypotheses have been generated that PUFA plays a large role in ASD and that its supplementation may improve patients’ outcomes.55,56
Elevated n-6:n-3 ratios above 4–6:1 have been associated with neuroinflammation, which is considered to be a possible underlying etiopathogenesis in autism.57 In several studies, patients with ASD exhibited an elevated n-6:n-3 ratio and a decreased n-3 fatty acid compared with intellectually impaired controls.58,59 Eric Fombonne, md, a world-renowned authority on autism, and his colleagues reported no incidence of autism from 1991 through 2006 among an Inuit population with very high fish consumption.60 Due to mercury contamination, pregnant women and women planning to become pregnant are advised to avoid several types of fish, which are good sources of ω-3 fatty acids EPA and DHA.61 According to the Food and Drug Administration (FDA), approximately 75% of women do not meet the requirements for eating 2 to 3 servings (8–12 oz) of fish during pregnancy as of 2014.62 In addition, a study by Bloomingdale et al63 showed that women did not receive advice that they should try to eat fish that is low in mercury. However, that study indicated that they were willing to eat more when advised by their obstetricians on which fish are safe to eat. EPA and DHA supplements are not advisable at this point in time due to reported methodological limitations of related studies and poor clarity on the benefits from randomized controlled trials (RCTs) on ω-3 supplementation.64,65
One study using n-3 supplementation showed improvement in autistic behavior in 20 of 30 autistic children who were on a supplement of DHA and evening primrose oil.66 However, in a Cochrane review, no quality evidence was found that supplementation with ω-3 fatty acids is effective for improving symptoms of ASD.67 The beneficial effects of ω-3 fatty acids should continue to be reconsidered due to the paucity of studies selected in this Cochrane review, because 6 of the 8 trials did not meet the randomized, placebo-controlled standards. Evidence exists that dietary ω-3, DHA, enhances cognitive development, such as increasing sustained attention.68
The balance of n-6 and n-3 fatty acids is important for normal and healthy development throughout life.69 However, the disruption of the food supply has changed the n-6:n-3 ratio. Evolutionarily, the intake of LA and α-linolenic acid has provided a ratio of 1:1, whereas today it is approximately 16:1 as a result of increased intake of vegetable oils and livestock fed a diet rich of grains, all sources of ω-6.57 This diet leads to an overproduction of proinflammatory mediators that may affect neurologic function. In a thorough review, van Elst et al55 explained that decreasing the ratio of n-6:n-3 early in life influences neuroplasticity. This finding may be reason enough to advise families of children with ASD on a thorough dietary intake and to encourage an increased consumption of healthy fatty acids, such as butter from grass-fed animals, olive oil, and safe fish and seafood. It may prove beneficial to evaluate the comprehensive fatty acid profile of children with autism and encourage use of that laboratory marker in future interventional clinical trials.
Genetics and Autism
Children with autism have demonstrated an abnormal transsulfuration pathway that involves a major redox buffer, called glutathione.3 The current study found that a majority of the autistic patients had genetic polymorphisms in GSTM, and 3 of 7 patients were heterozygous for GSTP1, with values for 2 patients being unknown. Glutathione S-transferase is the enzyme that binds glutathione to electrophilic substances in phase II detoxification. Glutathione protects against oxidative stress through its antioxidant and detoxification capacities, which may be affected in the pathophysiology of autism.7,70 James et al3 found a borderline association with the null genotype for glutathione S-transferase (GSTM1) in patients with autism. However, the GSTP1 ILR105VAL polymorphism was not found to be significantly associated with autism.71,72 To the current research team’s knowledge, GSTP1 ALA114VAL has not been studied in the autism population. Enzyme polymorphisms involved in transsulfuration pathways that play a role in buffering oxidative stress may demonstrate utility as a biomarker involved in the etiopathogenesis of ASD.
Superoxide Dismutase
The current study demonstrated that a majority of patients had a polymorphism in manganese superoxide dismutase (MnSOD) 2 (A16V). MnSOD is important in maintenance of mitochondrial function because it protects against oxidative stress through dismutation of superoxide radicals. The research team found that the A16V polymorphism, in which valine is substituted for alanine in the mitochondrial targeting sequence, is partially retained in the inner-membrane import pore, and its messenger RNA is rapidly degraded, thus exhibiting lower activity than its alanine MnSOD variant.50,73 Several studies did not find a significant association between SOD2 activity and autism, but failure of antioxidant enzymes can lead to oxidative damage, which may be an underlying risk factor in autism.5,59
Abnormal Detoxification Markers
A majority of patients exhibited abnormal detoxification markers included in the urine metabolic panel, including para-hydroxyphenyl lactate, orotate, pyroglutamate, benzoate, and hippurate. Elevated levels of hippurate and benzoate may indicate poor phase II detoxification via glycine conjugation. Orotate is also a measure of ammonia metabolism due to its role in the urea cycle.74 Abnormal levels of pyroglutamate can indicate an impairment of glutathione metabolism and a depleted glutathione status. A systematic review of 39 studies was conducted evaluating detoxification in ASD, specifically the glutathione metabolism pathways, and the review found evidence of an association between lower, reduced glutathione levels and ASD in children.75
Environmental toxins can dramatically alter the neurodevelopment of a child. Speculation has occurred that the increased trend of autism prevalence has coincided with an increase in environmental exposures to toxic substances, specifically herbicide glyphosate, aluminum adjuvants, and polybrominated diphenyl ethers.76 The Childhood Autism Risks from Genetics and Environment (CHARGE) study also demonstrated an association between close residential proximity to a freeway and ASD in children, suggesting an environmental risk factor from air pollution in the etiopathogenesis of ASD.77,78 Rossignol et al79 conducted a systematic review of 37 studies examining the association between toxin exposure and ASD risk. Although several studies had methodological issues, 34 of the 37 studies reported an association. Stronger evidence is needed to support the association of environmental toxin exposure with increased risk of ASD. This support is starting to be achieved through development of well-designed research trials that identify toxicant exposure in critical neurodevelopmental windows and evaluate the synergistic effects of multiple toxicant exposures and genetic risk.
Markers of Bacterial Metabolism
Only 3 of 7 patients in the current study had elevated urine markers of bacterial metabolism: para-hydroxybenzoate, para-hydroxyphenylacetate, 2-hydroxyphenylacetate, 3-indoleacetate, and tricarballylate. Although only a few patients exhibited elevated bacterial metabolites, the gut microbiome’s relationship to autism should be discussed because it is currently the subject of prodigious research in neuropsychiatric disorders. Several methods of assessing GI microbiome exist, varying from bacterial cultures and genome sequencing to urinary biomarkers. Urinary biomarkers may provide insights into function and imbalances in the gut microbiome, because a study by Smith and Macfarlane80 showed that gut microbiota form metabolic by-products in the human colon. Recent evidence has suggested the existence of abnormalities in the gut microbiome of children with ASD because many children suffer from GI symptoms.81,82 In a systematic review of 15 cross-sectional studies with small sample sizes, significant differences existed between ASD children and controls in the phyla, Firmicutes, Bacteroidetes, and Proteobacteria.83
The microbial ecosystem plays a crucial role in health and disease. Dysbiosis, a term used to describe a disruption in the natural balance of human microbial flora, can predispose individuals to chronic disease.84 The human body contains 100 trillion symbiotic microorganisms, of which the vast majority reside in the colon.85 Some compelling data, mostly from murine models, has shown that establishment of gut microbiota early in development can program mental health later in life.86,87 Evidence now exists that modulating microbial gut flora can alleviate the symptoms of autism.88 Use of a functional MRI has shown that probiotics affect brain activity that controls emotional processing and sensation.89 In addition, probiotics have been shown to produce microbial neurometabolites (eg, lactobacillus and bifidobacterium species produce GABA, and GABAergic signaling is disrupted in autism.)90 Studies of urinary markers of bacterial metabolism, in addition to GI fecal studies, may help to guide treatments, such as probiotics and antimicrobials.
IgG Food Antibodies and Autism
The current study has revealed that the majority of patients had IgG food antibodies to casein, a cow’s milk protein; egg whites; egg yolks; and peanuts. Although serological tests for IgG antibodies are considered irrelevant and represent immunologic sensitization only, food elimination therapy based on IgG testing has improved low-grade inflammation in patients with obesity and irritable bowel syndrome.91–93 Children with ASD and comorbidity of GI symptoms may be candidates for food elimination therapy based on IgG testing. Vojdani94 makes the argument that food sensitivity testing may be unreliable at certain laboratories, as most test for reactivity against raw food antigens and that IgG food testing should detect both raw and processed antigens.
Food sensitivity differs from food allergy in that the immunologic reaction is non-IgE mediated. Only a small portion (2%-3%) of adverse reactions to food proteins are IgE-mediated.95 In fact, cell-mediated immunity is more significantly involved in non-IgE food sensitivity.96 The most common food proteins that cause immune reactions in children include casein, soy, and wheat.96 Cell-mediated immunity to casein has been reported in younger children with ASD who have GI symptoms.97,98
Food sensitivities can cause fatigue, weakness, abdominal pain, bloating, nausea, vomiting, constipation, diarrhea, asthma, rhinitis, joint pain, skin disorders, disorganized or disturbed thinking and feeling, memory disturbances, and behavioral problems. From this list, a majority of the current study’s children with ASD exhibited behavioral problems, rhinitis, and diarrhea. These food sensitivities may contribute to the traits identified in autism.99
Limitations
The current study was an uncontrolled study of a small number of cases of ASD, and the results, although interesting, should at this stage be used only to design research that tests hypotheses and to inform potential investigative avenues in new clinical cases. Without normative, non-ASD data that are controlled for age, gender, and ethnicity for the positive tests, it is not possible to confirm that the current findings indicate changes specifically associated with ASD. Limitations of the current study include its small sample and missing data and, therefore, its inability to support analysis beyond descriptive statistics. Unfortunately, only 7 of 9 charts met the inclusion criterion of an official diagnosis of ASD. In addition, the charts were missing data, further limiting the descriptive analyses. Finally, the current research team initially aimed to track changes in the measured factors from pretreatment to posttreatment, but due to the limited sample size and missing posttreatment data, the team had to exclude such potentially informative analyses.
Conclusions
Several consistent observations can be made for the group of children with autism in the current study. In many cases, they had similar symptoms, past medical problems, and family histories, as well as abnormal nutritional and metabolic biomarkers. This small pilot study could not offer analyses of multivariate interrelations among the many factors measured in it. In addition, this fact that the current study was uncontrolled case study with missing data variables for the small number of cases limits any definite conclusions. However, such analyses could prove informative in the context of a multisite case control study; it would be of immense value to identify multiple factors involved in autism because no single risk factor is involved in the etiopathogenesis of all or even most cases of ASD. Due to the nature of retrospective chart reviews and small samples, a future case control study to evaluate a broad array of medical and biological variables with a suitably large sample of children with ASD could very well elucidate tightly linked metabolic and nutritional characteristics among the cases. Future payoff of such research would be improved understanding and, hence, enhanced management of ASD.
Acknowledgements
The research team would like to thank the general support of the faculty and staff at the University of Kansas Medical Center’s (KUMC’s) program in integrative medicine and of KUMC’s Department of Pediatrics and Department of Psychiatry, with special thanks to Merlin Butler, md, phd, who helped contribute ideas and discussion on future directions of associations with metabolic and genetic biomarkers in autism spectrum disorders.
Footnotes
Author Disclosure Statement
The authors received no support or funding for this study.
REFERENCES
- 1.Developmental Disabilities Monitoring Network Surveillance Year 2010 Principal Investigators; Centers for Disease Control and Prevention (CDC) Prevalence of autism spectrum disorder among children aged 8 years— autism and developmental disabilities monitoring network, 11 sites, United States, 2010. MMWR Surveill Summ. 2014;63(2):1–21. [PubMed] [Google Scholar]
- 2.Frye RE, Melnyk S, Macfabe DF. Unique acyl-carnitine profiles are potential biomarkers for acquired mitochondrial disease in autism spectrum disorder. Transl Psychiatry. 2013 Jan;3:e220. doi: 10.1038/tp.2012.143. [DOI] [PMC free article] [PubMed] [Google Scholar]
- 3.James SJ, Cutler P, Melnyk S, et al. Metabolic biomarkers of increased oxidative stress and impaired methylation capacity in children with autism. Am J Clin Nutr. 2004;80(6):1611–1617. doi: 10.1093/ajcn/80.6.1611. [DOI] [PubMed] [Google Scholar]
- 4.Jyonouchi H, Geng L, Cushing-Ruby A, Quraishi H. Impact of innate immunity in a subset of children with autism spectrum disorders: a case control study. J Neuroinflammation. 2008 Nov;5:52. doi: 10.1186/1742-2094-5-52. [DOI] [PMC free article] [PubMed] [Google Scholar]
- 5.Grabrucker AM. Environmental factors in autism. Front Psychiatry. 2013 Jan;3:118. doi: 10.3389/fpsyt.2012.00118. [DOI] [PMC free article] [PubMed] [Google Scholar]
- 6.Frustaci A, Neri M, Cesario A, et al. Oxidative stress-related biomarkers in autism: systematic review and meta-analyses. Free Radic Biol Med. 2012;52(10):2128–2141. doi: 10.1016/j.freeradbiomed.2012.03.011. [DOI] [PubMed] [Google Scholar]
- 7.Adams JB, Audhya T, McDonough-Means S, et al. Nutritional and metabolic status of children with autism vs neurotypical children, and the association with autism severity. Nutr Metab (Lond) 2011;8(1):34. doi: 10.1186/1743-7075-8-34. [DOI] [PMC free article] [PubMed] [Google Scholar]
- 8.Dhillon S, Hellings JA, Butler MG. Genetics and mitochondrial abnormalities in autism spectrum disorders: a review. Curr Genomics. 2011;12(5):322–332. doi: 10.2174/138920211796429745. [DOI] [PMC free article] [PubMed] [Google Scholar]
- 9.Mumper E. A call for action: recognizing and treating medical problems of children with autism. N Am J Med Sci (Boston) 2012;5(3):180–184. [Google Scholar]
- 10.Cubala-Kucharska M. The review of most frequently occurring medical disorders related to aetiology of autism and the methods of treatment. Acta Neurobiol Exp (Wars) 2010;70(2):141–146. doi: 10.55782/ane-2010-1786. [DOI] [PubMed] [Google Scholar]
- 11.Rossignol DA, Frye RE. A review of research trends in physiological abnormalities in autism spectrum disorders: immune dysregulation, inflammation, oxidative stress, mitochondrial dysfunction and environmental toxicant exposures. Mol Psychiatry. 2012;17(4):389–401. doi: 10.1038/mp.2011.165. [DOI] [PMC free article] [PubMed] [Google Scholar]
- 12.Rossignol DA, Frye RE. Mitochondrial dysfunction in autism spectrum disorders: a systematic review and meta-analysis. Mol Psychiatry. 2012;17(3):290–314. doi: 10.1038/mp.2010.136. [DOI] [PMC free article] [PubMed] [Google Scholar]
- 13.Holick MF, Binkley NC, Bischoff-Ferrari HA, et al. Evaluation, treatment and prevention of vitamin D deficiency: an Endocrine Society clinical practice guideline. J Clin Endocrinol Metab. 2011;96(7):1911–1930. doi: 10.1210/jc.2011-0385. [DOI] [PubMed] [Google Scholar]
- 14.Li SO, Wang JL, Bjørklund G, Zhao WN, Yin CH. Serum copper and zinc levels in individuals with autism spectrum disorders. Neuroreport. 2014;25(15):1216–1220. doi: 10.1097/WNR.0000000000000251. [DOI] [PubMed] [Google Scholar]
- 15.Opazo CM, Greenough MA, Bush AI. Copper: from neurotransmission to neuroproteostasis. Front Aging Neurosci. 2014 Jul;6:143. doi: 10.3389/fnagi.2014.00143. [DOI] [PMC free article] [PubMed] [Google Scholar]
- 16.Lazarchick J. Update on anemia and neutropenia in copper deficiency. Curr Opin Hematol. 2012;19(1):58–60. doi: 10.1097/MOH.0b013e32834da9d2. [DOI] [PubMed] [Google Scholar]
- 17.Rosencrantz R, Schilsky M. Wilson disease: pathogenesis and clinical considerations in diagnosis and treatment. Semin Liver Dis. 2011;31(3):245–259. doi: 10.1055/s-0031-1286056. [DOI] [PubMed] [Google Scholar]
- 18.Choo XY, Alukaidey L, White AR, Grubman A. Neuroinflammation and copper in Alzheimer’s disease. Int J Alzheimers Dis. 2013;2013:145345. doi: 10.1155/2013/145345. [DOI] [PMC free article] [PubMed] [Google Scholar]
- 19.Chauhan A, Ashfaq M. Increased copper-mediated oxidation of membrane phosphatidylethanolamine in autism. Am J Biochem Biotechnol. 2008;4(2):95–100. [Google Scholar]
- 20.Prasad AS. Discovery of human zinc deficiency: 50 years later. J Trace Elem Med Biol. 2012;26(2–3):66–69. doi: 10.1016/j.jtemb.2012.04.004. [DOI] [PubMed] [Google Scholar]
- 21.Prasad AS, Beck FW, Bao B, Snell D, Fitzgerald JT. Duration and severity of symptoms and levels of plasma interleukin-1 receptor antagonist, soluble tumor necrosis factor receptor, and adhesion molecule in patients with common cold treated with zinc acetate. J Infect Dis. 2008;197(6):795–802. doi: 10.1086/528803. [DOI] [PubMed] [Google Scholar]
- 22.Prasad AS. Impact of the discovery of human zinc deficiency on health. J Trace Elem Med Biol. 2014;28(4):357–363. doi: 10.1016/j.jtemb.2014.09.002. [DOI] [PubMed] [Google Scholar]
- 23.Ninh NX, Thissen JP, Collette L, Gerard G, Khoi HH, Ketelslegers JM. Zinc supplementation increases growth and circulating insulin-like growth factor I (IGF-1) in growth-retarded Vietnamese children. Am J Clin Nutr. 1996;63(4):514–519. doi: 10.1093/ajcn/63.4.514. [DOI] [PubMed] [Google Scholar]
- 24.MacDonald RS. The role of zinc in growth and cell proliferation. J Nutr. 2000;130(5S) suppl:1500S–1508S. doi: 10.1093/jn/130.5.1500S. [DOI] [PubMed] [Google Scholar]
- 25.Nishi Y. Zinc and growth. J Am Coll Nutr. 1996;15(4):340–344. doi: 10.1080/07315724.1996.10718608. [DOI] [PubMed] [Google Scholar]
- 26.Bitanihirwe BK, Cunningham MG. Zinc: the brain’s dark horse. Synapse. 2009;63(11):1029–1049. doi: 10.1002/syn.20683. [DOI] [PubMed] [Google Scholar]
- 27.Walsh WJ, Isaacson HR, Rehman F, Hall A. Elevated blood copper/zinc ratios in assaultive young males. Physiol Behav. 1997;62(2):327–329. doi: 10.1016/s0031-9384(97)88988-3. [DOI] [PubMed] [Google Scholar]
- 28.Malavolta M, Giacconi R, Piacenza F, et al. Plasma copper/zinc ratio: an inflammatory/nutritional biomarker as predictor of all-cause mortality in elderly population. Biogerontology. 2010;11(3):309–319. doi: 10.1007/s10522-009-9251-1. [DOI] [PubMed] [Google Scholar]
- 29.Norman AW. From vitamin D to hormone D: fundamentals of the vitamin D endocrine system essential for good health. Am J Clin Nutr. 2008;88(2):491S–499S. doi: 10.1093/ajcn/88.2.491S. [DOI] [PubMed] [Google Scholar]
- 30.Grant WB, Cannell JJ. Autism prevalence in the United States with respect to solar UV-B doses: an ecological study. Dermatoendocrinol. 2013;5(1):159–164. doi: 10.4161/derm.22942. [DOI] [PMC free article] [PubMed] [Google Scholar]
- 31.Grant WB, Soles CM. Epidemiologic evidence supporting the role of maternal vitamin D deficiency as a risk factor for the development of infantile autism. Dermatoendocrinol. 2009;1(4):223–228. doi: 10.4161/derm.1.4.9500. [DOI] [PMC free article] [PubMed] [Google Scholar]
- 32.Eyles DW, Feron F, Cui X, et al. Developmental vitamin D deficiency causes abnormal brain development. Psychoneuroendocrinology. 2009;34(suppl 1):S247–S257. doi: 10.1016/j.psyneuen.2009.04.015. [DOI] [PubMed] [Google Scholar]
- 33.Eyles DW, Burne TH, McGrath JJ. Vitamin D, effects on brain development, adult brain function and the links between low levels of vitamin D and neuropsychiatric disease. Front Neuroendocrinol. 2013;34(1):47–64. doi: 10.1016/j.yfrne.2012.07.001. [DOI] [PubMed] [Google Scholar]
- 34.Harms LR, Burne TH, Eyles DW, McGrath JJ. Vitamin D and the brain. Best Pract Res Clin Endocrinol Metab. 2011;25(4):657–669. doi: 10.1016/j.beem.2011.05.009. [DOI] [PubMed] [Google Scholar]
- 35.Holmlund-Suila E, Koskivirta P, Metso T, Andersson S, Mäkitie O, Viljakainen HT. Vitamin D deficiency in children with a chronic illness-seasonal and age-related variations in serum 25-hydroxy vitamin D concentrations. PLoS One. 2013;8(4):e60856. doi: 10.1371/journal.pone.0060856. [DOI] [PMC free article] [PubMed] [Google Scholar]
- 36.Meguid NA, Hashish AF, Anwar M, Sidhom G. Reduced serum levels of 25-hydroxy and 1,25-dihydroxy vitamin D in Egyptian children with autism. J Altern Complement Med. 2010;16(6):641–645. doi: 10.1089/acm.2009.0349. [DOI] [PubMed] [Google Scholar]
- 37.Mostafa GA, Al-Ayadhi LY. Reduced serum concentrations of 25-hydroxy vitamin D in children with autism: relation to autoimmunity. J Neuroinflammation. 2012 Aug;9:201. doi: 10.1186/1742-2094-9-201. [DOI] [PMC free article] [PubMed] [Google Scholar]
- 38.Gong ZL, Luo CM, Wang L, et al. Serum 25-hydroxyvitamin D levels in Chinese children with autism spectrum disorders. Neuroreport. 2014;25(1):23–27. doi: 10.1097/WNR.0000000000000034. [DOI] [PubMed] [Google Scholar]
- 39.Molloy CA, Kalkwarf HJ, Manning-Courtney P, Mills JL, Hediger ML. Plasma 25(OH)D concentration in children with autism spectrum disorder. Dev Med Child Neurol. 2010;52(10):969–971. doi: 10.1111/j.1469-8749.2010.03704.x. [DOI] [PMC free article] [PubMed] [Google Scholar]
- 40.Cannell JJ. Autism, will vitamin D treat core symptoms? Med Hypotheses. 2013;81(2):195–198. doi: 10.1016/j.mehy.2013.05.004. [DOI] [PubMed] [Google Scholar]
- 41.Cui X, Pelekanos M, Liu PY, Burne TH, McGrath JJ, Eyles DW. The vitamin D receptor in dopamine neurons; its presence in human substantia nigra and its ontogenesis in rat midbrain. Neuroscience. 2013 Apr;236:77–87. doi: 10.1016/j.neuroscience.2013.01.035. [DOI] [PubMed] [Google Scholar]
- 42.Chugani DC. Neuroimaging and neurochemistry of autism. Pediatr Clin North Am. 2012;59(1):63–73. doi: 10.1016/j.pcl.2011.10.002. [DOI] [PubMed] [Google Scholar]
- 43.Patrick RP, Ames BN. Vitamin D hormone regulates serotonin synthesis, I: relevance for autism. FASEB J. 2014;28(6):2398–2413. doi: 10.1096/fj.13-246546. [DOI] [PubMed] [Google Scholar]
- 44.Boccuto L, Chen CF, Pittman AR, et al. Decreased tryptophan metabolism in patients with autism spectrum disorders. Mol Autism. 2013;4(1):16. doi: 10.1186/2040-2392-4-16. [DOI] [PMC free article] [PubMed] [Google Scholar]
- 45.Chugani DC, Muzik O, Behen M, et al. Developmental changes in brain serotonin synthesis capacity in autistic and nonautistic children. Ann Neurol. 1999;45(3):287–295. doi: 10.1002/1531-8249(199903)45:3<287::aid-ana3>3.0.co;2-9. [DOI] [PubMed] [Google Scholar]
- 46.Cannell JJ, Grant WB. What is the role of vitamin D in autism? Dermatoendocrinol. 2013;5(1):199–204. doi: 10.4161/derm.24356. [DOI] [PMC free article] [PubMed] [Google Scholar]
- 47.Lord RS, Bralley JA, editors. Laboratory Evaluations for Integrative and Functional Medicine. 2nd ed. Duluth, GA: Metametrix Institute; 2008. [Google Scholar]
- 48.Culotta VC, Yang M, O’Halloran TV. Activation of superoxide dismutases: putting the metal to the pedal. Biochim Biophys Acta. 2006;1763(7):747–758. doi: 10.1016/j.bbamcr.2006.05.003. [DOI] [PMC free article] [PubMed] [Google Scholar]
- 49.Nahon P, Charnaux N, Friand V, et al. The manganese superoxide dismutase Ala16Val dimorphism modulates iron accumulation in human hepatoma cells. Free Radic Biol Med. 2008;45(9):1308–1317. doi: 10.1016/j.freeradbiomed.2008.08.011. [DOI] [PubMed] [Google Scholar]
- 50.Sutton A, Khoury H, Prip-Buus C, Cepanec C, Pessayre D, Degoul F. The Ala16Val genetic dimorphism modulates the import of human manganese superoxide dismutase into rat liver mitochondria. Pharmacogenetics. 2003;13(3):145–157. doi: 10.1097/01.fpc.0000054067.64000.8f. [DOI] [PubMed] [Google Scholar]
- 51.Tuschl K, Mills PB, Clayton PB. Manganese and the brain. Int Rev Neurobiol. 2013;110:277–312. doi: 10.1016/B978-0-12-410502-7.00013-2. [DOI] [PubMed] [Google Scholar]
- 52.Zhang F, Xu Z, Gao J, Xu B, Deng Y. In vitro effect of manganese chloride exposure on energy metabolism and oxidative damage of mitochondria isolated from rat brain. Environ Toxicol Pharmacol. 2008;26(2):232–236. doi: 10.1016/j.etap.2008.04.003. [DOI] [PubMed] [Google Scholar]
- 53.Khan K, Wasserman GA, Liu X, et al. Manganese exposure from drinking water and children’s academic achievement. Neurotoxicology. 2012;33(1):91–97. doi: 10.1016/j.neuro.2011.12.002. [DOI] [PMC free article] [PubMed] [Google Scholar]
- 54.Brenna JT, Carlson SE. Docosahexaenoic acid and human brain development: evidence that a dietary supply is needed for optimal development. J Hum Evol. 2014 Dec;77:99–106. doi: 10.1016/j.jhevol.2014.02.017. [DOI] [PubMed] [Google Scholar]
- 55.van Elst K, Bruining H, Birtoli B, Terreaux C, Buitelaar JK, Kas MJ. Food for thought: dietary changes in essential fatty acid ratios and the increase in autism spectrum disorders. Neurosci Biobehav Rev. 2014 Sep;45:369–378. doi: 10.1016/j.neubiorev.2014.07.004. [DOI] [PubMed] [Google Scholar]
- 56.Strickland AD. Prevention of cerebral palsy, autism spectrum disorder, and attention deficit-hyperactivity disorder. Med Hypotheses. 2014;82(5):522–528. doi: 10.1016/j.mehy.2014.02.003. [DOI] [PubMed] [Google Scholar]
- 57.Simopoulos AP. Evolutionary aspects of diet: the omega-6/omega-3 ratio and the brain. Mol Neurobiol. 2011;44(2):203–215. doi: 10.1007/s12035-010-8162-0. [DOI] [PubMed] [Google Scholar]
- 58.Vancassel S, Durand G, Barthélémy C, et al. Plasma fatty acid levels in autistic children. Prostaglandins Leukot Essent Fatty Acids. 2001;65(1):1–7. doi: 10.1054/plef.2001.0281. [DOI] [PubMed] [Google Scholar]
- 59.Ghezzo A, Visconti P, Abruzzo PM, et al. Oxidative stress and erythrocyte membrane alterations in children with autism: correlation with clinical features. PLoS One. 2013;8(6):e66418. doi: 10.1371/journal.pone.0066418. [DOI] [PMC free article] [PubMed] [Google Scholar]
- 60.Fombonne E, Morel J, MacArthur J. No autism amongst Inuits from Northern Quebec?. Paper presented at: Fifth International Meeting for Autism Research (IMFAR); June 1–3 2006; Montreal, Quebec. [Google Scholar]
- 61.Wenstrom KD. The FDA’s new advice on fish: it’s complicated. Am J Obstet Gynecol. 2014;211(5):475–478.e1. doi: 10.1016/j.ajog.2014.07.048. [DOI] [PubMed] [Google Scholar]
- 62.US Food and Drug Administration; Environmental Protection Agency. Fish: what pregnant women and parents should know. [Accessed October 12, 2014]. http://www.fda.gov/Food/FoodborneIllnessContaminants/Metals/ucm393070.htm Updated July 11, 2014.
- 63.Bloomingdale A, Guthrie LB, Price S, et al. A qualitative study of fish consumption during pregnancy. Am J Clin Nutr. 2010;92(5):1234–1240. doi: 10.3945/ajcn.2010.30070. [DOI] [PMC free article] [PubMed] [Google Scholar]
- 64.US Dept of Agriculture; US Dept of Health and Human Services. Dietary Guidelines for Americans, 2010. 7th ed. Washington, DC: US Dept of Agriculture and US Dept of Health and Human Services; 2010. [Google Scholar]
- 65.Campoy C, Escolano-Margarit MV, Anjos T, Szajewska H, Uauy R. Omega-3 fatty acids on child growth, visual acuity and neurodevelopment. Br J Nutr. 2012;107(suppl 2):S85–S106. doi: 10.1017/S0007114512001493. [DOI] [PubMed] [Google Scholar]
- 66.Meguid NA, Atta HM, Gouda AS, Khalil RO. Role of polyunsaturated fatty acids in the management of Egyptian children with autism. Clin Biochem. 2008;41(13):1044–1048. doi: 10.1016/j.clinbiochem.2008.05.013. [DOI] [PubMed] [Google Scholar]
- 67.James S, Montgomery P, Williams K. Omega-3 fatty acids supplementation for autism spectrum disorders (ASD) Cochrane Database Syst Rev. 2011;(11):CD007992. doi: 10.1002/14651858.CD007992.pub2. [DOI] [PubMed] [Google Scholar]
- 68.Colombo J, Carlson SE, Cheatham CL, Fitzgerald-Gustafson KM, Kepler A, Doty T. Long-chain polyunsaturated fatty acid supplementation in infancy reduces heart rate and positively affects distribution of attention. Pediatr Res. 2011;70(4):406–410. doi: 10.1203/PDR.0b013e31822a59f5. [DOI] [PMC free article] [PubMed] [Google Scholar]
- 69.McNamara RK, Carlson SE. Role of omega-3 fatty acids in brain development and function: potential implications for the pathogenesis and prevention of psychopathology. Prostaglandins Leukot Essent Fatty Acids. 2006;75(4–5):329–349. doi: 10.1016/j.plefa.2006.07.010. [DOI] [PubMed] [Google Scholar]
- 70.Tew KD, Townsend DM. Regulatory functions of glutathione S-transferase P1-1 unrelated to detoxification. Drug Metab Rev. 2011;43(2):179–193. doi: 10.3109/03602532.2011.552912. [DOI] [PMC free article] [PubMed] [Google Scholar]
- 71.James SJ, Melnyk S, Jernigan S, et al. Metabolic endophenotype and related genotypes are associated with oxidative stress in children with autism. Am J Med Genet B Neuropsychiatr Genet. 2006;141B(8):947–956. doi: 10.1002/ajmg.b.30366. [DOI] [PMC free article] [PubMed] [Google Scholar]
- 72.Serajee FJ, Nabi R, Zhong H, Huq M. Polymorphisms in xenobiotic metabolism genes and autism. J Child Neurol. 2004;19(6):413–417. doi: 10.1177/088307380401900603. [DOI] [PubMed] [Google Scholar]
- 73.Sutton A, Imbert A, Igoudjil A, et al. The manganese superoxide dismutase Ala16Val dimorphism modulates both mitochondrial import and mRNA stability. Pharmacogenet Genomics. 2005;15(5):311–319. doi: 10.1097/01213011-200505000-00006. [DOI] [PubMed] [Google Scholar]
- 74.Lord RS, Bralley JA. Clinical applications of urinary organic acids, I: detoxification markers. Altern Med Rev. 2008;13(3):205–215. [PubMed] [Google Scholar]
- 75.Main PA, Angley MT, O’Doherty CE, Thomas P, Fenech M. The potential role of the antioxidant and detoxification properties of glutathione in autism spectrum disorders: a systematic review and meta-analysis. Nutr Metab (Lond) 2012 Apr;9:35. doi: 10.1186/1743-7075-9-35. [DOI] [PMC free article] [PubMed] [Google Scholar]
- 76.Nevison CD. A comparison of temporal trends in United States autism prevalence to trends in suspected environmental factors. Environ Health. 2014 Sep;13:73. doi: 10.1186/1476-069X-13-73. [DOI] [PMC free article] [PubMed] [Google Scholar]
- 77.Volk HE, Hertz-Picciotto I, Delwiche L, Lurmann F, McConnell R. Residential proximity to freeways and autism in the CHARGE study. Environ Health Perspect. 2011;119(6):873–877. doi: 10.1289/ehp.1002835. [DOI] [PMC free article] [PubMed] [Google Scholar]
- 78.Volk HE, Lurmann F, Penfold B, Hertz-Picciotto I, McConnell R. Traffic-related air pollution, particulate matter, and autism. JAMA Psychiatry. 2013;70(1):71–77. doi: 10.1001/jamapsychiatry.2013.266. [DOI] [PMC free article] [PubMed] [Google Scholar]
- 79.Rossignol DA, Genuis SJ, Frye RE. Environmental toxicants and autism spectrum disorders: a systematic review. Trans Psychiatry. 2014 Feb;4:e360. doi: 10.1038/tp.2014.4. [DOI] [PMC free article] [PubMed] [Google Scholar]
- 80.Smith EA, Macfarlane GT. Formation of phenolic and indolic compounds by anaerobic bacteria in the human large intestine. Microb Ecol. 1997;33(3):180–188. doi: 10.1007/s002489900020. [DOI] [PubMed] [Google Scholar]
- 81.McElhanon BO, McCracken C, Karpen S, Sharp WG. Gastrointestinal symptoms in autism spectrum disorder: a meta-analysis. Pediatrics. 2014;133(5):872–883. doi: 10.1542/peds.2013-3995. [DOI] [PubMed] [Google Scholar]
- 82.Mayer EA, Padua D, Tillisch K. Altered brain-gut axis in autism: comorbidity or causative mechanisms? Bioessays. 2014;36(10):933–939. doi: 10.1002/bies.201400075. [DOI] [PubMed] [Google Scholar]
- 83.Cao X, Lin P, Jiang P, Li C. Characteristics of the gastrointestinal microbiome in children with autism spectrum disorder: a systematic review. Shanghai Arch Psychiatry. 2013;25(6):342–353. doi: 10.3969/j.issn.1002-0829.2013.06.003. [DOI] [PMC free article] [PubMed] [Google Scholar]
- 84.Petrof EO, Claud EC, Gloor GB, Allen-Vercoe E. Microbial ecosystems therapeutics: a new paradigm in medicine? Benef Microbes. 2013;4(1):53–65. doi: 10.3920/BM2012.0039. [DOI] [PubMed] [Google Scholar]
- 85.Whitman WB, Coleman DC, Wiebe WJ. Prokaryotes: the unseen majority. Proc Natl Acad Sci U S A. 1998;95(12):6578–6583. doi: 10.1073/pnas.95.12.6578. [DOI] [PMC free article] [PubMed] [Google Scholar]
- 86.Diaz Heijtz R, Wang S, Anuar F, et al. Normal gut microbiota modulates brain development and behavior. Proc Natl Acad Sci U S A. 2011;108(7):3047–3052. doi: 10.1073/pnas.1010529108. [DOI] [PMC free article] [PubMed] [Google Scholar]
- 87.de Theije CG, Wopereis H, Ramadan M, et al. Altered gut microbiota in a murine model of autism spectrum disorders. Brain Behav Immun. 2014 Mar;37:197–206. doi: 10.1016/j.bbi.2013.12.005. [DOI] [PubMed] [Google Scholar]
- 88.Parracho HM, Gibson GR, Knott F, Bosscher D, Kleerebezem M, McCartney AL. A double-blind, placebo-controlled, crossover-designed probiotic feeding study in children diagnosed with autistic spectrum disorders. Int J Probiotics Prebiotics. 2010;5(2):69–74. [Google Scholar]
- 89.Tillisch K, Labus J, Kilpatrick L, et al. Consumption of fermented milk product with probiotic modulates brain activity. Gastroenterology. 2013;144(7):1394–1401. doi: 10.1053/j.gastro.2013.02.043. [DOI] [PMC free article] [PubMed] [Google Scholar]
- 90.Barrett E, Ross RP, O’Toole PW, Fitzgerald GF, Stanton C. γ-Aminobutyric acid production by culturable bacteria from the human intestine. J Appl Microbiol. 2012;113(2):411–417. doi: 10.1111/j.1365-2672.2012.05344.x. [DOI] [PubMed] [Google Scholar]
- 91.Stapel SO, Asero R, Ballmer-Weber BK, et al. Testing for IgG4 against foods is not recommended as a diagnostic tool: EAACI Task Force Report. Allergy. 2008;63(7):793–796. doi: 10.1111/j.1398-9995.2008.01705.x. [DOI] [PubMed] [Google Scholar]
- 92.Wilders-Truschnig M, Mangge H, Lieners C, Gruber H, Mayer C, März W. IgG antibodies against food antigens are correlated with inflammation and intima media thickness in obese juveniles. Exp Clin Endocrinol Diabetes. 2008;116(4):241–245. doi: 10.1055/s-2007-993165. [DOI] [PubMed] [Google Scholar]
- 93.Atkinson W, Sheldon TA, Shaath N, Whorwell PJ. Food elimination based on IgG antibodies in irritable bowel syndrome: a randomised controlled trial. Gut. 2004;53(10):1459–1464. doi: 10.1136/gut.2003.037697. [DOI] [PMC free article] [PubMed] [Google Scholar]
- 94.Vojdani A. Detection of IgE, IgG, IgA and IgM antibodies against raw and processed food antigens. Nutr Metab (Lond) 2009 May;6:22. doi: 10.1186/1743-7075-6-22. [DOI] [PMC free article] [PubMed] [Google Scholar]
- 95.Turnbull JL, Adams HN, Gorard DA. Review article: the diagnosis and management of food allergy and food intolerances [published online ahead of print October 14, 2014] Aliment Pharmacol Ther. 2015;41(1):3–25. doi: 10.1111/apt.12984. [DOI] [PubMed] [Google Scholar]
- 96.Sampson HA, Anderson JA. Summary and recommendations: classification of gastrointestinal manifestations due to immunologic reactions to foods in infants and young children. J Pediatr Gastroenterol Nutr. 2000;30(suppl):S87–S94. doi: 10.1097/00005176-200001001-00013. [DOI] [PubMed] [Google Scholar]
- 97.Jyonouchi H. Food allergy and autism spectrum disorders: is there a link? Curr Allergy Asthma Rep. 2009;9(3):194–201. doi: 10.1007/s11882-009-0029-y. [DOI] [PubMed] [Google Scholar]
- 98.Jyonouchi H, Geng L, Ruby A, Reddy C, Zimmerman-Bier B. Evaluation of an association between gastrointestinal symptoms and cytokine production against common dietary proteins in children with autism spectrum disorders. J Pediatr. 2005;146(5):605–610. doi: 10.1016/j.jpeds.2005.01.027. [DOI] [PubMed] [Google Scholar]
- 99.Mullin GE, Swift KM, Lipski L, Turnbull LK, Rampertab SD. Testing for food reactions: the good, the bad, and the ugly. Nutr Clin Pract. 2010;25(2):192–198. doi: 10.1177/0884533610362696. [DOI] [PubMed] [Google Scholar]