

Abstract
Objectives. We evaluated the overall and sociodemographic disparities in trends in prevalence of childhood overweight and obesity in Massachusetts public school districts between 2009 and 2014.
Methods. In 2009, Massachusetts mandated annual screening of body mass index for students in grades 1, 4, 7, and 10. This was part of the statewide Mass in Motion prevention programs. We assessed trends in the prevalence of overweight and obesity between 2009 and 2014 by district, gender, grade, and district income.
Results. From 2009 to 2014, prevalence decreased 3.0 percentage points (from 34.3% to 31.3%) statewide. The 2014 district-level rates ranged from 13.9% to 54.5% (median = 31.2%). When stratified by grade, the decreasing trends were significant only for grades 1 and 4. Although rates of districts with a median household income greater than $37 000 improved notably, rates of the poorest remain unchanged and were approximately 40%.
Conclusions. Although overall prevalence began to decrease, the geographic and socioeconomic disparities in childhood obesity are widening and remain a public health challenge in Massachusetts. Special efforts should be made to address the needs of socioeconomically disadvantaged districts and to narrow the disparities in childhood obesity.
Childhood obesity has been associated with chronic diseases such as hypertension, cardiovascular disease earlier in life,1–4 asthma, and sleep apnea.2,3,5 Many of these health risks continue well into adulthood, contributing to the higher risks for multiple chronic diseases, all-cause mortality, and premature death.4–8 Although a few studies have reported limited success in childhood obesity control,8,9 reducing the prevalence of overweight and obesity among children and adolescents remains a critically important public health endeavor in the United States.
In response to growing concerns over childhood obesity, in 2003, the American Academy of Pediatrics released a policy statement advising that body mass index (BMI) be routinely assessed and tracked over time.10 In 2005, the Institute of Medicine recommended that all school systems develop a BMI measurement program and track their students annually. The Institute of Medicine also called on the federal government to create guidance documents for the development of these state programs.11 Since then, 20 states have developed BMI screening or body composition assessment programs.12
In April 2009, the Massachusetts Public Health Council unanimously approved the state’s first BMI screening regulations as a key component of the state’s Mass in Motion initiative. Mass in Motion programs use community-based environmental approaches to promote healthy eating and active living at home, at work, and in communities throughout the state. The goal is to prevent overweight and obesity in all segments of the population.
The state’s BMI screening regulation requires all public school districts to measure students’ height and weight, by the school nurse or other trained staff, of all students in grades 1, 4, 7, and 10 annually and report aggregate data to the Massachusetts Department of Public Health (MDPH). Before the 2013–2014 school year, the results of the screening were directly and confidentially communicated to the parents or guardians of each student. Starting in 2013–2014, notifications to parents were no longer required, although they could be done at the discretion of the local school district.
Using the data collected between the 2008–2009 and 2013–2014 school years, we assessed the overall and district-level variations in trends in the prevalence of childhood overweight and obesity. These data were used to inform the state’s future efforts on prevention of childhood overweight and obesity. Furthermore, we examined the trends in childhood overweight and obesity by district-level income to inform the state’s efforts to reduce disparities in childhood obesity.
METHODS
As mandated by a state regulation, Massachusetts educational organizations screened BMI for students in grades 1, 4, 7, and 10 annually beginning with the 2008–2009 school year through the 2013–2014 school year. Organizations submitting data included local public school districts, academic regional school districts, school unions, vocational–technical regional school districts, agricultural school districts, charter school districts, and educational collaboratives. We excluded data from private schools. Throughout this article, we used the term public school “district” to represent these organizations.
School nurses or trained staff measured the height and weight of public school students in grades 1, 4, 7, and 10 and recorded the information. Although these data were generally recorded in computer databases containing student health records, some data were recorded on paper and summarized later. Each child’s BMI was calculated as weight in kilograms divided by the square of height in meters. For children younger than 18 years, the BMI score for a child can be plotted on the Centers for Disease Control and Prevention BMI for age growth chart13 to determine the child’s percentile ranking among children of the same age and gender. The BMI-for-age percentile is used to classify a child’s weight status as obese (≥ 95th percentile), overweight (≥ 85th and < 95th percentile), healthy weight (≥ 5th and < 85th percentile), or underweight (< 5th percentile).
A BMI calculator embedded in computerized health records accessible by school nurses automatically calculated each child’s BMI and healthy weight status according to the most recent child growth charts established by the Centers for Disease and Control and Prevention.13 In schools where computerized health records were not available, MDPH distributed a customized version of a Centers for Disease Control and Prevention–developed Excel (Microsoft, Redmond, WA) BMI calculator to facilitate data collection.14 Schools lacking computer access used a BMI wheel or BMI chart to determine the BMI percentile. The BMI percentiles were calculated by each school nurse or by a data analyst employed by the district. This information was then gathered and tabulated into an aggregate district-wide report, and sent to MDPH. To ensure the results would be representative of the students in their district, nurses were asked to complete BMI screenings on all students whose parents did not opt out of the screening. Fewer than 2% of parents opted out on behalf of their children.
Quality assurance was conducted at multiple levels. The first level of data quality assessment was performed at the school district level and usually occurred before the data report was submitted to MDPH. When the nurse leaders or district data analysts assembled the data from each school, they reviewed the results from each school and followed up on any reported unusual results. At MDPH, a second level of screening was performed that focused on identifying results that were outside the known or expected ranges. Data reports were screened by identifying districts that submitted data for more students than were enrolled in the district, or by identifying districts that submitted results that were far outside the typical range for the weight category. We also screened for evidence of issues with form completion. A third level of quality assurance involved performing consistency checks, which included identifying variations in results submitted by the same district across several years. We excluded those records of a given year that differed by more than 10% in the prevalence rates compared with data of the 2 most adjacent years. In addition, we restricted our analysis to data from districts that had at least 3 years of data and at least 100 BMI records between the 2008–2009 and 2013–2014 school years.
District Characteristics
Information on district characteristics was obtained from Massachusetts Department of Elementary and Secondary Education. We categorized district median annual household income as less than $37 000, $37 000 to $44 000, $44 001 to $54 000, and greater than $54 000. We included other district characteristics: numbers and percentages of students who were White, Black, Asian, Hispanic, or other race/ethnicity; who were from a low-income family or guardianship; who received a reduced or free lunch; whose first language was not English; and who were learning English.
Geographic information system data layers of school districts were obtained from the Massachusetts Office of Geographic Information.
Statistical Analysis
We calculated the numbers of overweight or obese students, the total numbers of screened students, and the prevalence rates by school district, gender, grade, district-level median household income category, and report year. We examined the distributional characteristics of district-level prevalence rates using univariate kernel density estimates and graphs, overall and by grade.
We estimated the rate ratios (RRs) of the reporting year as a measure of the temporal trend using mixed-effects Poisson regression models, with and without adjustment for district median household income, grade, percentage of male students, grade by gender interaction, and race/ethnicity. We treated each district as an independent unit. We prescribed the random intercept and slope over the year of the report at the district level. We also made adjustments to account for district-level variations in the percentages of students on a free or reduced lunch, who were from a low-income family, who were a racial/ethnic minority, whose first language was not English, or who were learning English. Our analysis assumed a linear trend over the year. We could not examine nonlinear trends because of the limited number of years of data collection. In addition, we restricted our trend analysis for each gender by grade group to districts with at least 50 records over a minimum of 3 years of data. We tested the equivalence of temporal trends by select subgroups (e.g., gender by grade) using the likelihood ratio test. In addition, we examined 3-year changes in the prevalence for the first, fourth, and seventh graders when they advanced to grades 4, 7, and 10, respectively.
We carried out all statistical analyses using Stata version 13.1 (Stata Corp, College Station, TX). We generated maps for 2014 district-level prevalence and temporal trends using ArcGIS version 10.2 (ESRI, Redlands, CA). We included maps for all grades combined.
RESULTS
In total, 275 public school districts reported at least 3 years of data and 100 or more BMI records between the 2008–2009 and 2013–2014 school years. Student profiles of the districts varied greatly with respect to racial/ethnic compositions (percentage of racial minorities ranged from 1% to 99.7%), first language (percentage of student whose first language was not English ranged from 0% to 87%), disability (percentage with any disability ranged from 3.6% to 49.7%), and socioeconomic status (percentage of students from low-income families or guardians ranged from 1% to 92% and percentage of students receiving free lunch ranged from 1% to 86%). More information on district characteristics is available as a supplement to this article at http://www.ajph.org.
The data under analysis included 1 268 770 BMI records, 647 569 records for boys, 621 201 for girls, and 327 335, 329 493, 320 460, and 291 482 records for grades 1, 4, 7, and 10, respectively. The screening rate ranged from 38% in the 2008–2009 school year to 84% in the 2013–2014 school year.
Temporal Trends
Overall, statewide prevalence rates of overweight and obesity decreased 3.0 percentage points from 34.3% in 2009 to 31.3% in 2014 (P < .001). Rates of overweight and obesity in boys were higher than those of girls during the study period (33.7% vs 30.7%; P < .001). Boys had slightly larger decreases than girls (3.3 vs 2.7 percentage points; P < .05).
As shown in Table 1, rates of overweight and obesity were lowest among the first graders and highest among the fourth and seventh graders. From 2009 to 2014, rate reductions were the largest among fourth graders followed by the first and seventh graders (4.8, 4.2, and 2.7 percentage points, respectively). However, there were no notable changes among the 10th graders.
TABLE 1—
Prevalence Rates of Childhood Overweight and Obesity by Gender, Grade, and Year in Massachusetts Public School Districts: 2009–2014
| Boys |
Girls |
Overall |
||||
| Grade by Year | Rate (95% CI) | Change | Rate (95% CI) | Change | Rate (95% CI) | Change |
| Grade 1 | ||||||
| 2009 | 32.5 (31.6, 33.3) | (Ref) | 30.7 (29.9, 31.5) | (Ref) | 31.6 (31.0, 32.2) | (Ref) |
| 2010 | 30.7 (30.0, 31.4) | −1.8 | 28.9 (28.2, 29.6) | −1.8 | 29.8 (29.3, 30.3) | −1.8 |
| 2011 | 29.1 (28.5, 29.7) | −3.4 | 27.3 (26.7, 27.9) | −3.4 | 28.2 (27.8, 28.6) | −3.4 |
| 2012 | 28.4 (27.8, 29.0) | −4.1 | 27.1 (26.5, 27.7) | −3.6 | 27.8 (27.4, 28.2) | −3.8 |
| 2013 | 28.4 (27.8, 29.0) | −4.1 | 27.1 (26.6, 27.7) | −3.6 | 27.8 (27.4, 28.2) | −3.8 |
| 2014 | 28.0 (27.4, 28.6) | −4.5 | 26.8 (26.2, 27.4) | −3.9 | 27.4 (27.0, 27.8) | −4.2 |
| Total | 29.2 (28.9, 29.5) | 27.7 (27.5, 28.0) | 28.5 (28.3, 28.7) | |||
| Grade 4 | ||||||
| 2009 | 39.7 (38.7, 40.6) | (Ref) | 35.5 (34.6, 36.4) | (Ref) | 37.6 (37.0, 38.3) | (Ref) |
| 2010 | 37.5 (36.7, 38.3) | −2.2 | 34.0 (33.2, 34.8) | −1.5 | 35.8 (35.2, 36.3) | −1.8 |
| 2011 | 36.2 (35.6, 36.9) | −3.5 | 32.9 (32.2, 33.5) | −2.6 | 34.6 (34.2, 35.1) | −2.6 |
| 2012 | 36.2 (35.6, 36.9) | −3.5 | 32.3 (31.7, 32.9) | −3.2 | 34.3 (33.8, 34.8) | −3.3 |
| 2013 | 34.7 (34.0, 35.3) | −5.0 | 31.3 (30.7, 32.0) | −4.2 | 33.0 (32.6, 33.5) | −4.6 |
| 2014 | 34.4 (33.8, 35.1) | −5.3 | 31.0 (30.4, 31.6) | −4.5 | 32.8 (32.3, 33.2) | −4.8 |
| Total | 36.1 (35.8, 36.4) | 32.5 (32.3, 32.8) | 34.4 (34.2, 34.6) | |||
| Grade 7 | ||||||
| 2009 | 37.4 (36.4, 38.3) | (Ref) | 33.3 (32.4, 34.3) | (Ref) | 35.4 (34.7, 36.1) | (Ref) |
| 2010 | 37.1 (36.2, 37.9) | −0.3 | 33.8 (33.0, 34.6) | 0.5 | 35.5 (34.9, 36.0) | 0.1 |
| 2011 | 36.7 (36.0, 37.4) | −0.7 | 32.9 (32.3, 33.6) | −0.4 | 34.9 (34.4, 35.3) | −0.5 |
| 2012 | 35.6 (34.9, 36.2) | −1.8 | 32.1 (31.5, 32.8) | −1.2 | 33.9 (33.4, 34.3) | −1.5 |
| 2013 | 34.8 (34.2, 35.5) | −2.6 | 32.0 (31.4, 32.7) | −1.3 | 33.5 (33.0, 33.9) | −1.9 |
| 2014 | 33.6 (33.0, 34.3) | −3.8 | 31.7 (31.0, 32.3) | −1.6 | 32.7 (32.2, 33.1) | −2.7 |
| Total | 35.6 (35.4, 35.9) | 32.5 (32.2, 32.8) | 34.1 (33.9, 34.3) | |||
| Grade 10 | ||||||
| 2009 | 33.0 (32.0, 34.1) | (Ref) | 30.5 (29.5, 31.5) | (Ref) | 31.8 (31.1, 32.5) | (Ref) |
| 2010 | 34.2 (33.3, 35.0) | 1.2 | 31.5 (30.6, 32.3) | 1.0 | 32.8 (32.2, 33.4) | 1.0 |
| 2011 | 33.8 (33.1, 34.4) | 0.8 | 30.1 (29.5, 30.8) | −0.4 | 31.9 (31.5, 32.4) | 0.1 |
| 2012 | 34.2 (33.5, 34.9) | 1.2 | 29.2 (28.5, 29.8) | −1.3 | 31.7 (31.3, 32.2) | −0.1 |
| 2013 | 33.7 (33.1, 34.4) | 0.7 | 29.8 (29.2, 30.4) | −0.7 | 31.8 (31.3, 32.3) | 0.0 |
| 2014 | 34.2 (33.5, 34.8) | 1.2 | 30.3 (29.7, 31.0) | −0.2 | 32.3 (31.8, 32.7) | 0.5 |
| Total | 33.9 (33.6, 34.2) | 30.1 (29.8, 30.4) | 32.0 (31.8, 32.2) | |||
Note. CI = confidence interval. Change calculated as a difference in rate of any given year − rate of 2009.
Districts with lower income generally had a higher prevalence of overweight and obesity (Table 2). Although districts with income greater than $37 000 had significant rate reductions, the rates of the poorest districts (< $37 000) did not change and remained the highest at approximately 40%.
TABLE 2—
Prevalence of Overweight and Obesity by Median Household Income and Year in Massachusetts Public School Districts: 2009–2014
| < $37 000 |
$37 000–$44 000 |
$44 000–$54 000 |
> $54 000 |
Overall |
||||||
| Year | Rate (95% CI) | Change | Rate (95% CI) | Change | Rate (95% CI) | Change | Rate (95% CI) | Change | Rate (95% CI) | Change |
| 2009 | 39.5 (38.7, 40.3) | (Ref) | 40.4 (39.6, 41.1) | (Ref) | 35.8 (35.1, 36.6) | (Ref) | 27.3 (26.9, 27.8) | (Ref) | 34.3 (33.9, 34.6) | (Ref) |
| 2010 | 41.0 (40.2, 41.8) | 1.5 | 39.1 (38.4, 39.8) | −1.3 | 34.9 (34.3, 35.6) | −0.9 | 27.8 (27.4, 28.2) | 0.5 | 33.5 (33.2, 33.8) | −0.8 |
| 2011 | 40.0 (39.3, 40.7) | 0.5 | 39.1 (38.4, 39.7) | −1.3 | 34.8 (34.3, 35.4) | −1.0 | 27.2 (26.9, 27.5) | −0.1 | 32.4 (32.2, 32.6) | −1.9 |
| 2012 | 39.3 (38.7, 40.0) | −0.2 | 38.9 (38.3, 39.5) | −1.5 | 33.8 (33.3, 34.4) | −2.0 | 27.0 (26.7, 27.3) | −0.3 | 31.9 (31.7, 32.2) | −2.4 |
| 2013 | 40.2 (39.5, 40.9) | 0.7 | 38.4 (37.8, 39.0) | −2.0 | 33.3 (32.8, 33.8) | −2.5 | 26.2 (25.9, 26.5) | −1.1 | 31.5 (31.3, 31.7) | −2.8 |
| 2014 | 39.5 (38.7, 40.2) | 0.0 | 38.0 (37.5, 38.6) | −2.4 | 33.7 (33.2, 34.2) | −2.1 | 26.1 (25.8, 26.4) | −1.2 | 31.3 (31.0, 31.5) | −3.0 |
Note. CI = confidence interval. Change calculated as a difference in rate of any given year − rate of 2009.
District-Level Prevalence Rates and Temporal Trends
Overall district-level prevalence rate estimates for 2014, which was the most recent year of data, are shown on a thermal map (Figure 1a). The rate estimates ranged from 13.9% (Cohasset Public School District) to 47.4% (Everett Public School District), with an average of 30.3%. Figure 2 illustrates the distributional characteristics of the district-level prevalence estimates by grade and year of report. As shown, the modes of annual statewide prevalence rates shifted progressively downward for the first and fourth graders and possibly among the seventh graders. However, changes among the 10th graders were not apparent.
FIGURE 1—

Overweight and obesity in Massachusetts public school districts by (a) prevalence in 2014 and (b) temporal trends from 2009–2014.
FIGURE 2—
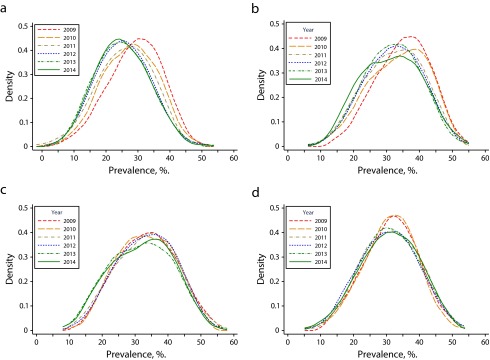
The shifting curves of school district–level prevalence of childhood overweight and obesity in Massachusetts for (a) grade 1, (b) grade 4, (c) grade 7, and (d) grade 10: 2009–2014.
Notable heterogeneity in temporal trends of overweight and obesity was observed among districts (Figure 1b). RRs over report year ranged from 0.82 to 1.32, when data from all grades were analyzed together. An RR less than 1.00 indicated a possible declining trend, whereas an RR greater than 1.00 indicated a possible increasing trend. Figure 1b shows significantly more districts having a downward trend (shaded in green color), but the majority of them were located in the wealthier eastern part of the state. Among the districts with adequate data, those in the central or western part of the state were more likely to have no change (in yellow and light orange colors). A significant number of districts had an increasing trend across the state. These communities were often socioeconomically disadvantaged.
District-level trends in overweight and obesity varied significantly by grade but not gender. District-level trends varied for all grades. For the first graders, RRs ranged from 0.76 to 1.30, with a median of 0.980, with more than two thirds of the districts having downward trends (67.2% vs 32.8%; 2-sided binomial test P < .01). Among fourth graders, RRs ranged from 0.80 to 1.45, with a median of 0.984, with slightly fewer than two thirds of the districts having a downward trend (62.8% vs 37.2%; P < .01). Among the 7th and 10th graders, there were no statistically significant differences in percent of districts with a downward or upward trend.
Three-Year Changes in Prevalence for the Grade 1, 4, and 7 Cohorts
During the study, the prevalence rates for overweight and obesity increased approximately 17% when the first graders advanced to the fourth grade 3 years later (RR = 1.17; 95% confidence interval [CI] = 1.15, 1.19; P < .001). When students advanced from grade 4 to grade 7, the prevalence of overweight and obesity decreased approximately 4% (RR = 0.96; 95% CI = 0.94, 0.99; P < .001). When students advanced from 7th to 10th grade, the prevalence decreased approximately 8% (RR = 0.92; 95% CI = 0.90, 0.94; P < .001). Adding covariates to the model did not change these results.
DISCUSSION
Childhood obesity not only places an enormous burden on the health of children and adolescents, it also has a major impact on their health care use and expenditures.14–16 To curb the rising prevalence of obesity, Massachusetts made statewide efforts through various approaches, including Mass in Motion. We documented the state’s current status of obesity prevalence among school age children. Although we confirmed overall declining trends similar to what several other states reported, our analysis discovered the widening socioeconomic disparities in childhood obesity and the limited success of this program in elementary school students. Such issues have not been well documented in literature.
We found a persistently high prevalence of childhood overweight and obesity in Massachusetts public school students. Nevertheless, the clear overall downward trends, especially among the first and fourth graders, were encouraging. These findings were consistent with recent studies that reported similar declining trends nationally8,9 and in several places, including Arkansas and Philadelphia, Pennsylvania.15,16 However, the most recent data from the 2011–2012 nationally representative National Health and Nutrition Examination Survey suggested that obesity prevalence among school-age children remains high.17 Childhood obesity remains one of the greatest public health challenges nationally and in Massachusetts.
Our analysis revealed significant geographic and socioeconomic disparities in both prevalence of and trends in obesity among school age children. Although more districts had generally downward trends, a substantially large number of school districts had no change or increasing trends. Unfortunately, but not surprisingly, the districts with increases were among the most socioeconomically disadvantaged.
In the shadow of the promising declining trends overall and among high-income districts, we should not overlook the widening socioeconomic disparities in childhood obesity in Massachusetts public school districts (Table 2). The disparities in childhood obesity rates between the poorest (< $37 000) and the richest (> $54 000) districts increased progressively from 12.2% in 2009 to 13.4% in 2014. The widening gap reflected the fact that prevalence in low-income districts did not change, whereas prevalence in high-income districts improved. Improved public health actions are necessary to close the widening gaps.
The variations in prevalence and differential rate reductions by grade were also of policy importance. From grades 1 through 4, the statewide 2009 to 2014 average prevalence increased 5.9 percentage points from 28.5% to 34.4%, and persisted at 32.7% and 32.3% for the 7th and 10th grades, respectively. This suggested that the grades 1 through 4 might be the window of opportunities for effective interventions. In addition, greater declines were seen among children in lower grades, and the success appeared to be limited to only elementary schools. We speculated that the breakfast program of the elementary schools might be related the observed declining trends, which should be further investigated. Therefore, strategies should be created to help sustain the lower prevalence at grade 1 through later years in public school. Effective strategies might include helping lower grade students and their parents develop healthier lifestyles early on, and assist them with sustaining the healthy lifestyles when the students become older and more independent.
Strengths and Limitations
Our study had a number of strengths and limitations. Strengths included the statewide coverage of the physical measurement of weight and height by trained school nurses or staff, for more than 1.2 million records from nearly 300 school districts collected over 6 years, and the relatively high screening rates among the reporting districts. As mandated by a state law, the data were collected consistently using a common protocol across school districts. The study area and school district unit of analysis were well defined and characterized. The data quality was carefully examined for completeness and accuracy. The limitations of the data included potential year-to-year variations because of factors that did not reflect long-term trends. Within a school district, the enrollment and number and percent of students screened in different years might vary, which might affect the representativeness of the reported data and the accuracy of the prevalence estimates. Students’ height and weight measurements might be measured with error, and thus, the calculated BMI might be erroneous as well, which might result in misclassification of students’ weight status. Measurements were taken in 4 grade levels and not from the entire student enrollment. Because overweight or obesity levels varied by age, our data in this study might not be generalizable to all Massachusetts public school students.
Conclusions
Childhood overweight and obesity prevalence progressively declined at the state level in Massachusetts between the 2008–2009 and 2013–2014 school years. However, reductions in prevalence varied among school districts and were concentrated in districts with higher socioeconomic status and to the first and fourth graders. Although the statewide overall reduction was promising, socioeconomic disparities in childhood obesity are widening, with socioeconomically disadvantaged school districts left behind with persistent and alarmingly high prevalence. Existing community-based prevention programs should be carefully examined for approaches, contents, and intensity to ensure that their interventions are affecting the most disadvantaged within their communities. Special efforts should be made to address the needs of socioeconomically disadvantaged districts. Departments of public health need to have a role in narrowing the disparities gap in the area of childhood obesity.
Acknowledgments
The study was funded by Massachusetts Department of Public Health.
We sincerely thank the school nurses and staff who carried out measurements and reporting of student BMI data across the state and the staff of the MDPH Essential School Health unit for training school nurses and providing support and guidance in implementing the BMI reporting regulations.
Human Participant Protection
This study analyzed only aggregated data at the gender-by-grade level from each school district. This was not a human subjects study.
References
- 1.Freedman DS, Mei Z, Srinivasan SR, Berenson GS, Dietz WH. Cardiovascular risk factors and excess adiposity among overweight children and adolescents: the Bogalusa Heart Study. J Pediatr. 2007;150(1) doi: 10.1016/j.jpeds.2006.08.042. 12–17 e2. [DOI] [PubMed] [Google Scholar]
- 2.Gilliland FD, Berhane K, Islam T et al. Obesity and the risk of newly diagnosed asthma in school-age children. Am J Epidemiol. 2003;158(5):406–415. doi: 10.1093/aje/kwg175. [DOI] [PubMed] [Google Scholar]
- 3.Redline S, Tishler PV, Schluchter M, Aylor J, Clark K, Graham G. Risk factors for sleep-disordered breathing in children. Associations with obesity, race, and respiratory problems. Am J Respir Crit Care Med. 1999;159(5 pt 1):1527–1532. doi: 10.1164/ajrccm.159.5.9809079. [DOI] [PubMed] [Google Scholar]
- 4.Biro FM, Wien M. Childhood obesity and adult morbidities. Am J Clin Nutr. 2010;91(5):1499S–1505S. doi: 10.3945/ajcn.2010.28701B. [DOI] [PMC free article] [PubMed] [Google Scholar]
- 5.Park MH, Falconer C, Viner RM, Kinra S. The impact of childhood obesity on morbidity and mortality in adulthood: a systematic review. Obes. Rev. 2012;13(11):985–1000. doi: 10.1111/j.1467-789X.2012.01015.x. [DOI] [PubMed] [Google Scholar]
- 6.Reilly JJ, Kelly J. Long-term impact of overweight and obesity in childhood and adolescence on morbidity and premature mortality in adulthood: systematic review. Int J Obes (Lond) 2011;35(7):891–898. doi: 10.1038/ijo.2010.222. [DOI] [PubMed] [Google Scholar]
- 7.Franks PW, Hanson RL, Knowler WC, Sievers ML, Bennett PH, Looker HC. Childhood obesity, other cardiovascular risk factors, and premature death. N Engl J Med. 2010;362(6):485–493. doi: 10.1056/NEJMoa0904130. [DOI] [PMC free article] [PubMed] [Google Scholar]
- 8.Olshansky SJ, Passaro DJ, Hershow RC et al. A potential decline in life expectancy in the United States in the 21st century. N Engl J Med. 2005;352(11):1138–1145. doi: 10.1056/NEJMsr043743. [DOI] [PubMed] [Google Scholar]
- 9.Ogden CL, Carroll MD, Curtin LR, Lamb MM, Flegal KM. Prevalence of high body mass index in US children and adolescents, 2007–2008. JAMA. 2010;303(3):242–249. doi: 10.1001/jama.2009.2012. [DOI] [PubMed] [Google Scholar]
- 10.Nihiser AJ, Lee SM, Wechsler H et al. BMI measurement in schools. Pediatrics. 2009;124(suppl 1):S89–S97. doi: 10.1542/peds.2008-3586L. [DOI] [PubMed] [Google Scholar]
- 11.Institute of Medicine (US), Committee on Prevention of Obesity in Children and Youth. Preventing Childhood Obesity: Health in the Balance. Washington, DC: The National Academies Press; 2005. [PubMed] [Google Scholar]
- 12.Madsen KA, Linchey J. School-based BMI and body composition screening and parent notification in California: methods and messages. J Sch Health. 2012;82(6):294–300. doi: 10.1111/j.1746-1561.2012.00700.x. [DOI] [PMC free article] [PubMed] [Google Scholar]
- 13.Kuczmarski RJ, Ogden CL, Guo SS et al. 2000 CDC growth charts for the United States: methods and development. Vital Health Stat 11. 2002;May(246):1–190. [PubMed] [Google Scholar]
- 14.Center for Disease Control and Prevention. Children’s BMI Tool for Schools. Atlanta, GA: Centers for Disease Control and Prevention; Available at: http://www.cdc.gov/healthyweight/assessing/bmi/childrens_bmi/tool_for_schools.html. Accessed June 15, 2015. [Google Scholar]
- 15.Trasande L, Chatterjee S. The impact of obesity on health service utilization and costs in childhood. Obesity (Silver Spring) 2009;17(9):1749–1754. doi: 10.1038/oby.2009.67. [DOI] [PubMed] [Google Scholar]
- 16.Trasande L, Liu Y, Fryer G, Weitzman M. Effects of childhood obesity on hospital care and costs, 1999–2005. Health Aff (Millwood) 2009;28(4):w751–w760. doi: 10.1377/hlthaff.28.4.w751. [DOI] [PubMed] [Google Scholar]
- 17.Ogden CL, Carroll MD, Kit BK, Flegal KM. Prevalence of childhood and adult obesity in the United States, 2011–2012. JAMA. 2014;311(8):806–814. doi: 10.1001/jama.2014.732. [DOI] [PMC free article] [PubMed] [Google Scholar]