

Abstract
Objectives. We summarized Flu Near You (FNY) data from the 2012–2013 and 2013–2014 influenza seasons in the United States.
Methods. FNY collects limited demographic characteristic information upon registration, and prompts users each Monday to report symptoms of influenza-like illness (ILI) experienced during the previous week. We calculated the descriptive statistics and rates of ILI for the 2012–2013 and 2013–2014 seasons. We compared raw and noise-filtered ILI rates with ILI rates from the Centers for Disease Control and Prevention ILINet surveillance system.
Results. More than 61 000 participants submitted at least 1 report during the 2012–2013 season, totaling 327 773 reports. Nearly 40 000 participants submitted at least 1 report during the 2013–2014 season, totaling 336 933 reports. Rates of ILI as reported by FNY tracked closely with ILINet in both timing and magnitude.
Conclusions. With increased participation, FNY has the potential to serve as a viable complement to existing outpatient, hospital-based, and laboratory surveillance systems. Although many established systems have the benefits of specificity and credibility, participatory systems offer advantages in the areas of speed, sensitivity, and scalability.
Digital communications technologies have rapidly increased in use for public health disease surveillance. Mobile phones, tablets, digital pens, and satellites are making it possible for surveillance and rapid response teams in even remote areas of the globe to carry out an essential function of public health to protect against outbreaks of infectious disease. To date, public health surveillance has been limited by the capacity of public health authorities to conduct case and contact tracing and a reliance on data provided primarily by the medical system. The increased use of digital communications technology is now making it possible to enable the public to actively be part of the public health surveillance system.
Since 2003, participatory surveillance approaches have leveraged online survey technology with syndromic surveillance of human infectious diseases through volunteer symptom reporting. In the Netherlands and Belgium, de Grote Griepmeting (The Great Influenza Survey) was launched during the 2003–2004 influenza season.1 Additional national syndromic systems were created in several other European countries over the next decade. Today, under the umbrella of Influenzanet, more than 35 000 volunteers are contributing to symptom reporting across 10 European countries.2 Several of the national reporting systems within Influenzanet have been evaluated, with researchers examining rates of influenza-like illness (ILI), evaluating vaccine effectiveness, and using data from the system to estimate the severity of the 2009 H1N1 influenza pandemic.3–7 In Australia, a similar system, FluTracking, was launched in 2006 and expanded nationally in 2007, collecting information on symptoms of ILI and vaccination status. FluTracking served as a tool for tracking influenza during the 2009 H1N1 pandemic and provided a measure for vaccine effectiveness in a study of the 2007–2009 seasons.8–11 Other participatory systems include Reporta in Mexico and Dengue na Web in Brazil.12 Each system has demonstrated the ability to provide both the general public and public health authorities with timely information on disease trends, and in some cases, additional data on vaccination coverage and risk factors for disease.
Flu Near You (FNY) is a participatory disease surveillance system for volunteer reports of ILI symptoms that was created in 2011 through a collaboration between the American Public Health Association (APHA), HealthMap of Boston Children’s Hospital, and the Skoll Global Threats Fund. FNY maintains a Web site and mobile application that allows volunteers in the United States and Canada to report their health information using a brief weekly survey. FNY allows individuals to register using its website, a mobile application, or Facebook. The system collects symptom data on a weekly basis, which it publishes to the website, while offering an interface to compare its data with data from the Centers for Disease Control and Prevention (CDC) sentinel influenza network and Google Flu Trends in the form of maps and charts. FNY also hosts a “Vaccine Finder” tool that allows individuals to identify local sources for influenza vaccine and vaccines for other diseases. Any resident of the United States or Canada who is at least 13 years old can register to participate in FNY.13
The mission of FNY is to collect and freely share participant-reported ILI data that are free, open, and timely, with the general public and key stakeholders (departments of public health, other government agencies, health care providers, etc.) to increase awareness and insights about ILI activity. The long-term vision for FNY is to generate the earliest signal of ILI occurrence and provide user-friendly and actionable insights to the general public and key stakeholders. The system also aims to comprehensively track ILI symptoms across the United States. Although FNY is still in the early stages of development, the system’s weekly symptom reports have proven to be of value to public health practitioners and researchers.14 We examined data from the FNY surveillance system during the 2012–2013 and 2013–2014 influenza seasons in the United States, summarized findings, and discussed future steps in the system’s development.
METHODS
FNY data collection has been ongoing since October 2011, when the surveillance system was launched in partnership with the APHA. Initially, volunteer participants were solicited through a Get Ready Campaign called “APHA Flu Near You Challenge.” Get Ready Campaigns help Americans prepare themselves for disasters and hazards, including pandemic influenza, natural disasters, and other emergencies. Through the Challenge, APHA members were asked to help spread the word about FNY and to recruit additional participants into the system. FNY has been open to the general public since it launched November 3, 2011 at the 139th Annual APHA Meeting in Washington, DC. FNY experienced large spikes in new registrations and a corresponding increase in the number of weekly participant reports following multiple national television news stories that highlighted the system during both the 2012–2013 and 2013–2014 influenza seasons. The increase in activity spurred by national television exposure far exceeded that from any other outreach or recruitment effort. However, retaining such a large influx of users proved challenging, and many users unsubscribed over subsequent weeks.
As of March 2015, FNY had more than 140 000 registrations. More than 1.3 million weekly surveys were submitted, with more than 700 000 surveys from primary users, and the remainder submitted on the behalf of household members. We examined a subset of these surveys submitted during the 2012–2013 and 2013–2014 influenza seasons. For the purposes of our study, “primary users” and “household members” are often aggregated and referred to jointly as “participants.”
Data Collection
At the time of registration, FNY collects gender, month and year of birth, zip code, and e-mail address data from primary users. When registering household members, primary users are asked to supply a nickname, gender, and month and year of birth for that household member. Weekly queries are made to registered FNY users to report on their own symptoms and the symptoms of household members whom they have registered. Each Monday, users receive either a weekly e-mail reminder with a survey link or a push notification to their mobile phone, asking them to report if they experienced any of the following 10 symptoms during the previous week (Monday–Sunday): fever, cough, sore throat, shortness of breath, chills, fatigue, nausea, diarrhea, headache, or body aches (Figure 1). Users may opt to report “none” if they have not experienced any of the aforementioned symptoms. If a user selects “fever,” they are given the opportunity to provide an optional, self-reported temperature reading. Whenever a user reports 1 or more symptoms, they are asked to report the date of symptom onset from a pop-up calendar. ILI and other syndrome designations are derived from these symptom reports, and users are not informed of what constitutes ILI in the reporting prompt. Finally, users are also asked whether they received an influenza vaccine for the current season. Once this question is answered affirmatively, the question disappears from the survey for the remainder of the current influenza season. Users are then asked the same set of questions for each household member they have registered.
FIGURE 1—

Flu Near You mobile interface.
Data Management and Analysis
We excluded Canadian users from analysis because of low uptake and to allow for comparison with US data. We also excluded Puerto Rico users from analysis because Salud Boricua, which is a subsystem of FNY that operates independently, generated data for Puerto Rico. We dropped users with missing or invalid zip code data. For this analysis, we restricted FNY data to the official influenza seasons for 2012–2013 and 2013–2014, using CDC weeks 40 to 20. The 2012–2013 influenza season lasted from October 1, 2012 to May 19, 2013. The 2013–2014 influenza season lasted from September 30, 2013 to May 18, 2014. It should be noted that although CDC weeks run from Sunday to Saturday, FNY weeks run from Monday to Sunday.
We grouped reports into 3 syndromes for analysis: (1) “no symptoms,” for which users reported that they had not experienced any of the 10 symptoms in the FNY survey during the previous week; (2) “some symptoms,” for which users reported any symptom combination that did not meet FNY’s definition of ILI; and (3) ILI, for which users reported experiencing fever plus cough or sore throat, in addition to any other symptoms. Although users had the option to report a temperature reading, we did not include these data in the analysis.
We tabulated and summarized descriptive statistics using Microsoft Excel for Mac 2011 (Microsoft, Redmond, WA) and Stata SE version 13 (StataCorp, College Station, TX). To determine whether participation in the FNY system generated reliable estimations of ILI in the United States, we compared reports of ILI in FNY to weighted, national ILI rates from the CDC US Outpatient Influenza-like Illness Surveillance Network (ILINet). ILINet includes approximately 2900 outpatient health care providers that cover all 50 states, Puerto Rico, the District of Columbia and the US Virgin Islands, with approximately 1800 of those providers reporting weekly data to CDC on the total number of patients seen and the number of those patients with ILI.15
Although the ILINet defines ILI as “fever (temperature of 100°F [37.8°C] or greater) and a cough and/or a sore throat without a KNOWN cause other than influenza,” the FNY system defines ILI as “fever (self-reported) and cough and/or sore throat.” Although many users report optional temperature readings, these data are not included in assigning the ILI definition.
We calculated ILI rates for both systems for both the 2012–2013 and 2013–2014 influenza seasons, and we graphed the results for comparison. We calculated the ILI rates for FNY using the number of FNY participants reporting ILI in a given week, divided by the total number of FNY participants reporting in that same week. We adjusted the rates using 2 methods. The first method consisted of dropping each participant’s first report to the system to account for first-time user error and nonserious reporting, because similar methods are employed by other participatory surveillance systems.1,6
We designed the second method specifically to filter out undesired spikes observed in the unadjusted FNY influenza-like illness rates. By analyzing historical weekly changes in CDC-reported ILI rates with respect to the preceding 4 weeks from December 2002 to October 2011, we observed that changes in CDC influenza-like illness rates typically (99% of the times) fell within −10 and 10 SDs from the mean change of the previous 4 weeks. We created a noise-filtering algorithm using this result. We created a time series of FNY influenza-like illness rates for the 2 flu seasons as follows. In weeks when the absolute change of the weekly percentage of FNY influenza-like illness rate was within 10 SDs from the mean change of the previous 4 weeks of CDC-reported ILI, we kept the FNY influenza-like illness rates. For weeks when this was not satisfied, we identified an undesired spike, and we calculated a real-time estimate of the FNY influenza-like illness rate by adding (for upward peaks) or subtracting (for downward peaks) 1 SD of the changes of the previous 4 weeks, to the previous week’s ILI rate.
RESULTS
For the 2012–2013 influenza season, 63 181 unique participants submitted at least 1 report, totaling 327 773 reports for the season, with a median of 4 reports per user. During the 2013–2014 season, 39 822 participants submitted at least 1 report, totaling 336 933 reports, with a median of 5 reports per user. Female participants were the majority for both seasons; we calculated 58.2% female participants in 2012–2013 and 56.5% female participants in 2013–2014 for users with gender data available. This is comparable to a 51% female population in the United States.16 The median age for users in 2012–2013 was 45 years, whereas the median age for the 2013–2014 season was 47 years. The majority of FNY users for both seasons was between ages 40 and 70 years. Although participants younger than age 13 years accounted for approximately 10% and 9% of participants in each season, it should be noted that these participants were the only age category in which all individuals had to be household members of primary users because of age restrictions. The lowest age group for individual participation in FNY was 13–17 years (Table 1).
TABLE 1—
Flu Near You User Characteristics and Reporting: United States, 2012–2014
| 2012–2013 | 2013–2014 | |
| Reports per user | ||
| Mean | 7.3 | 10.0 |
| Median | 4.0 | 5.0 |
| IQR | 8.0 | 14.0 |
| Min | 1.0 | 1.0 |
| Max | 33.0 | 33.0 |
| Symptoms, % | ||
| Reported ILI | 20.0 | 16.3 |
| Never reported ILI | 80.0 | 83.7 |
| Gender, no. (%) | ||
| Female | 33 698 (53.3) | 20 750 (52.0) |
| Male | 24 178 (38.3) | 15 956 (40.0) |
| Missing | 5 305 (8.4) | 3 176 (8.0) |
| Total | 63 181 | 39 882 |
| Age group, y no. (%)a | ||
| 0–12 | 6 375 (10.1) | 3 530 (8.9) |
| 13–17 | 2 861 (4.5) | 2 137 (5.4) |
| 18–29 | 6 567 (10.4) | 3 886 (9.7) |
| 30–39 | 10 182 (16.1) | 5 324 (13.3) |
| 40–49 | 11 823 (18.7) | 6 725 (16.9) |
| 50–59 | 12 193 (19.3) | 8 209 (20.6) |
| 60–69 | 9 693 (15.3) | 7 337 (18.4) |
| ≥ 70 | 3 487 (5.5) | 2 734 (6.9) |
| Total, no. | 63 181 | 39 882 |
Note. ILI = influenza-like illness; IQR = interquartile range. Percentages may not add to 100 because of rounding.
FNY users represented every state in the United States during both the 2012–2013 and 2013–2014 influenza seasons. CDC Flu Regions 1, 3, 8, 9, and 10 were overrepresented in FNY each season compared with the general population distribution in the United States. Overall, FNY users included 0.020% of the population of United States in the 2012–2013 season and 0.013% during the 2013–2014 season. FNY users by the Department of Health and Human Services Surveillance region are noted in Table 2.
TABLE 2—
Flu Near You Participants by Department of Health and Human Services Surveillance Region: United States, 2012–2014
| HHS Regiona | FNY 2012–2013, No. (%) | FNY 2013–2014, No. (%) | United States 2013, No. (%) |
| 1 | 4 450 (7.0) | 3 542 (8.9) | 14 618 806 (4.6) |
| 2 | 4 807 (7.6) | 2 587 (6.5) | 32 165 552 (10.1) |
| 3 | 7 542 (11.9) | 4 402 (11.0) | 30 389 522 (9.5) |
| 4 | 8 572 (13.6) | 5 537 (13.9) | 62 884 128 (19.7) |
| 5 | 10 024 (15.9) | 6 138 (15.4) | 52 082 560 (16.3) |
| 6 | 5 624 (8.9) | 3 292 (8.3) | 39 968 891 (12.5) |
| 7 | 2 689 (4.3) | 1 698 (4.3) | 13 897 060 (4.3) |
| 8 | 3 705 (5.9) | 2 111 (5.3) | 11 335 332 (3.5) |
| 9 | 10 885 (17.2) | 7 459 (18.7) | 49 153 335 (15.4) |
| 10 | 4 822 (7.6) | 3 084 (7.7) | 13 248 739 (4.1) |
| Missing | 61 (0.1) | 32 (0.1) | |
| Total | 63 181 (100.0) | 39 882 (100.0) | 319 743 925 (100.0) |
Note. FNY = Flu Near You; HHS = Department of Health and Human Services.
States by HHS Surveillance Region—Region 1: CT, ME, MA, NH, RI, VT; Region 2: NJ, NY, PR; Region 3: DE, DC, MD, PA, VA, WV; Region 4: AL, FL, GA, KY, MS, NC, SC, TN; Region 5: IL, IN, MI, MN, OH, WI; Region 6: AR, LA, NM, OK, TX; Region 7: IA, KS, MO, NE; Region 8: CO, MT, ND, SD, UT, WY; Region 9: AZ, CA, HI, NV; Region 10: AK, ID, OR, WA.
During the time period under analysis, there was a total of 33 weeks during each season that participants were eligible to report. A majority of participants submitted between 1 and 5 reports each season, with 73.5% submitting 1 to 5 reports in the 2012–2013 season and 60.5% submitting 1 to 5 reports during the 2013–2014 season. There was noticeable decline in the number of reports submitted by participants within this group, because 39.7% of participants submitted 1 report, 16.0% submitted 2 reports, 8.5% submitted 3 reports, and 5.4% submitted 4 reports during the 2012–2013 season. The decline was more gradual the following year, because 31.1% submitted 1 report, 13.6% submitted 2 reports, 7.5% submitted 3 reports, and 4.8% submitted 4 reports during the 2013–2014 season. During both seasons, the number of long-term, consistently reporting participants stabilized after this initial decline. During the 2012–2013 season, 10.4% of participants submitted between 16 and 33 reports, whereas that percentage increased to 21.9% during the 2013–2014 season.
The majority of users did not experience symptoms that met FNY’s definition of ILI during the 2012–2013 season (80.0%), whereas 17.3% of participants reported ILI once during that time period. The remaining 2.7% of participants reported ILI for more than 1 week during that season. During the 2013–2014 influenza season, 83.7% of participants did not report symptoms meeting the definition of ILI, whereas 13.3% reported symptoms of ILI once during the season. The remaining 3.0% of participants reported ILI for more than 1 week during that season. As presently deployed, FNY data cannot confirm whether multiple reports of ILI may be because of the same continuing illness.
Weekly Survey Data
During the 2012–2013 influenza season, a total of 327 773 reports were received from participants, averaging 9933 per week during the 33-week period. Reporting ranged from a low of 2745 surveys the week beginning October 1, 2012 (CDC week 40), to a high of 40 871 surveys for the week beginning December 31, 2012 (CDC week 1). This peak coincided with the airing of national news stories on ABC, NBC, and CNN that featured FNY.17–19
During the 2013–2014 influenza season, a total of 336 933 reports were received from participants, averaging 10 210 per week during the 33-week period. Reporting ranged from a low of 7505 during the week beginning September 30, 2013 (CDC week 40) to a high of 18 306 during the week beginning January 6, 2014 (CDC week 2). This peak also coincided with the airing of a national news story on NBC Nightly News featuring the FNY system.20
Analysis of Influenza-Like Illness Symptom Data
During the 2012–2013 influenza season, the adjusted FNY influenza-like illness rates obtained by both noise-filtering and report-dropping methods peaked for the week of December 31 (CDC week 1) at 6.3% and 4.8%, respectively, whereas peak ILI occurred 1 week earlier at 6.1% for ILINet (CDC week 52). During the 2013–2014 season, reports of ILI peaked the week of December 23 (CDC week 52) for both report-drop adjusted FNY and ILINet at 3.4% and 4.6%, respectively. The noise-filter adjusted FNY peak occurred 1 week later (CDC week 1) at 4.4%. Peak ILI timing for each measure is included in Figure 2, alongside Pearson correlation coefficients and average error per week (root mean square error), because high correlation did not imply low average error. Although the report-dropping adjustment to FNY data improved correlation with CDC data, the noise-filtering approach also yielded increased correlation while having a lower average weekly error. Google Flu Trends data are also displayed in Figure 2 for reference.
FIGURE 2—
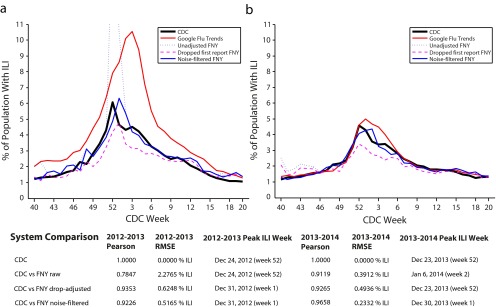
Comparison between report-adjusted FNY, noise‐filtered FNY, and CDC influenza-like illness rates for flu seasons (a) 2012–2013 and (b) 2013–2014: United States.
Note. CDC = Centers for Disease Control and Prevention; FNY = Flu Near You; ILI = influenza-like illness; RMSE = root-mean-square error. For context, ILI rates obtained from Google Flu Trends and the raw FNY are shown.
DISCUSSION
Despite the need for additional years of data and continued research to build an optimal participatory surveillance system, FNY demonstrated that it is possible to engage thousands of volunteers in reporting on their health status each week in the United States. With increased uptake, FNY has the potential to serve as a viable complement to existing outpatient, hospital-based, and laboratory surveillance systems. Although many established systems have the benefit of specificity and credibility, participatory systems like FNY offer advantages in the areas of speed, sensitivity, and scalability. We are hopeful that in the future, FNY will provide participants with the option to report symptoms in real time, rather than once-per-week, giving health authorities a robust tool for early detection of disease outbreaks. If additional symptom options were included in such a system, FNY could be configured to detect a wide variety of syndromes and contribute to public health preparedness. The untapped ability for a system such as FNY to serve as a 2-way communication and alerting channel could allow health authorities to remind users when it is time to be vaccinated, inform them of changing health trends, or alert them to public health or other hazards in their area.
After 2 full influenza seasons with a robust level of participation, FNY has begun to provide data that may be of use to the public health community. In both seasons, female participants outnumbered their male counterparts, although we witnessed a shift toward older participants in the 2013–2014 season. Although a technology-driven approach to public health surveillance might be expected to have greater appeal among younger populations, it should be considered that influenza itself is likely more concerning to older populations and those with young children, which are both groups at high risk for complications because of influenza.
As expected, we witnessed large increases in participant registration and reporting following exposure on national news stories during each influenza season. Although exposure to a national television audience proved to be the most effective recruiting method, it is not a sustainable approach, and additional methods for recruitment and retention must be explored. Such large and sudden spikes in participant engagement led us to control for erroneous reporting using 2 methods. In the first method, we dropped the first report from each participant, as researchers did with the Influenzanet platform. In the second method, we removed undesired spikes using a noise-filtering approach inspired by historical CDC influenza-like illness data. The second method showed great promise as a means to filter out noise in FNY influenza-like illness rates in real time. In addition, with many users submitting only 1 or 2 reports each season, identifying characteristics of consistent reporters would be crucial to maintaining system viability.
Although we compared ILI rates from FNY with those of ILINet to determine if volunteer reports would approximate those generated by outpatient surveillance, we noted that the 2 systems had different biases and should not necessarily be expected to yield the same magnitudes for ILI. Although FNY did not require any engagement with the health system on the part of participants, ILINet captured a numerator of patients with ILI over a denominator of patients seeking care in an outpatient facility. Therefore, it was possible that the population of ILINet had a higher burden of disease that might have led to higher ILI rates compared with FNY participants. Conversely, early analyses of reporting trends indicated that some FNY participants were more motivated to report only when experiencing symptoms of illness. How these conflicting influences affected the overall participation, and in particular, rates of ILI, are not yet fully understood and will require further study. In addition, the geographic distribution of FNY participants might be skewed in such a way that it affected the timing of peak influenza incidence compared with ILINet or other measures of influenza burden. Participant and reporting geographic distribution must be further assessed to clarify these influences and provide actionable data that can inform participant outreach and recruitment efforts.
As with any participatory system, FNY will be reliant on an engaged user base and must strive to provide participants with value in return for their contributions. Protection of the limited user data collected will remain paramount, because breaches of trust with digital customers in other technology-driven enterprises have proven to be all too common. As the field of public health continues to leverage the Internet and other digital technologies in the fight against disease, we must also remain conscious of our ethical responsibilities in an area where norms are still being established.
Limitations
Reports submitted to FNY originate from a convenience sample and may not be representative of the wider United States population in terms of geographic distribution, gender, age and vaccination status. Although the survey questions completed by FNY participants did not vary during the study period, the registration process was altered to remove a confirmatory step and expedite enrollment during January 2014. This change in enrollment process might have had unknown effects on participant recruitment. Because FNY required only an e-mail address for enrollment and did not collect other identifying information, it was possible that individuals could maintain multiple user accounts and exert undue influence over symptom reporting. It was also possible that in some cases, primary users reported symptoms for household members, who might have already reported on their own. FNY did not require independent confirmation of participant-reported symptoms or vaccination status. FNY reported symptom data according to the zip code supplied by the participant. Participant reports submitted while the participant was living, working, or traveling in another location might result in inaccurate geographic reporting. Multiple reports of ILI or other symptoms over successive reporting periods could not be verified as being the result of the same illness. Finally, our analysis that compared FNY rates with ILINet might be affected by the 1-day difference in weekly reporting schedules (i.e., Monday to Sunday vs Sunday to Saturday).
Conclusions
Flu Near You is a novel participatory disease surveillance tool in the United States that can complement existing influenza and ILI surveillance systems by directly engaging the public in public health reporting. The 2012–2013 and 2013–2014 influenza seasons demonstrated strong public engagement with the tool and high correlation with other ILI surveillance systems. Public engagement with the tool must be sustained and enhanced in order for Flu Near You to provide robust data that can inform public health authorities. Further research is needed to better describe the populations engaging in Flu Near You reporting and document the biases inherent in the system.
Acknowledgments
We acknowledge all of the participants who contributed their time and information to the FNY system. Without our network of volunteers, FNY would not exist. We acknowledge the American Public Health Association and their membership for their partnership and support in promoting the launch of FNY. We acknowledge our colleagues at HealthMap of Boston Children’s Hospital and the Skoll Global Threats Fund, particularly Larry Brilliant, Erik Johnson, Susan Aman, Rachel Chorney, Colleen Nguyen, Leila Amerling, Winnie Deng, Alexis de Belloy, Lindsay Steele, Lauren Diaz, Shereen Adel, and Bruce Lowry for their help and support in developing, maintaining, and promoting FNY.
Human Participant Protection
The institutional review board at the Office of Clinical Investigations at Boston Children’s Hospital approved FNY for expedited continuing approval and received a waiver of informed consent.
References
- 1.Marquet RL, Bartelds AIM, van Noort SP et al. Internet-based monitoring of influenza-like illness (ILI) in the general population of the Netherlands during the 2003–2004 influenza season. BMC Public Health. 2006;6:242. doi: 10.1186/1471-2458-6-242. [DOI] [PMC free article] [PubMed] [Google Scholar]
- 2. Influenzanet: Home. Available at: https://www.influenzanet.eu. Accessed August 25, 2014.
- 3.Bajardi P, Vespignani A, Funk S et al. Determinants of follow-up participation in the internet-based European influenza surveillance platform Influenzanet. J Med Internet Res. 2014;16(3):e78. doi: 10.2196/jmir.3010. [DOI] [PMC free article] [PubMed] [Google Scholar]
- 4.Paolotti D, Carnahan A, Colizza V et al. Web-based participatory surveillance of infectious diseases: the Influenzanet participatory surveillance experience. Clin Microbiol Infect. 2014;20(1):17–21. doi: 10.1111/1469-0691.12477. [DOI] [PMC free article] [PubMed] [Google Scholar]
- 5.Debin M, Colizza V, Blanchon T, Hanslik T, Turbelin C, Falchi A. Effectiveness of 2012-2013 influenza vaccine against influenza-like illness in general population: estimation in a French web-based cohort. Hum Vaccin Immunother. 2014;10(3):536–543. doi: 10.4161/hv.27439. [DOI] [PMC free article] [PubMed] [Google Scholar]
- 6.Bayer C, Remschmidt C, an der Heiden M et al. Internet-based syndromic monitoring of acute respiratory illness in the general population of Germany, weeks 35/2011 to 34/2012. Euro Surveill. 2014;19(4) doi: 10.2807/1560-7917.es2014.19.4.20684. [DOI] [PubMed] [Google Scholar]
- 7.Brooks-Pollock E, Tilston N, Edmunds WJ, Eames KTD. Using an online survey of healthcare-seeking behaviour to estimate the magnitude and severity of the 2009 H1N1v influenza epidemic in England. BMC Infect Dis. 2011;11:68. doi: 10.1186/1471-2334-11-68. [DOI] [PMC free article] [PubMed] [Google Scholar]
- 8.Dalton C, Durrheim D, Fejsa J et al. Flutracking: a weekly Australian community online survey of influenza-like illness in 2006, 2007 and 2008. Commun Dis Intell Q Rep. 2009;33(3):316–322. doi: 10.33321/cdi.2009.33.34. [DOI] [PubMed] [Google Scholar]
- 9.Carlson SJ, Durrheim DN, Dalton CB. Flutracking provides a measure of field influenza vaccine effectiveness, Australia, 2007–2009. Vaccine. 2010;28(42):6809–6810. doi: 10.1016/j.vaccine.2010.08.051. [DOI] [PubMed] [Google Scholar]
- 10.Carlson SJ, Dalton CB, Durrheim DN, Fejsa J. Online Flutracking survey of influenza-like illness during pandemic (H1N1) 2009, Australia. Emerg Infect Dis. 2010;16(12):1960–1962. doi: 10.3201/eid1612.100935. [DOI] [PMC free article] [PubMed] [Google Scholar]
- 11.Dalton CB, Carlson SJ, Butler MT, Feisa J, Elvidge E, Durrheim DN. Flutracking weekly online community survey of influenza-like illness annual report, 2010. Commun Dis Intell Q Rep. 2011;35(4):288–293. doi: 10.33321/cdi.2011.35.27. [DOI] [PubMed] [Google Scholar]
- 12.Wójcik OP, Brownstein JS, Chunara R, Johansson MA. Public health for the people: participatory infectious disease surveillance in the digital age. Emerg Themes Epidemiol. 2014;11:7. doi: 10.1186/1742-7622-11-7. [DOI] [PMC free article] [PubMed] [Google Scholar]
- 13. Flu Near You FAQ. Available at: https://flunearyou.org/faq. Accessed August 25, 2014.
- 14.Butler D. When Google got flu wrong. Nature. 2013;494(7436):155–156. doi: 10.1038/494155a. [DOI] [PubMed] [Google Scholar]
- 15.Centers for Disease Control and Prevention. Overview of Influenza Surveillance in the United States. Available at: http://www.cdc.gov/flu/weekly/overview.htm. Accessed August 25, 2014.
- 16.United States Census Bureau. 2010 United States Census. State & county QuickFacts. 2010. Available at: http://quickfacts.census.gov/qfd/states/00000.html. Accessed October 29, 2014.
- 17.CNN Newsroom. Flu-fighting apps: tracks flu activity in your area. 2013. Available at: http://archive.org/details/CNNW_20130113_210000_CNN_Newsroom?q=%22flu+near+you%22#start/2160/end/2220. Accessed October 29, 2014.
- 18.ABC World News with Diane Sawyer. Flu spike: illness spreads to 41 states. 2013. Available at: http://archive.org/details/KGO_20130108_013000_ABC_World_News_With_Diane_Sawyer?q=cdc#start/60/end/120. Accessed October 29, 2014.
- 19.NBC Nightly News with Brian Williams. Hospitals struggle, overburdened with flu patients. 2013. Available at: http://www.nbcnews.com/video/nightly-news/50403351#50403351. Accessed October 29, 2014.
- 20.NBC Nightly News with Brian Williams. Flu now widespread in 35 states. 2014. Available at: http://www.nbcnews.com/video/nightly-news/54035671#54035671. Accessed October 29, 2014.