

Abstract
BACKGROUND
Multipotent stromal cells, also called mesenchymal stem cells (MSCs), are potentially valuable as a cellular therapy due to their differentiation and immunosuppressive properties. Due to extensive heterogeneity of MSCs, quantitative approaches to measure differentiation capacity between donors and passages on a per cell basis are needed.
METHODS
Human bone marrow-derived MSCs were expanded to passages P3, P5, and P7 from 8 different donors, and analyzed for colony forming unit capacity (CFU), cell size, surface marker expression and FSC/SSC analysis by flow cytometry. Adipogenic differentiation potential was quantified using automated microscopy. Percent adipogenesis was determined by quantifying nuclei and Nile Red positive adipocytes following automated image acquisition.
RESULTS
MSCs varied in expansion capacity, and increased in average cell diameter with passage. CFU capacity decreased with passage and varied among cell lines within the same passage. The number of adipogenic precursors vary between cell lines, ranging from 0.5% – 13.6% differentiation at P3. Adipogenic capacity decreased significantly with increasing passage. MSC cell surface marker analysis revealed no changes due to passaging or donor differences.
CONCLUSIONS
We measured adipogenic differentiation on a per cell basis with high precision and accuracy using automated fluorescence microscopy. We correlated these findings with other quantitative bioassays to better understand the role of donor variability and passaging on CFU, cell size, and adipogenic differentiation capacity in vitro. These quantitative approaches provide valuable tools to measure MSC quality and measure functional biological differences between donors and cell passages that are not revealed by conventional MSC cell surface marker analysis.
Keywords: Adipogenesis, Bone Marrow Stromal Cell, Mesenchymal Stem Cell, Microscopy
Introduction
MSCs are multipotent adult cells that possess the ability to differentiate along several lineages, including adipogenic (1–5), ostoegenic (6–11) and chondrogenic (12–16) pathways. They can be derived from a variety of tissues including bone marrow (17–23), fat (24–28), muscle (29–31), umbilical cord blood (32, 33), and placenta (34). MSCs were first described by Friedenstein et al. as a fibroblast-like cell derived from the bone marrow with adherent properties and colony-forming capacity (20). Today, MSCs are of significant clinical interest as potential cellular therapies to treat a variety of diseases due to their capacity for tissue repair and immunomodulatory properties. This therapeutic potential is possible because of their proliferative capacity and potential for tri-lineage differentiation, as well as their immunosuppressive properties (35–40).
Currently, over 250 clinical trials are underway to treat many conditions with MSCs, including GvHD, Crohn’s Disease, and multiple sclerosis, among others (41). The percentage of MSCs in the bone marrow ranges between 0.001 – 0.01% (42). In order to obtain sufficient numbers, MSCs are typically expanded substantially in tissue culture before use. Following expansion by cell culture passaging, the biological properties of MSCs are often evaluated using qualitative assays to assess differentiation capacity. The availability of robust quantitative methods to assess differentiation capacity on a per cell basis in heterogeneous cell populations like MSCs would be of great value to assess MSC quality during and following the expansion process, and to determine if there are differences in the differentiation capacity of MSCs from different donors.
Several studies have examined the role of donor differences and cell passaging on MSC proliferation and differentiation capacity. Stenderup et al. studied MSCs from donors grouped by age to determine the role of donor age and cell culture expansion on bone and fat forming capacity, proliferation potential, and senescence. It was observed that an increase in senescence in older donors which was accompanied by a decrease in overall proliferative potential. However, no changes were seen in adipogenic or osteogenic capacity based on donor age. Following cell expansion, a decrease both in adipogenic and osteogenic potential was observed. (43). Bonab et al. also demonstrated this decreased capacity for differentiation with cell expansion (44).
While both of these investigators report percent differentiation following adipogenesis, it is unclear how these percentages were obtained. Many investigators in the field currently rely on qualitative analyses to report adipogenic differentiation capacity simply by demonstrating the presence of Oil Red O staining following adipogenic stimulation (2, 4, 18). Others employ semi-quantitative analyses by quantifying pixels in an image or using a spectrophotometric measurement following isopropanol extraction of Oil Red O dye from differentiated adipocytes. A quantitative approach to date to measure adipognenesis of adipose derived stromal cells was described by Sen et al., who quantified Nile Red staining by flow cytometry (45). However, we chose to pursue an approach which did not require cells to be removed from tissue culture growth surfaces.
Many of these approaches largely disregard the cellular heterogeneity within populations of MSCs (46, 47). As reviewed by Pevsner-Fischer et al., intra-population heterogeneities have been widely observed in MSCs, and may be in part due to the in vivo microenvironment or in vitro expansion. The heterogeneous nature of MSCs may also allow them to efficiently respond to a variety of cues seen in vivo, as demonstrated by their role in differentiation, tissue regeneration and immunosuppression (48). Quantitative measurements made on a per cell basis take into account this inherent heterogeneity observed in MSCs, and will allow for quantification of progenitor cells that are capable of carrying out a desired function. Further, these assays can be applied beyond measurement of donor- and passage-related differences, including use for functional analysis of populations purified by currently available cell surface markers (i.e. sorting for STRO-1 (49, 50), CD271 (12, 51), or other newly discovered biomarkers (52)), or various MSC sources (bone marrow, adipose tissue, muscle, placenta, umbilical cord, etc.).
We have previously used limiting dilution as a technique to quantify adipogenic differentiation in MSCs. Following expansion of MSCs from 2 cell lines to passages 3, 5 and 7, we demonstrated adipogenic precursors can decrease with increasing passage, and can vary between cell lines from different donors. We successfully quantified differentiation on a per-cell basis with this simple, quantitative assay that can be utilized in almost any laboratory (53). In this current study, we have expanded our previously published data, using additional cell lines and a novel, automated technique to quantify differentiation following adipogenesis using automated microscopy. We have correlated our findings with previously-established quantitative assays to better understand the role of donor variability and passaging on MSC stemness and differentiation capacity.
Materials and Methods
MSC Expansion, Differentiation and Cell Size Analysis
Human bone marrow-derived MSCs from 8 different donors were purchased from either All Cells (Emeryville, California USA) (PCBM1641, PCBM1632, PCBM1662, PCBM1655) or Lonza (Walkersville, MD USA) (167696, 110877, 8F3560, 127756) at passage 1 (see Table 1 for donor specifications). MSCs were plated in T175 flasks (Cellstar) at a cell density of 60 cells/cm2, and expanded in complete medium containing α-MEM, l-glutamine, penicillin-streptomycin (Invitrogen Carlsbad, CA USA), and 16.5% lot-selected fetal bovine serum (FBS, JM Bioscience San Diego, CA USA) at 37°C and 5% CO2. All cell lines were expanded by plating at 60 cells/cm2 and cryopreserved in the same serum-selected media with uniform handling throughout culture, as outlined in Lo Surdo and Bauer (53).
Table 1.
Summary of cell line specifications
| Designation | Gender | Age |
|---|---|---|
| PCBM1632 | M | 24 |
| 110877 | M | 22 |
| 167696 | F | 22 |
| PCBM1641 | F | 23 |
| PCBM1662 | F | 31 |
| 8F3560 | F | 24 |
| 127756 | M | 43 |
| PCBM1655 | F | 47 |
MSCs from each donor were thawed and cultured at passage 1. When the cultures reached 80% confluence, cells were removed by trypsin (0.25% Trypsin/EDTA, Invitrogen Carlsbad, CA USA) and re-plated into flasks at passage 2. Once passage 2 cells became 80% confluent, MSCs were trypsinized, and the resulting passage 3 cells were cryopreserved in freezing medium containing 30% FBS (JM Bioscience San Diego, CA USA), 5% dimethyl sulfoxide (Sigma-Aldrich St. Louis, MO USA), 1% l-glutamine, and 1% penicillin (100 units/ml) and streptomycin (100ug/ml; Invitrogen Carlsbad, CA USA). An aliquot of cells was removed prior to cryopreservation to allow for continuous expansion to passages 3 (P3), 5 (P5), and 7 (P7) without any freezing in between. Therefore, once MSCs were expanded to a particular passage, they were only frozen one time. Each passage is considered the number of times the cells were trypsinized up until cryopreservation. The time to reach 80% confluence varied between cell lines and passages, and is reported in Table 2.
Table 2.
Time in culture to reach 80% confluence for all cell lines at passages 3, 5 and 7.
| P2 → P3 | P4 → P5 | P6 → P7 | |
|---|---|---|---|
| PCBM1632 | 7 | 8 | 17 |
| 110877 | 8 | 9 | 10 |
| 167696 | 8 | 10 | 12 |
| PCBM1641 | 7 | 8 | 8 |
| PCBM1662 | 10 | 9 | 12 |
| 8F3560 | 9 | 10 | 9 |
| 127756 | 9 | 11 | n/a |
| PCBM1655 | 14 | n/a | n/a |
Following trypsinization, cells from 5 to 13 flasks (from one cell line and one passage) were pooled and an aliquot was counted using an automated cell counter (Nexcelom Cellometer Lawrence, MA USA). MSCs were diluted 1:1 in trypan blue, and MSCs from each donor were cryopreserved at P3, P5 and P7 at 1×10⁶ cells/ml/vial. Cell lines 127756 and PCBM1655 could not be expanded past P5 and P3 respectively. Cell diameters were recorded by the cellometer at each passage for all cell lines, as described previously (53)
For automated microscopy experiments, MSCs were thawed, cultured until 80% confluence, and plated in 12-well plates at 10,000 cells/well. Following cell adhesion for 24 hours, adipogenic differentiation medium (NHAdipoDiff, Miltenyi Biotec Bergisch Gladbach Germany) was added to differentiation wells; undifferentiated controls were cultured in complete expansion medium. Medium was changed every 3 days and culture was continued until day 21. Plate setup for automated microscopy is described in greater detail in Figure 1. At day 21, MSCs were fixed with 10% formalin (Sigma-Aldrich St. Louis, MO USA) and stained with Nile Red dissolved in DMSO (Sigma-Aldrich St. Louis, MO USA) at a 5ug/ml final concentration for 45 minutes at room temperature to visualize lipid droplet formation within MSCs. Cells were washed with PBS, and nuclei were stained with 1mg/ml Hoechst dissolved in water (Sigma-Aldrich St. Louis, MO USA) for 30 seconds, followed by a rinse step with PBS.
Figure 1. Schematic of plate setup for automated microscopy experiments.

The outer 15% of each well was excluded from analysis to eliminate edge effects as noted by the dashed line. 25 random positions per well, indicated as blue dots, were selected by the software, and all wells were imaged at those identical positions. Imaging was completed at 10X magnification. Approximately 4% of the specified area was imaged for analysis. n=3 per passage per donor received adipogenic stimulation (pink wells); n=1 for undifferentiated controls (yellow wells).
Verification of Cell Lines
MSCs were thawed at P3, cultured until 80% confluent, then trypsinized, counted, and resuspended in PBS at 1 × 10⁶ cells/ml. 20μl of cell suspension was spotted on FTA sample collection cards and were allowed to dry. Sample collection cards were submitted to ATCC for their STR-based Cell Authentication Testing Service.
Flow Cytometry and Characterization
MSCs were thawed and cultured to 80% confluence, trypsinized and resusupended in FACS Buffer containing 1% FBS and 0.2% sodium azide in PBS. Cells were incubated with 2.4G2 antibody (ATCC) at 4°C for 30 minutes to block non-specific Fc receptor-mediated binding. Cells were then labeled with the following at 4°C for 30 min: positive MSC markers: anti-CD29-PE-Cy5, anti-CD44-APC, anti-CD73-PE-Cy7, anti-CD90-FITC, anti-CD166-PE (BD Pharmingen San Jose, CA USA), anti-CD105-PE (Beckman Coulter Indianapolis, IN USA); and negative MSC markers: anti-CD14-Alexa Fluor 488, anti-CD34-PE, anti-CD45-PE, HLA-DR-FITC (BD Pharmingen San Jose, CA USA), anti-CD79α-PE-Cy5, anti-CD117-APC (Beckman Coulter Indianapolis, IN USA). Flow cytometry data was recorded using the FACS Canto II (BD Biosciences San Jose, CA), and analysis was completed using Flow Jo Analysis Software (TreeStar Ashland, OR USA). Forward (FSC) and side scatter (SSC) data was recorded and analyzed to determine changes in cell size and granularity, and percent positive cells was measured for all markers mentioned above.
Colony Forming Unit Assay
MSCs were plated at 100 cells/dish in 10-cm dishes (BD Falcon San Jose, CA USA) in triplicate for all cell lines and passages. Cells were cultured for 14 days at 37°C and 5% CO2 with no media changes. At day 14, plates were washed with PBS, and stained with 3% Crystal Violet (Sigma-Aldrich St. Louis, MO USA) in 100% methanol for 10 minutes at room temperature. Plates were rinsed with tap water until clear then allowed to dry. Colonies that were greater than 2mm in diameter were counted, and the percent CFUs was reported per 100 cells seeded.
Microscopy
Widefield fluorescence microscopy was performed on a Nikon Ti-S inverted microscope with the addition of a Prior automated stage, excitation and emission filter wheels, episcopic shutter, and remote focus attachment. Acquisition of all datasets utilized a 10x, Plan Fluor objective, and Nikon Intensilight widefield illumination source. Filtering of excitation and emission wavelengths for both Hoechst and Nile Red fluorophores was accomplished using the appropriate filters of a Sedat Quad filter set from Chroma Technology (Hoechst Excitation Filter: 350nm peak, 50nm bandpass. Hoechst Emission Filter: 457nm peak, 50nm bandpass. Nile Red Excitation Filter: 490nm peak, 20nm bandpass. Nile Red Emission Filter: 617nm peak, 73nm bandpass). Acquisition of frames was accomplished with a Photometrics CoolSnap EZ, cooled, interline CCD. Multi-dimensional acquisition (intra-well, inter-well, multi-channel, and autofocus) was accomplished through NIS-Elements software. Sampling of each 12-well plate was employed by an acquisition routine such that each well would be imaged randomly in 25 locations, which excluded the outer 15% of each well (to exclude edge- effects). This randomly generated pattern was replicated (same locations with respect to each well) in the following wells to ensure that the gradient (from edge-to-center) was equally sampled in all wells and did not bias the resultant analysis. Order of acquisition proceeded to ensure the accuracy of the stage locations (with respect to channel registration) by capturing both channels before proceeding to the next location, as well as focal plane, by implementing an autofocus routine at each stage location. The autofocus routine utilized both Hoechst and Nile Red as reference channels, as the focal plane differed slightly in each channel.
Image Analysis
Image analysis was accomplished using NIS-Elements software, post-acquisition, by generating an analysis routine (macro) designed to automate the use of segmentation tools rather than performing a more manual, step-by-step analysis of each image. Once generated, the macro was run across an entire plate’s dataset (300 images per plate) or further streamlined by running across multiple plates in sequence. After each plate, the data was exported to Microsoft Excel for further data sorting and analysis. The goal of the segmentation routine was to count, in an automated fashion, the number of total nuclei (per 10x field) as well as the number of those nuclei that had an associated adipocyte marker (positive for Nile Red). The number of those positive for Nile Red could then be normalized to the number of total nuclei per image, which varied dramatically as the sampling location moved from edge to center. The normalized value was averaged across the 25 images in each well, and then averaged across 3 wells for n=3 for each donor at each passage. Data was plotted as the percentage of Nile Red positive cells. A detailed description of the macro commands and an explanation of each step can be seen in Table S1.
To ensure the accuracy of the generated macro, as well as demonstrate the variability of manually counting, an entire plate’s data set was counted manually by utilizing a taxonomy count option of NIS-Elements, whereby each of 3 separate users would click each individual nucleus, as well as those positive for Nile Red stain, as the software tallied the numbers. The manual analysis was completed for donor PCBM1632 at P3, P5 and P7.
Statistics
Statistical analyses for percent CFUs and percent Nile Red positive data were completed using GraphPad Prism 5. Data was grouped for comparisons between cell lines and between passages. For colony forming unit (n=3) and adipogenesis quantification (n=3), two-way ANOVA was preformed with a Bonferroni post-hoc analysis. CFUs and percent positive Nile Red data were expressed as the mean ± standard deviation. Statistical analyses for average cell diameter measurements (n≥6) were completed in statistical software IBM SPSS using one-way ANOVA followed by a Bonferroni post-hoc analysis to assess differences within cell lines relative to P3. Average cell diameter data was expressed as the mean ± standard error of the mean. P-values < 0.05 were considered significant.
Results
Verification and Expansion potential of MSCs
STR profile testing reports indicated all cell lines were human and did not match any profile in the ATCC 8-loci STR database. MSCs were cultured from donors ranging in age from 22 to 47 years old (Table 1), and were expanded to 80% confluence under identical growth conditions to ensure continuity between cell lines and passages. There were significant differences in growth potential between different cell lines and passages. Six out of eight lines were able to expand in cell culture to P7. In contrast, MSCs from 127756 (43 y/o) and PCBM1655 (47 y/o) was limited, as they were not capable of expansion beyond passage 5 and passage 3, respectively. However, PCBM1632 (24 y/o) shows limited growth potential by passage 7, requiring 17 days to become 80% confluent (Table 2). Other cell lines display a general trend such that more time is required to reach 80% confluence with increasing passage.
MSC phenotype by surface marker expression
MSCs have been characterized by their positive expression profile, including but not limited to, CD29, CD44, CD73, CD90, CD105 and CD166 (54). MSCs for all cell lines and passages were analyzed by flow cytometry based on this set of markers, to determine any changes in expression as a function of donor variability or culturing. All staining was done with the same antibodies, and events for all cell lines and passages were collected using the same cytometer settings. Gating analysis was based on unstained controls for each donor and each passage, to account for changes in forward and side scatter properties that are seen with increasing passage. The average percent positive expression for all cell lines within a passage was not significantly different between passages. Expression of CD44, CD73 and CD105 were consistently greater than 95% positive, while expression of CD29 remained above 90%. Slightly lower expression of CD90 was seen in PCBM1632 at 88.9%, 91.6%, and 92.4% at P3, P5, and P7 respectively; all other cell lines and passages showed greater than 95% expression. Cell line 127756 showed decreased expression of CD166 by passage 5 at 89.8%, however all other cell lines remained above 90% expression (Figure 2).
Figure 2. MSCs maintain expression of cell surface markers through passages.
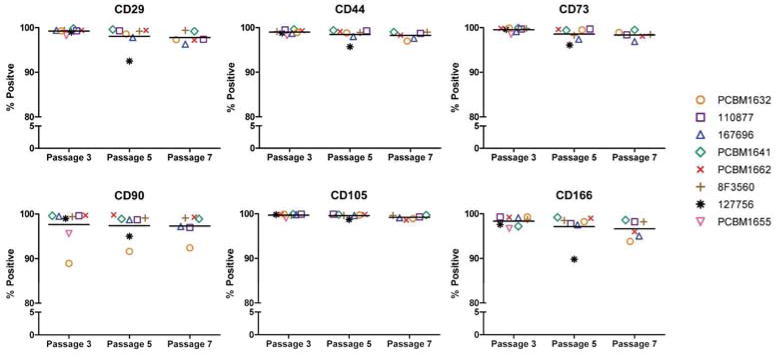
MSCs were stained for CD29, CD44, CD73, CD90, CD105 and CD166 at P3, P5 and P7. Gating was applied to unstained controls at each passage for each donor, and the percent positive was reported. Data is grouped by passage number, and horizontal bars indicate the average percent positive expression of all (applicable) cell lines at that passage. Each donor is represented as a unique symbol and color, as seen in the figure legend.
Cell size analysis
Acquisition of forward and side scatter data using flow cytometry allows for cell size (FSC) and granularity (SSC) parameters to be measured. We have extended our previous findings (53), and applied this analysis to additional cell lines. FSC/SSC quadrant gating was determined for P3 MSCs, and then applied to P5 and P7 for that same cell line; therefore, each cell line has its own individual P3 gate. The percent positive cells with high forward and side scatter in the upper right quadrant (URQ) was recorded, and plotted as seen in Figure 3A (n=1). An example of the FSC/SSC gating can be seen for cell line 167696 at P3 (left), P5 (center) and P7 (right) in Figure 3B. Most cell lines showed a trend toward increases in FSC and SSC with increasing passage. Both 127756 and PCBM1655 showed a higher percentage (11.2 and 17%, respectively) at P3 than the other cell lines. 8F3560 remained at a relatively stable value, varying between 8.4% (P3), 10.1% (P5) and 9.7% (P7).
Figure 3. MSCs increase in forward and side scatter with increasing passage.

(A) FSC/SSC quadrant gating was applied to each individual dot plot at P3. The P3 gates were applied to P5 and P7 for each particular cell line. Changes in percent positive cells in the Upper Right Quadrant (URQ) were recorded, plotted, and grouped by cell line; n=1. Purple bar = P3; orange bar = P5; green bar = P7. (B) Example of quadrant gating analysis on FSC/SSC dot plots from donor 167696 at P3 (left), P5 (center) and P7 (right). Percent positive in URQ is shown in the red dashed line following gating analysis.
Changes in cell size were also measured using a Cellometer, which measures the area of the cells in pixels, converts this measurement to a cell diameter, and then calculates the cell diameter assuming the cells are circular, as described in Lo Surdo and Bauer (53). During expansion of each cell line, cell numbers and diameters were recorded immediately prior to cryopreservation. As seen in Figure 4, all cell lines showed an increase in cell diameter from P3 to P7 (where applicable), and this increase in cell size is highly significant (p<0.01 8F3560, p<0.001 for all other cell lines). The increase in cell size with increasing passage as measured by the Cellometer is consistent with findings in Figure 3 as measured by flow cytometry.
Figure 4. MSCs increase in cell size with increasing passage, and vary between cell lines.

Bars represent average cell diameter (μm) counts of varying sample sizes (n ≥ 6), as determined by Cellometer measurements. Statistical comparisons were made within cell lines, relative to P3. Error bars represent standard error of the mean. Purple bar = P3; orange bar = P5; green bar = P7. ***p<0.001, **p<0.01, *p<0.05.
CFU Assay
Percent colony forming units (CFUs) are associated with stemness in populations of MSCs (55). Percent CFUs are highest at P3 for most cell lines, and decreased with increasing passage. Percent CFUs ranged from 10.7% (PCBM1655) to 45% (167696) at P3, and from 5.7% (PCBM1632) to 21.7% (110877) at P7. The cell lines that could not be cultured beyond P3 (PCBM1655) and P5 (127756) had the lowest CFU percentages at P3 at 10.7% and 19% respectively (Figure 5A). All cell lines showed a significant decrease in percent CFUs from P3 to P7, with the exception of 8F3560, which remained fairly constant between passages (Figure 5A). Statistical analyses between cell lines at P3 revealed highly significant (p<0.001) differences in most donor comparisons (Figure 5B).
Figure 5. Percentage of Colony Forming Units (CFUs) tend to decrease with increasing passage, and varies between cell lines.


(A) CFUs were calculated as a percentage by quantifying the number of colonies, and normalizing to the number of plated cells at Day 0. Error bars represent standard deviation; n=3. Purple bar = P3; orange bar = P5; green bar = P7. Statistical comparisons were made within cell lines, relative to P3. (B) Statistical analysis of CFU data for comparison between cell lines. Purple shading = P3, orange shading = P5, green shading = P7. For (A) and (B), ***p<0.001, **p<0.01, *p<0.05, ns = not significant, n/a = not applicable.
Quantification of adipogenesis and growth potential using automated microscopy
The application of automated microscopy as a high-throughput tool to quantify differentiation in MSCs is a novel approach in the field. We applied this technology to measure changes in adipogenic differentiation potential between cell lines and passages in MSCs. Following staining for differentiated adipocytes, images were acquired for all cell lines and passages using automated image capture techniques. Image acquisition for each plate (1 donor per 12-well plate, 2 fluorescence channels per image, 300 images per plate) required approximately 2 hours of imaging time. Once image sets were acquired for all cell lines, the macro analysis was run to quantify Nile Red positive and nuclei counts for each image. Figure 6 shows an example of Nile Red staining (A) and the same image following macro detection of differentiated adipocytes in a field of undifferentiated cells (B). Nile Red counts were normalized to nuclei counts in that image, averaged within one well and subsequently across three wells, and reported as a percentage of Nile Red positive cells. As seen in Figure 7A, adipogenic potential varies greatly between cell lines and consistently decreases as a result of passaging. 13.6% of MSCs from cell line PCBM1632 were capable of adipogenic differentiation at P3. This is in contrast to its 2.7% Nile Red positive cells at P7, indicating a 5-fold drop in adipogenic potential from P3 to P7, the largest drop in potential among all cell lines tested. Cell lines 127756 and PCBM1655, the cell lines that senesced by P5 and P3 respectively, demonstrated the 2nd and 3rd highest P3 adipogenic potential at 10.3% and 6.8% respectively. Donor 8F3560 had the lowest levels of percent positive Nile Red cells, where at all passages MSCs showed less than 1% adipogenic potential. Except for 8F3560, all cell lines showed a decrease in adipogenesis with an increase in passage, when cells were available to analyze. With the exception of 8F3560, this is highly significant with p≤0.001 when comparing P3 v. P7 (Figure 7A). The extent of variability between cell lines within a particular passage is seen in Figure 7B. While most donor comparisons at P3 are significant (p<0.05), MSCs converge to a low level of adipogenic potential by P7, as indicated by non-significant donor differences at P7 between most cell lines.
Figure 6. Example of Nile Red staining and adipocyte quantification.

(A) Image of differentiated adipocytes following 21 days induction. Nile Red positive staining (green) visualized as lipid vesicles indicating a differentiated adipocyte; nuclei staining with Hoechst (blue). Image taken during automated imaging at 10X magnification. (B) Following analysis by the macro, Nile Red positive cells were indicated with a green transparent overlay plus associated nuclei (orange). Nuclei not associated with Nile Red staining are shown as blue areas. As an example, the software detected 9 adipocytes in this image. Further analysis would include normalization of this value to total number of nuclei in this image to determine a percent of differentiated cells.
Figure 7. Adipogenesis can be quantified by automated microscopy, and demonstrates both donor variability and decreased adipogenic potential with increasing passage.


(A) Nuclei plus Nile Red objects were normalized by the total nuclei count per image to report a percentage of differentiated cells (% Nile Red positive) as a function of passage and cell line. Purple bar = P3; orange bar = P5; green bar = P7. Error bars represent standard deviation; n=3. Statistical comparisons were made within cell lines, relative to P3. (B) Statistical analysis of percent adipogenesis data for comparison between cell lines. Purple shading = P3, orange shading = P5, green shading = P7. For (A) and (B), ****p<0.0001, ***p<0.001, **p<0.01, *p<0.05, ns = not significant, n/a = not applicable.
To examine the accuracy of the macro in detecting Nile Red positive cells, three individual users manually counted the same image set used for automated quantification for cell line PCBM1632. Mean Nile Red positive cells at each passage were averaged across the three counters, indicated as the manual count (n=3), and plotted with the automated count (n=1) (Figure 8). With the assumption that the manual count is the accurate representation of the data, the automated counts by the macro come very close at P5 (10.52% manual v. 10.53% automated) and P7 (2.89% manual v. 2.68% automated), while the automated measurement at P3 is slightly higher in comparison to the manual count (13.62% automated v. 12.55% manual). These results indicate that the macro automated count is an accurate representation of what a user would identify as a differentiated adipocyte. In addition, when considering computation time, each user spent, on average, greater than 8 hours of counting time to count a single plate of 300 images. The software’s macro required less than 4 minutes to count a single plate with 92 %, or greater accuracy.
Figure 8. Manual quantification of percent positive Nile Red cells is in line with automated measurements in cell line PCBM1632.

The number of nuclei and Nile Red positive cells were quantified manually in cell line PCBM1632 by 3 different users (n=3). The same image set was used to quantify manually as was used in the automated macro count. The red bars indicate the manual counts (n=3) and the blue bars indicate automated counts (n=1). Error bars indicate standard deviation for the manual counts, n=3.
While the objective of this work was to quantify adipogenesis, the total nuclei counts harvested from the data sets also provide useful information when considering proliferative capacity in expansion medium vs. differentiation medium, but also as a comparison between cell lines and passages. As seen in Figure 9, following the addition of adipogenic differentiation media for 21 days, there is a decrease in proliferation compared to the corresponding passage controls within a particular donor, as indicated by the average nuclei count per image. This trend is seen in all cell lines and passages, and indicates MSCs decrease in proliferation following adipogenic stimulation. Further, this also demonstrates the decrease in the overall proliferative capacity with increasing passage, both following culture in normal expansion medium as well as in adipogenic differentiation medium.
Figure 9. Proliferative potential decreases with increasing passage, and decreases upon adipogenic stimulation.

The number of nuclei were quantified for each image, averaged across 25 images per well, then and averaged across 3 wells (n=3) following adipogenic stimulation. Nuclei were averaged in 1 well (25 images/well) following expansion in complete medium (n=1). The purple, orange, and green bars to the left within a cell line grouping indicate unstimulated controls for P3, P5 and P7 respectively, n=1. The light purple, orange and green bars to the right indicate adipogenic stimulation for P3, P5 and P7 respectively. Error bars on differentiated data points indicate standard deviation, n=3.
Discussion
MSCs are of great interest because of their potential clinical application in treating many diseases due to both their immunosuppressive properties as well as application in tissue regeneration (56). Because MSCs exist at low levels in the bone marrow (0.001 – 0.01%) (42), extensive passaging will often be required to achieve numbers necessary for clinical use. In addition, it will be useful to screen for differentiation capacity of MSCs from different donors. Therefore, establishing the role of passaging and donor differences through the use of quantitative bioassays will be necessary to measure these changes. Here, we have expanded upon our previously published work that quantified adipogenesis using a limiting dilution assay. Limiting dilution was used successfully to detect changes in adipogenic potential following differentiation between 2 cell lines at P3, P5, and P7 (53). The simplicity of the limiting dilution assay also allows for its use in almost any laboratory. However, this assay is subjective due to its reliance on an individual to discern between an adipocyte and an undifferentiated MSC. Further, because limiting dilution requires a dilution of MSCs as part of the assay setup and analysis, it may inherently ignore community effects, as Schinkothe et al. have demonstrated cytokine secretion profiles of MSCs include factors involved in proliferation and differentiation (57). Lastly, the time required for an individual to scan each well of three, 96-well plates for each experiment is significant. Automated microscopy addresses these concerns with limiting dilution, as MSCs are plated at an identical cell density, while also introducing an efficient, automated measurement that mitigates subjectivity in the analysis. We have taken advantage of these desirable features of automated microscopy to quantify adipogenic differentiation potential as a function of cell line and passage. In addition, we have correlated adipogenic progenitors with colony forming unity capacity and cell size, to further understand the role of donor differences and passaging on MSCs.
Automated microscopy is inherently precise, as identical parameters are used during each analysis to quantify differentiated adipocytes using the same automated procedure (macro). We applied automated microscopy to eight cell lines following differentiation to quantify adipogenic potential at P3, P5 and P7 where applicable. On the identical image set acquired for PCBM1632, we manually counted adipocytes to determine the accuracy of the macro in quantifying true differentiated cells. As seen in Figure 8, the macro is an accurate representation of the number of differentiated cells, based on very similar measurements at P5 and P7 between the automated and manual counts, while still close at P3. As can be seen in Figure 6, sometimes overlapping cells were observed, particularly in P3 where there were more cells per image than in subsequent passages (Figure 8). Although the issue of overlapping staining patterns due to high cell density was taken into account and adjusted for during development of the macro, the higher manual counts at P3 may nonetheless be due to conditions of high cell density, in which the macro was not always able to distinguish between overlapping cells. Taken together, this demonstrates both the precision and accuracy of automated microscopy in quantifying differentiated MSCs following adipogenic differentiation. Further, when considering computation time, the macro closely predicts actual values in close to 1% of the time it takes to manually count an image set. This result points to the utility of automated microscopy as a high-throughput tool to quantify adipogenic differentiation in MSCs.
A quantitative approach to measure adipogenesis of adipose-derived stromal cells was previously described by Sen et al., who quantified Nile Red staining by flow cytometry following 14 days of adipogenic stimulation then trypsin/EDTA removal of cells from tissue culture vessels (45). We have attempted this approach with bone marrow derived MSCs following 21 days of adipogenic stimulation, however fully differentiated adipocytes from MSCs derived from bone marrow were difficult to detach while maintaining the morphological integrity and intactness of the cells. This led us to adopt a method that would leave cells in situ before quantification.
The decreases we observed in proliferation and adipogenic capacity with passage, also correlate with the decrease in percent CFUs, as seen in Figure 5A. As outlined by Prockop et al., MSCs capable of clonal expansion are more proliferative and have a greater capacity to differentiate (22). Interestingly, cells from the 2 oldest donors (127756 and PCBM1655), which were not capable of expansion beyond P5 and P3 respectively, both had the lowest CFU percentage at P3 (Figure 5A), and also had the lowest proliferation potential as shown in Figure 9. In addition, both of these cell lines had the largest average cell diameters (Figure 4) which also correlated their respective FSC/SSC size data (Figure 3A). This suggests donor age may play a role in growth potential and CFU capacity, which in turn correlates with cell size. Others have shown the function of cell size as well, as Colter et al. demonstrated a high correlation with recycling stem cells (a subpopulation of small, agranular, rapidly proliferating cells) and CFU capacity compared to the large, granular mature MSCs that are a slow growing subpopulation (55). Stenderup et al. also showed MSCs from younger donors had improved proliferative capacity over older donors based on higher cumulative population doublings and a lower percentage of senescence-associated beta-galactosidase (43). However, despite the decrease in percent CFUs and increase in cell size seen in both of these cell lines at P3, both cell lines 127756 and PCBM1655 had the 2nd and 3rd highest percent adipogenic differentiation when compared to cells from other younger donors at P3. While this finding goes against our hypothesis that those MSCs with the lowest CFU capacity and largest cell diameters would be less likely to differentiate, there may be multiple factors at play. Many have hypothesized a shift from high osteogenic and low adipogenic capacity in young donor MSCs to a low osteogenic and high adipogenic capacity in older donor MSCs due to the downregulation of osteogenesis-associated genes with age (58, 59). In many cases, aging leads to a decrease in bone mass, as seen in osteoporosis, while typically accompanied by larger number of adipocytes in the bone marrow (60). This proposed inverse relationship between adipogenesis and osteogenesis has been reviewed extensively by Kim et al (61). Almeida et al. have suggested that this shift may be in part due to oxidative stress during aging, through the involvement of FoxO transcription factors that are cellular mediators of oxidative stress (62). Taken together, this paradigm describing the shift from osteogenesis to adipogenesis in the bone marrow as we age, may explain our findings described here.
Both researchers and manufacturers of MSCs use cell surface markers to characterize MSCs. As outlined in a white paper published by the International Society for Cellular Therapy, it is accepted in the field that MSCs should be plastic-adherent cells that are positive for CD73, CD90 and CD105, negative for CD14, CD34, CD45, CD79a, and HLA-DR, and capable of tri-lineage differentiation (63). Our findings demonstrate that while MSCs from different donors and passages maintain expression of CD73, CD90, CD105, and other relevant MSC markers (Figure 2), this maintenance of positive expression does not correlate with their decreased functionality/differentiation capacity. In particular, expression of these cell surface markers does not correlate with maintenance of adipogenic precursors through passaging. Further, it is widely accepted that trilineage differentiation is a required characteristic of MSCs, but quantitative assessments of this capacity are not often reported. To date, it has been acceptable in the literature to show differentiation by simple staining techniques, or by semi-quantitative methods that do not take into account the inherent heterogeneity of MSCs by quantifying on a per cell basis. Here, we have developed an efficient method to quantify adipogenesis while also assessing the effects of passaging and donor variability on differentiation capacity in vitro. By quantifying differentiation capacity, we are also able to correlate these findings with other quantitative bioassay readouts to provide an overview of donor variability while also assessing the effects of culturing on MSC stemness and potency.
It is important to point out that the methods we describe here provide precise measurements of adipocyte precursors that arise under specific culture conditions and using a specific adipogenic induction protocol. The in vivo biological ability of MSCs to give rise to adipocytes cannot be determined by this approach. However, this method provides a precise, quantitative measurement that can compare biological characteristics of cells grown in vitro in the same conditions. This method could be used to make precise measurements that allow for comparisons of adipogenic potential in a variety of different in vitro growth conditions and determine the influence of many other factors that could affect MSC growth and differentiation.
Conclusions
We have expanded MSCs from several cell lines to P3, P5, and P7 to demonstrate the role of donor variability and passaging on MSCs using automated microscopy as a quantitative readout of adipogenic differentiation on a per cell basis. We have successfully quantified adipogenesis in MSCs to demonstrate variability between cell lines and decreased adipogenic potential with increasing passage. Although we could reproducibly measure differences in adipogenesis and other biological functions in cells from different donors and passages, MSC cell surface marker analysis revealed no changes. We hope to use these quantitative bioassays to better understand how adipogenic capacity relates to CFU, overall proliferative capacity and cell size in different populations of MSCs. Using these quantitative approaches, we have introduced methods that can be used to better understand heterogeneity of MSCs and to address issues of inconsistency in experimental outcomes.
Supplementary Material
Acknowledgments
The authors would like to acknowledge Eva Rudikoff for her assistance in growing the MSCs, and Drs. Brenton McCright, Deborah Hursh, and Patrick Lynch for reviewing this manuscript. This project was supported in part by Jessica Lo Surdo’s appointment to the Research Participation Program at CBER administered by the Oak Ridge Institute for Science and Education through US DOE and US FDA. This work was also supported in part by the FDA Modernizing Science grant program, a BARDA grant, a grant from the Medical Countermeasures Initiative, and research funds from the Division of Cell and Gene Therapies.
Footnotes
Disclosure of Interest
The authors have no disclosure of interest to report.
Publisher's Disclaimer: This is a PDF file of an unedited manuscript that has been accepted for publication. As a service to our customers we are providing this early version of the manuscript. The manuscript will undergo copyediting, typesetting, and review of the resulting proof before it is published in its final citable form. Please note that during the production process errors may be discovered which could affect the content, and all legal disclaimers that apply to the journal pertain.
References
- 1.Hung SC, Chang CF, Ma HL, Chen TH, Low-Tone Ho L. Gene expression profiles of early adipogenesis in human mesenchymal stem cells. Gene. 2004 Sep 29;340(1):141–50. doi: 10.1016/j.gene.2004.06.028. [DOI] [PubMed] [Google Scholar]
- 2.Janderova L, McNeil M, Murrell AN, Mynatt RL, Smith SR. Human mesenchymal stem cells as an in vitro model for human adipogenesis. Obes Res. 2003 Jan;11(1):65–74. doi: 10.1038/oby.2003.11. [DOI] [PubMed] [Google Scholar]
- 3.Nakamura T, Shiojima S, Hirai Y, Iwama T, Tsuruzoe N, Hirasawa A, et al. Temporal gene expression changes during adipogenesis in human mesenchymal stem cells. Biochem Biophys Res Commun. 2003 Mar 28;303(1):306–12. doi: 10.1016/s0006-291x(03)00325-5. [DOI] [PubMed] [Google Scholar]
- 4.Post S, Abdallah BM, Bentzon JF, Kassem M. Demonstration of the presence of independent pre-osteoblastic and pre-adipocytic cell populations in bone marrow-derived mesenchymal stem cells. Bone. 2008 Jul;43(1):32–9. doi: 10.1016/j.bone.2008.03.011. [DOI] [PubMed] [Google Scholar]
- 5.Sekiya I, Larson BL, Vuoristo JT, Cui JG, Prockop DJ. Adipogenic differentiation of human adult stem cells from bone marrow stroma (MSCs) J Bone Miner Res. 2004 Feb;19(2):256–64. doi: 10.1359/JBMR.0301220. [DOI] [PubMed] [Google Scholar]
- 6.Augello A, De Bari C. The regulation of differentiation in mesenchymal stem cells. Hum Gene Ther. 2010 Oct;21(10):1226–38. doi: 10.1089/hum.2010.173. [DOI] [PubMed] [Google Scholar]
- 7.Briggs T, Treiser MD, Holmes PF, Kohn J, Moghe PV, Arinzeh TL. Osteogenic differentiation of human mesenchymal stem cells on poly(ethylene glycol)-variant biomaterials. J Biomed Mater Res A. 2009 Dec 15;91(4):975–84. doi: 10.1002/jbm.a.32310. [DOI] [PMC free article] [PubMed] [Google Scholar]
- 8.Chen DF, Li H, Zhou JH, Xie Y, Li YW, Du SH, et al. Osteogenesis characteristics of cultured rat mesenchymal stem cells under bone induction condition. Journal of Chinese Integrative Medicine. 2004 Sep;2(5):375–8. doi: 10.3736/jcim20040519. [DOI] [PubMed] [Google Scholar]
- 9.de Girolamo L, Sartori MF, Albisetti W, Brini AT. Osteogenic differentiation of human adipose-derived stem cells: comparison of two different inductive media. J Tissue Eng Regen Med. 2007 Mar-Apr;1(2):154–7. doi: 10.1002/term.12. [DOI] [PubMed] [Google Scholar]
- 10.Donzelli E, Salvade A, Mimo P, Vigano M, Morrone M, Papagna R, et al. Mesenchymal stem cells cultured on a collagen scaffold: In vitro osteogenic differentiation. Arch Oral Biol. 2007 Jan;52(1):64–73. doi: 10.1016/j.archoralbio.2006.07.007. [DOI] [PubMed] [Google Scholar]
- 11.Long MW. Osteogenesis and bone-marrow-derived cells. Blood Cells Mol Dis. 2001 May-Jun;27(3):677–90. doi: 10.1006/bcmd.2001.0431. [DOI] [PubMed] [Google Scholar]
- 12.Arufe MC, De la Fuente A, Fuentes I, de Toro FJ, Blanco FJ. Chondrogenic potential of subpopulations of cells expressing mesenchymal stem cell markers derived from human synovial membranes. J Cell Biochem. 2010 Nov 1;111(4):834–45. doi: 10.1002/jcb.22768. [DOI] [PubMed] [Google Scholar]
- 13.Kim HJ, Lee JH, Im GI. Chondrogenesis using mesenchymal stem cells and PCL scaffolds. J Biomed Mater Res A. 2009 Feb;92(2):659–66. doi: 10.1002/jbm.a.32414. [DOI] [PubMed] [Google Scholar]
- 14.Mueller MB, Fischer M, Zellner J, Berner A, Dienstknecht T, Prantl L, et al. Hypertrophy in mesenchymal stem cell chondrogenesis: effect of TGF-beta isoforms and chondrogenic conditioning. Cells Tissues Organs. 2010;192(3):158–66. doi: 10.1159/000313399. [DOI] [PMC free article] [PubMed] [Google Scholar]
- 15.Ronziere MC, Perrier E, Mallein-Gerin F, Freyria AM. Chondrogenic potential of bone marrow- and adipose tissue-derived adult human mesenchymal stem cells. Biomed Mater Eng. 2010 Jan 1;20(3):145–58. doi: 10.3233/BME-2010-0626. [DOI] [PubMed] [Google Scholar]
- 16.Worster AA, Brower-Toland BD, Fortier LA, Bent SJ, Williams J, Nixon AJ. Chondrocytic differentiation of mesenchymal stem cells sequentially exposed to transforming growth factor-beta1 in monolayer and insulin-like growth factor-I in a three-dimensional matrix. J Orthop Res. 2001 Jul;19(4):738–49. doi: 10.1016/S0736-0266(00)00054-1. [DOI] [PubMed] [Google Scholar]
- 17.Bosnakovski D, Mizuno M, Kim G, Takagi S, Okumura M, Fujinaga T. Isolation and multilineage differentiation of bovine bone marrow mesenchymal stem cells. Cell Tissue Res. 2005 Feb;319(2):243–53. doi: 10.1007/s00441-004-1012-5. [DOI] [PubMed] [Google Scholar]
- 18.Delorme B, Charbord P. Culture and characterization of human bone marrow mesenchymal stem cells. Methods Mol Med. 2007;140:67–81. doi: 10.1007/978-1-59745-443-8_4. [DOI] [PubMed] [Google Scholar]
- 19.Digirolamo CM, Stokes D, Colter D, Phinney DG, Class R, Prockop DJ. Propagation and senescence of human marrow stromal cells in culture: a simple colony-forming assay identifies samples with the greatest potential to propagate and differentiate. Br J Haematol. 1999 Nov;107(2):275–81. doi: 10.1046/j.1365-2141.1999.01715.x. [DOI] [PubMed] [Google Scholar]
- 20.Friedenstein AJ, Gorskaja JF, Kulagina NN. Fibroblast precursors in normal and irradiated mouse hematopoietic organs. Exp Hematol. 1976 Sep;4(5):267–74. [PubMed] [Google Scholar]
- 21.Gregory CA, Prockop DJ, Spees JL. Non-hematopoietic bone marrow stem cells: molecular control of expansion and differentiation. Exp Cell Res. 2005 Jun 10;306(2):330–5. doi: 10.1016/j.yexcr.2005.03.018. [DOI] [PubMed] [Google Scholar]
- 22.Prockop DJ, Sekiya I, Colter DC. Isolation and characterization of rapidly self-renewing stem cells from cultures of human marrow stromal cells. Cytotherapy. 2001;3(5):393–6. doi: 10.1080/146532401753277229. [DOI] [PubMed] [Google Scholar]
- 23.Spees JL, Whitney MJ, Sullivan DE, Lasky JA, Laboy M, Ylostalo J, et al. Bone marrow progenitor cells contribute to repair and remodeling of the lung and heart in a rat model of progressive pulmonary hypertension. FASEB J. 2008 Apr;22(4):1226–36. doi: 10.1096/fj.07-8076com. [DOI] [PubMed] [Google Scholar]
- 24.Banas A, Teratani T, Yamamoto Y, Tokuhara M, Takeshita F, Quinn G, et al. Adipose tissue-derived mesenchymal stem cells as a source of human hepatocytes. Hepatology. 2007 Jul;46(1):219–28. doi: 10.1002/hep.21704. [DOI] [PubMed] [Google Scholar]
- 25.Brayfield C, Marra K, Rubin JP. Adipose stem cells for soft tissue regeneration. Handchir Mikrochir Plast Chir. 2010 Apr;42(2):124–8. doi: 10.1055/s-0030-1248269. [DOI] [PubMed] [Google Scholar]
- 26.Cherubino M, Marra KG. Adipose-derived stem cells for soft tissue reconstruction. Regen Med. 2009 Jan;4(1):109–17. doi: 10.2217/17460751.4.1.109. [DOI] [PubMed] [Google Scholar]
- 27.Kokai LE, Rubin JP, Marra KG. The potential of adipose-derived adult stem cells as a source of neuronal progenitor cells. Plast Reconstr Surg. 2005 Oct;116(5):1453–60. doi: 10.1097/01.prs.0000182570.62814.e3. [DOI] [PubMed] [Google Scholar]
- 28.Zuk PA, Zhu M, Mizuno H, Huang J, Futrell JW, Katz AJ, et al. Multilineage cells from human adipose tissue: implications for cell-based therapies. Tissue Eng. 2001 Apr;7(2):211–28. doi: 10.1089/107632701300062859. [DOI] [PubMed] [Google Scholar]
- 29.Deasy BM, Jankowski RJ, Huard J. Muscle-derived stem cells: characterization and potential for cell-mediated therapy. Blood Cells Mol Dis. 2001 Sep-Oct;27(5):924–33. doi: 10.1006/bcmd.2001.0463. [DOI] [PubMed] [Google Scholar]
- 30.Huard J. Regenerative medicine based on muscle stem cells. J Musculoskelet Neuronal Interact. 2008 Oct-Dec;8(4):337. [PubMed] [Google Scholar]
- 31.Jankowski RJ, Deasy BM, Huard J. Muscle-derived stem cells. Gene Ther. 2002 May;9(10):642–7. doi: 10.1038/sj.gt.3301719. [DOI] [PubMed] [Google Scholar]
- 32.Park SB, Seo MS, Kang JG, Chae JS, Kang KS. Isolation and characterization of equine amniotic fluid-derived multipotent stem cells. Cytotherapy. 2010 Sep 22; doi: 10.3109/14653249.2010.520312. [DOI] [PubMed] [Google Scholar]
- 33.Yoon BS, Moon JH, Jun EK, Kim J, Maeng I, Kim JS, et al. Secretory profiles and wound healing effects of human amniotic fluid-derived mesenchymal stem cells. Stem Cells Dev. 2009 Jun;19(6):887–902. doi: 10.1089/scd.2009.0138. [DOI] [PubMed] [Google Scholar]
- 34.Castrechini NM, Murthi P, Gude NM, Erwich JJ, Gronthos S, Zannettino A, et al. Mesenchymal stem cells in human placental chorionic villi reside in a vascular Niche. Placenta. 2010 Mar;31(3):203–12. doi: 10.1016/j.placenta.2009.12.006. [DOI] [PubMed] [Google Scholar]
- 35.Aggarwal S, Pittenger MF. Human mesenchymal stem cells modulate allogeneic immune cell responses. Blood. 2005 Feb 15;105(4):1815–22. doi: 10.1182/blood-2004-04-1559. [DOI] [PubMed] [Google Scholar]
- 36.Barry FP, Murphy JM. Mesenchymal stem cells: clinical applications and biological characterization. Int J Biochem Cell Biol. 2004 Apr;36(4):568–84. doi: 10.1016/j.biocel.2003.11.001. [DOI] [PubMed] [Google Scholar]
- 37.Chen X, Armstrong MA, Li G. Mesenchymal stem cells in immunoregulation. Immunol Cell Biol. 2006 Oct;84(5):413–21. doi: 10.1111/j.1440-1711.2006.01458.x. [DOI] [PubMed] [Google Scholar]
- 38.Fiorina P, Jurewicz M, Augello A, Vergani A, Dada S, La Rosa S, et al. Immunomodulatory function of bone marrow-derived mesenchymal stem cells in experimental autoimmune type 1 diabetes. J Immunol. 2009 Jul 15;183(2):993–1004. doi: 10.4049/jimmunol.0900803. [DOI] [PMC free article] [PubMed] [Google Scholar]
- 39.Le Blanc K. Mesenchymal stromal cells: Tissue repair and immune modulation. Cytotherapy. 2006;8(6):559–61. doi: 10.1080/14653240601045399. [DOI] [PubMed] [Google Scholar]
- 40.Le Blanc K, Tammik L, Sundberg B, Haynesworth SE, Ringden O. Mesenchymal stem cells inhibit and stimulate mixed lymphocyte cultures and mitogenic responses independently of the major histocompatibility complex. Scand J Immunol. 2003 Jan;57(1):11–20. doi: 10.1046/j.1365-3083.2003.01176.x. [DOI] [PubMed] [Google Scholar]
- 41.Clinical Trials.gov. 2012 [updated 2012; cited 2012 November 28]; Available from: http://clinicaltrials.gov/ct2/results?term=mesenchymal+stem+cells&pg=1&show_flds=Y.
- 42.Caplan AI. The mesengenic process. Clin Plast Surg. 1994 Jul;21(3):429–35. [PubMed] [Google Scholar]
- 43.Stenderup K, Justesen J, Clausen C, Kassem M. Aging is associated with decreased maximal life span and accelerated senescence of bone marrow stromal cells. Bone. 2003 Dec;33(6):919–26. doi: 10.1016/j.bone.2003.07.005. [DOI] [PubMed] [Google Scholar]
- 44.Bonab MM, Alimoghaddam K, Talebian F, Ghaffari SH, Ghavamzadeh A, Nikbin B. Aging of mesenchymal stem cell in vitro. BMC Cell Biol. 2006;7:14. doi: 10.1186/1471-2121-7-14. [DOI] [PMC free article] [PubMed] [Google Scholar]
- 45.Sen A, Lea-Currie YR, Sujkowska D, Franklin DM, Wilkison WO, Halvorsen YD, et al. Adipogenic potential of human adipose derived stromal cells from multiple donors is heterogeneous. J Cell Biochem. 2001 Mar 26;81(2):312–9. doi: 10.1002/1097-4644(20010501)81:2<312::aid-jcb1046>3.0.co;2-q. [DOI] [PubMed] [Google Scholar]
- 46.Dexheimer V, Mueller S, Braatz F, Richter W. Reduced reactivation from dormancy but maintained lineage choice of human mesenchymal stem cells with donor age. PLoS One. 2011;6(8):e22980. doi: 10.1371/journal.pone.0022980. [DOI] [PMC free article] [PubMed] [Google Scholar]
- 47.Taipaleenmaki H, Abdallah BM, AlDahmash A, Saamanen AM, Kassem M. Wnt signalling mediates the cross-talk between bone marrow derived pre-adipocytic and pre- osteoblastic cell populations. Exp Cell Res. 2011 Apr 1;317(6):745–56. doi: 10.1016/j.yexcr.2010.12.015. [DOI] [PubMed] [Google Scholar]
- 48.Pevsner-Fischer M, Levin S, Zipori D. The origins of mesenchymal stromal cell heterogeneity. Stem Cell Rev. 2011 Sep;7(3):560–8. doi: 10.1007/s12015-011-9229-7. [DOI] [PubMed] [Google Scholar]
- 49.Gronthos S, Graves SE, Ohta S, Simmons PJ. The STRO-1+ fraction of adult human bone marrow contains the osteogenic precursors. Blood. 1994 Dec 15;84(12):4164–73. [PubMed] [Google Scholar]
- 50.Psaltis PJ, Paton S, See F, Arthur A, Martin S, Itescu S, et al. Enrichment for STRO-1 expression enhances the cardiovascular paracrine activity of human bone marrow-derived mesenchymal cell populations. J Cell Physiol. 2010 May;223(2):530–40. doi: 10.1002/jcp.22081. [DOI] [PubMed] [Google Scholar]
- 51.Jarocha D, Lukasiewicz E, Majka M. Adventage of mesenchymal stem cells (MSC) expansion directly from purified bone marrow CD105+ and CD271+ cells. Folia Histochem Cytobiol. 2008;46(3):307–14. doi: 10.2478/v10042-008-0046-z. [DOI] [PubMed] [Google Scholar]
- 52.Larson BL, Ylostalo J, Lee RH, Gregory C, Prockop DJ. Sox11 is expressed in early progenitor human multipotent stromal cells and decreases with extensive expansion of the cells. Tissue Eng Part A. 2010 Nov;16(11):3385–94. doi: 10.1089/ten.tea.2010.0085. [DOI] [PMC free article] [PubMed] [Google Scholar]
- 53.Lo Surdo J, Bauer SR. Quantitative approaches to detect donor and passage differences in adipogenic potential and clonogenicity in human bone marrow-derived mesenchymal stem cells. Tissue Eng Part C Methods. 2012 Nov;18(11):877–89. doi: 10.1089/ten.tec.2011.0736. [DOI] [PMC free article] [PubMed] [Google Scholar]
- 54.Pittenger MF. Mesenchymal stem cells from adult bone marrow. Methods Mol Biol. 2008;449:27–44. doi: 10.1007/978-1-60327-169-1_2. [DOI] [PubMed] [Google Scholar]
- 55.Colter DC, Class R, DiGirolamo CM, Prockop DJ. Rapid expansion of recycling stem cells in cultures of plastic-adherent cells from human bone marrow. Proc Natl Acad Sci U S A. 2000 Mar 28;97(7):3213–8. doi: 10.1073/pnas.070034097. [DOI] [PMC free article] [PubMed] [Google Scholar]
- 56.Kode JA, Mukherjee S, Joglekar MV, Hardikar AA. Mesenchymal stem cells: immunobiology and role in immunomodulation and tissue regeneration. Cytotherapy. 2009;11(4):377–91. doi: 10.1080/14653240903080367. [DOI] [PubMed] [Google Scholar]
- 57.Schinkothe T, Bloch W, Schmidt A. In vitro secreting profile of human mesenchymal stem cells. Stem Cells Dev. 2008 Feb;17(1):199–206. doi: 10.1089/scd.2007.0175. [DOI] [PubMed] [Google Scholar]
- 58.Jiang Y, Mishima H, Sakai S, Liu YK, Ohyabu Y, Uemura T. Gene expression analysis of major lineage-defining factors in human bone marrow cells: effect of aging, gender, and age-related disorders. J Orthop Res. 2008 Jul;26(7):910–7. doi: 10.1002/jor.20623. [DOI] [PubMed] [Google Scholar]
- 59.Moerman EJ, Teng K, Lipschitz DA, Lecka-Czernik B. Aging activates adipogenic and suppresses osteogenic programs in mesenchymal marrow stroma/stem cells: the role of PPAR-gamma2 transcription factor and TGF-beta/BMP signaling pathways. Aging Cell. 2004 Dec;3(6):379–89. doi: 10.1111/j.1474-9728.2004.00127.x. [DOI] [PMC free article] [PubMed] [Google Scholar]
- 60.Takada I, Kouzmenko AP, Kato S. Wnt and PPARgamma signaling in osteoblastogenesis and adipogenesis. Nat Rev Rheumatol. 2009 Aug;5(8):442–7. doi: 10.1038/nrrheum.2009.137. [DOI] [PubMed] [Google Scholar]
- 61.Kim M, Kim C, Choi YS, Park C, Suh Y. Age-related alterations in mesenchymal stem cells related to shift in differentiation from osteogenic to adipogenic potential: implication to age-associated bone diseases and defects. Mech Ageing Dev. 2012 May;133(5):215–25. doi: 10.1016/j.mad.2012.03.014. [DOI] [PubMed] [Google Scholar]
- 62.Almeida M, Han L, Martin-Millan M, O’Brien CA, Manolagas SC. Oxidative stress antagonizes Wnt signaling in osteoblast precursors by diverting beta-catenin from T cell factor- to forkhead box O-mediated transcription. J Biol Chem. 2007 Sep 14;282(37):27298–305. doi: 10.1074/jbc.M702811200. [DOI] [PubMed] [Google Scholar]
- 63.Dominici M, Le Blanc K, Mueller I, Slaper-Cortenbach I, Marini F, Krause D, et al. Minimal criteria for defining multipotent mesenchymal stromal cells. The International Society for Cellular Therapy position statement. Cytotherapy. 2006;8(4):315–7. doi: 10.1080/14653240600855905. [DOI] [PubMed] [Google Scholar]
Associated Data
This section collects any data citations, data availability statements, or supplementary materials included in this article.