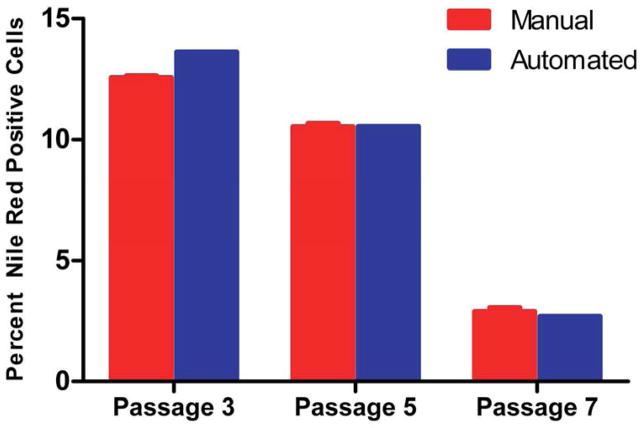
Figure 8. Manual quantification of percent positive Nile Red cells is in line with automated measurements in cell line PCBM1632.
The number of nuclei and Nile Red positive cells were quantified manually in cell line PCBM1632 by 3 different users (n=3). The same image set was used to quantify manually as was used in the automated macro count. The red bars indicate the manual counts (n=3) and the blue bars indicate automated counts (n=1). Error bars indicate standard deviation for the manual counts, n=3.

