

Abstract
Studies in altricial rodents attribute dramatic changes in perinatal cardiomyocyte growth, maturation, and attrition to stimuli associated with birth. Our purpose was to determine whether birth is a critical trigger controlling perinatal cardiomyocyte growth, maturation and attrition in a precocial large mammal, sheep (Ovis aries). Hearts from 0–61 d postnatal lambs were dissected or enzymatically dissociated. Cardiomyocytes were measured by micromorphometry, cell cycle activity assessed by immunohistochemistry, and nuclear number counted after DNA staining. Integration of this new data with published fetal data from our laboratory demonstrate that a newly appreciated >30% decrease in myocyte number occurred in the last 10 d of gestation (P < 0.0005) concomitant with an increase in cleaved poly (ADP-ribose) polymerase 1 (P < 0.05), indicative of apoptosis. Bisegmental linear regressions show that most changes in myocyte growth kinetics occur before birth (median = 15.2 d; P < 0.05). Right ventricular but not left ventricular cell number increases in the neonate, by 68% between birth and 60 d postnatal (P = 0.028). We conclude that in sheep few developmental changes in cardiomyocytes result from birth, excepting the different postnatal degrees of free wall hypertrophy between the ventricles. Furthermore, myocyte number is reduced in both ventricles immediately before term, but proliferation increases myocyte number in the neonatal right ventricle.—Jonker, S. S., Louey, S., Giraud, G. D., Thornburg, K. L., Faber, J. J. Timing of cardiomyocyte growth, maturation, and attrition in perinatal sheep.
Keywords: apoptosis, cell number, fetus, neonate, proliferation
The heart is the first organ to visibly function in the embryo. It beats continuously as it morphs from a single beating tube to a loop heart and then to a 4-chambered heart. All the while, the working cardiomyocytes progress through their own maturational processes. In the first two-thirds of gestation, ovine myocytes are rapidly dividing mononucleated cells. Later, DNA replication and nuclear division are not always followed by cell division, and most mononucleated myocytes become terminally differentiated binucleated cells that no longer can create daughter cells. In mice, which are immature at birth, this process occurs in the newborn (1, 2). However, we and others have shown that terminal differentiation is already about 75% complete at term in sheep (3, 4). In mice, terminal differentiation occurs following birth and has been attributed to the major physiologic changes that occur at the transition to extrauterine life.
Among mammalian adults there is a linear relationship between cardiac mass and myocyte nuclei number (5). This relationship holds over a more than hundredfold range of adult heart weights, regardless of whether the relative birth weight (compared with adult weight) is low (e.g., rodents, pigs, rabbits, dogs) or high (e.g., humans, cattle, sheep, horses). The age at which an individual achieves its full complement of cardiomyocytes and nuclear number is unclear (6–9), although it is thought to be related to maturation of the cardiac excitation-contraction coupling system and myocardial metabolism, which occur shortly after birth (10–12). Birth results in dramatic changes for the cardiovascular system, including a doubling of the partial pressure of oxygen in arterial blood (13), changed nutrient supply (14), and changed hormone profile (15, 16). Most importantly, birth effects a redistribution of central blood flow, with increased systemic arterial pressure and reduced pulmonary arterial pressure (17–19). These factors, especially hemodynamic pressures, are known to be powerful modulators of heart growth and function.
Most studies investigating growth of immature myocytes have been performed in rats and mice and have yielded a wealth of information about basic cellular processes and the genes regulating cardiac cell cycle control (20). There are significant differences between heart development of rodents and large mammals (1–4), but we do not know whether birth as the transitionary time for cardiomyocyte growth is evolutionarily conserved in large mammals. The perinatal timing, and magnitude, of changes in myocyte growth kinetics is relevant to a fundamental understanding of developmental regulation and may inform our understanding of the cardiac risks faced by preterm infants (21). We hypothesized that birth is a significant triggering event in the growth kinetics of ovine myocytes, after which myocyte enlargement increases rapidly and cardiomyocyte number is fixed.
MATERIALS AND METHODS
Ethical approval
All protocols were approved by the Institutional Animal Care and Use Committee and conducted according to the principles outlined in the Care and Use of Laboratory Animals, as well as all relevant laws and regulations.
Animals
Twenty-seven healthy, normal neonatal sheep (Ovis aries) of mixed Western breeds between postnatal age 0 to 61 d (age of weaning) were purchased from a commercial supplier (Agna LLC, Salem, OR, USA). Mean postconceptional age at spontaneous, vaginal birth was 147 ± 1 (sd) d and birth weight was 4.7 ± 0.8 kg (n = 18, as data were not available from all lambs). Both sexes were represented evenly throughout the age range (12 female and 15 male); male neonates were supplied as wethers (castrated).
All lambs were weighed and then killed with a commercial sodium pentobarbital solution, which arrests the heart in diastole. Hearts from 11 neonates were dissected into component parts [atria, free walls of the left ventricle (LV) and right ventricle (RV), intraventricular septum] following anatomic landmarks (3). Hearts from 16 neonates were enzymatically dissociated and cells were fixed with formaldehyde (3).
Myocyte measurements
Myocyte morphometry
Calibrated long-axis length and maximal perpendicular width measurements were taken from photomicrographs of isolated myocytes according to a random, nonrepeating method (3). Mono-, bi-, and quadrinucleated myocytes were measured separately (termed “nucleation categories”). Mono- and quadrinucleated myocytes were rare in some animals; nevertheless, no fewer than 9 myocytes were measured for each category (the average in each category was 42). Trinucleated myocytes were extremely rare and were grouped with quadrinucleated myocytes for all measurements.
A shape factor was determined to calculate myocyte volume from length and width measurements (3). To determine this factor, it was assumed that myocytes were symmetrical around their long axis and that the shape of each myocyte could be approximated by a series of truncated right circular cones. Each nucleation category was considered independently: 9–12 myocytes were measured per category from each free wall.
Number of nuclei per myocyte
The nuclei of at least 300 myocytes from each ventricle of each animal were counted to determine the fractions of mono-, bi-, and quadrinucleated cells.
Cell cycle activity
The anti–Ki-67 antibody MIB-1 (Dako, Carpinteria, CA, USA) was used to detect cell cycle activity as has been described previously (3). At least 500 cells for analysis were counted per ventricle per animal.
Calculations
Calculations to determine cardiac myocyte number were performed as previously described (3), with minor modifications. Ages in equations were counted as days postconception (dPC). Birth is designated as 147 d after conception as this was the mean age at spontaneous vaginal delivery. Calculations were made separately for each of the LV and RV. The proportional relationship between free wall weight and heart weight between d 1 and 61 was derived from values measured in 11 neonates in which the undigested cardiac components were weighed. This relationship was used to calculate the free wall weights from total heart weight for each heart that was enzymatically dissociated. To correct ventricular weights for the nonmyocyte portion, ventricular weights were multiplied by an age-corrected value (LV: 0.6375 + 0.001159 dPC; RV: 0.694 + 0.0008377 dPC) (22), yielding the cardiac myocyte weight (Wmyo) of each ventricle in grams. Assuming a density of 1 g/ml, volume and weight may be used interchangeably.
The total number of myocytes (Ntotal) was calculated by taking into account the cell volumes (e.g., Vmon) and the fractions (e.g., Fmon) represented by each nucleation category. Thus:
The numbers of each population of myocytes (Nmon, Nbi, and Nquad, for mononucleated, binucleated, and quadrinucleated, respectively) were determined from the total number of myocytes using the fraction of cells of that type found in each heart, for example:
Immunofluorescence imaging
Cells were subject to immunofluorescence staining for myosin (ab15; Abcam, Cambridge, MA, USA) and a nuclear stain (Hoechst 33342). Images were obtained at the Oregon Health & Science University Advanced Light Microscopy Core using a Deltavision CoreDV Widefield Deconvolution system (Applied Precision, Issaquah, WA, USA) built on an Olympus IX71 inverted microscope (Olympus America, Center Valley, PA, USA). After deconvolution, images were processed with Fiji software (23) to adjust contrast and brightness for each channel.
Western blot analysis
Banked ventricular tissue from 19 fetuses and 8 neonates was used to quantitate total and cleaved poly (ADP-ribose) polymerase 1 (PARP-1), which is cleaved by caspases and other protease effectors of apoptosis. Tissues were frozen in liquid nitrogen at collection and stored at −80°C. Experimental and positive control tissue (adult sheep tonsils) were bead homogenized (TissueLyser LT; Qiagen, Germantown, MA, USA) for 4 min at 50 Hz in RIPA buffer (Life Technologies, Grand Island, NY, USA) with protease inhibitors (cOmplete Mini EDTA-free, Roche, Indianapolis, IN, USA). Proteins were quantified by bicinchoninic acid assay (Life Technologies). Equal amounts of protein (20 µg) and a ladder (PageRuler Prestained Protein ladder; Thermo Scientific, Waltham, MA, USA) were electrophoresed on an 8% acrylamide gel at 120V for 1 h 45 min (Bio-Rad, Hercules, CA, USA). The protein was transferred onto nitrocellulose membranes at 100V for 1 h (GE Healthcare Bio-Sciences, Pittsburgh, PA, USA). Equal loading was confirmed by Ponceau S staining. Blots were blocked with 5% milk-TBST for 1 h at room temperature, incubated overnight at 4°C with an 1:1000 antibody against PARP-1 (antibody #9542; Cell Signaling, Danvers, MA, USA), incubated for 30 min at room temperature with an 1:2000 horseradish peroxidase–conjugated anti-rabbit secondary antibody, incubated with chemiluminescence substrate (SuperSignal West Dura Extended Duration Substrate; Thermo Scientific), and then visualized (ChemiDoc-it; UVP, Upland, CA, USA). The PARP-1 antibody detects full-length and cleaved PARP-1. Densitometry was performed on these bands using Fiji (23).
Statistical analysis
We compared neonatal data with our previously published fetal data (3). Animals in this study were obtained from the same supplier, using the same husbandry techniques as in the previous study. Tissue-processing techniques were identical, and measurements were made by the same person in both studies.
To determine if growth rates were constant or changed in the perinatal period, data were analyzed by comparing simple linear regression to bisegmental linear regression model for each measurement. This comparison was performed using the extra sum-of-squares F test to determine if the improved fit of the more complex model was better than expected to occur by chance (P < 0.05; results displayed in the Model Comparison column of Tables 1 and 2) (24). If bisegmental linear regression was selected, the intersection of the 2 regression lines indicated the age at which the growth rate changed (referred to as the breakpoint, or X0), and was determined by best-fit analysis (unconstrained). The line for ages younger than the breakpoint was reported as the fetal segment and the line for ages older than the breakpoint, as the neonatal segment (whereas neonatal period refers only to the period after birth). Body and heart weight were log transformed prior to analysis. The neonatal segment of the free wall:heart weight ratio, and the entirety of the relationships between mononucleation or binucleation and age were fit by nonlinear regression. Linear regressions were performed on the myocyte number data from the neonatal period. Perinatal myocyte number data were binned and compared by 1-way ANOVA followed by Sidak tests. Ratios of cleaved to whole PARP1 from Western blots were compared across age groups by Kruskal-Wallis test followed by Dunn’s multiple comparisons test. Statistical analysis was performed with GraphPad Prism version 5.0c for Mac OSX (GraphPad Software, San Diego, CA, USA). A value of P < 0.05 was considered significant. Data are presented as means ± sd, and in the figures as mean ± 95% confidence interval (CI).
TABLE 1.
Combined fetal and neonatal cardiomyocyte data sets that are statistically best fit by linear regression, where y = slope (dPC) + intercept
| Parameter | Linear equation | R2 | Model comparison |
|---|---|---|---|
| Heart/body weight (g/kg) | −0.01408 dPC + 8.76 | 0.1593 | P > 0.22 |
| Cell length and width (μm) | |||
| LV quadrinucleate length | 0.7513 dPC + 2.438 | 0.7581 | — |
| LV quadrinucleate width | 0.1682 dPC − 6.51 | 0.4894 | — |
| RV quadrinucleate length | 0.6862 dPC + 14.68 | 0.5996 | — |
| RV mononucleate width | 0.05564 dPC + 6.154 | 0.6227 | P > 0.19 |
| RV binucleate width | 0.07102 dPC + 6.58 | 0.5019 | P > 0.18 |
| RV quadrinucleate width | 0.07132 dPC + 10.04 | 0.279 | — |
| Cell length:width ratio | |||
| LV mononucleate length:width | −0.02 dPC + 8.373 | 0.3704 | P > 0.65 |
| LV binucleate length:width | −0.03148 dPC + 10.91 | 0.4396 | P > 0.67 |
| LV quadrinucleate length:width | −0.009306 dPC + 7.583 | 0.05814 | — |
| RV quadrinucleate length:width | 0.01087 dPC + 4.107 | 0.09089 | — |
| Cell volume, μm3 | |||
| LV quadrinucleate volume | 801.4 dPC − 103,113 | 0.5799 | — |
| RV quadrinucleate volume | 376.4 dPC − 32,567 | 0.4573 | — |
| Myocyte and nuclei number (109) | |||
| LV neonatal period myocyte number | 9.721(10−5) dPC + 0.9023 | 0.0001083 | — |
| LV neonatal period nuclei number | 4.633(10−3) dPC + 0.9858 | 0.08577 | — |
| RV neonatal period myocyte number | 4.941(10−3) dPC − 0.2933 | 0.3001 | — |
| RV neonatal period nuclei number | 9.967(10−3) dPC − 0.6694 | 0.3878 | — |
| RV cell cycle activity (% of all myocytes) | −0.07452 dPC + 13.46 | 0.3653 | P > 0.26 |
TABLE 2.
Combined fetal and neonatal cardiomyocyte data sets that are statistically best fit by regression of 2 intersecting straight lines, in which the left (“fetal”) segment takes the form y = slopef (dPC) + interceptf, the right (“neonatal”) segment takes the form y = slopef (X0) + interceptf + slopen (dPC – X0), intersecting at x = X0 (“breakpoint”)
| Parameter | Fetal segment | X0, mean (95% CI) | Neonatal segment | Goodness of fit (R2) | Model comparison |
|---|---|---|---|---|---|
| Weight | |||||
| Log body weight (kg) | 0.0183 dPC − 1.831 | 128.6 (121.8–135.4) | 0.01044 (dPC − 128.6) + 0.52238 | 0.9631 | P < 0.0001 |
| Log heart weight (g) | 0.01813 dPC − 0.9569 | 128 (120.0–136.0) | 0.009203 (dPC − 128) + 1.366374 | 0.9297 | P < 0.0001 |
| LV weight (g) | 0.1425 dPC − 12.03 | 143.3 (136.4–150.2) | 0.5833 (dPC − 143.3) + 8.39025 | 0.964 | P < 0.0001 |
| RV weight (g) | 0.1381 dPC − 11.85 | 163 (142.0–184.0) | 0.2689 (dPC − 163) + 10.6603 | 0.9430 | P = 0.0002 |
| Cell length and width (μm) | |||||
| LV mononucleate length | −0.08488 dPC + 68.64 | 118.6 (108.5–128.6) | 0.3906 (dPC − 118.6) + 58.573232 | 0.7371 | P < 0.0001 |
| LV binucleate length | −0.1434 dPC + 99.16 | 132.2 (124.9–139.4) | 0.6583 (dPC − 132.2) + 80.20252 | 0.7252 | P < 0.0001 |
| LV mononucleate width | 0.0133 dPC + 8.298 | 125.7 (119.3–132.1) | 0.1449 (dPC − 125.7) + 9.96981 | 0.8907 | P < 0.0001 |
| LV binucleate width | −0.0207 dPC + 13.42 | 124.9 (119.1–130.6) | 0.1918(dPC − 124.9) + 10.83457 | 0.8647 | P < 0.0001 |
| RV mononucleate length | −0.2056 dPC + 90.4 | 128.2 (122.4–134.0) | 0.4051 (dPC − 128.2) + 64.04208 | 0.6993 | P < 0.0001 |
| RV binucleate length | −0.195 dPC + 113.9 | 132.7 (124.6–140.8) | 0.534 (dPC − 132.7) + 88.0235 | 0.615 | P < 0.0001 |
| Cell length:width ratio | |||||
| RV mononucleated length:width | −0.04222 dPC + 10.13 | 120 (107.4–132.6) | 0.002037 (dPC − 120) + 5.0636 | 0.275 | P < 0.001 |
| RV binucleate length:width | −0.02816 dPC + 9.625 | 145.4 (118.9–172.0) | 0.007378 (dPC − 145.4) + 5.530536 | 0.1888 | P < 0.05 |
| Cell volume (μm3) | |||||
| LV mononucleate volume | 38.83 dPC − 1754 | 140.4 (135.7–145.1) | 242.1 (dPC − 140.4) + 3697.732 | 0.9262 | P < 0.0001 |
| LV binucleate volume, | 35.35 dPC + 819.8 | 137.6 (133.3–141.8) | 476 (dPC − 137.6) + 5683.96 | 0.9161 | P < 0.0001 |
| RV mononucleate volume | 27.39 dPC + 1352 | 129 (119.3–138.7) | 120 (dPC − 129) + 4885.31 | 0.8241 | P < 0.0001 |
| RV binucleate volume | 47.24 dPC + 3436 | 130.5 (117.7–143.3) | 228.7 (dPC − 130.5) + 9600.82 | 0.7252 | P = 0.0005 |
| Myocyte and nuclei number (109) | |||||
| LV fetal period myocyte number | 0.02619 dPC − 1.970 | 135.9 (133.6–138.2) | −0.1125 (dPC − 135.9) + 1.589221 | 0.6150 | P < 0.0001 |
| LV fetal period nuclei number | 0.0433 dPC − 3.703 | 136.0 (132.6–139.5) | −0.1155 (dPC − 136.0) + 2.1858 | 0.7027 | P = 0.0005 |
| RV fetal period myocyte number | 0.0185 dPC − 1.534 | 136 (133.3–138.7) | −0.075 (dPC - 136) + 0.982 | 0.6317 | P < 0.0001 |
| RV fetal period nuclei number | 0.02801 dPC - 2.499 | 136 (132.0–140.0) | −0.06005 (dPC − 136) + 1.31036 | 0.7205 | P < 0.002 |
| LV cell cycle activity (% of all myocytes) | −0.1498 dPC + 21.64 | 131.3 (117.3–145.4) | −0.0292 (dPC − 131.3) + 1.97126 | 0.5719 | P = 0.0007 |
| Number of nuclei per cell (%) | |||||
| LV quadrinucleation | 0.001477 dPC − 0.1086 | 142.4 (133.3–151.6) | 0.1142 (dPC − 142.4) + 0.1017248 | 0.6815 | P < 0.0001 |
| RV quadrinucleation | −3.879 (10−10) dPC − 4.903 (10−08) | 124.4 (110.3–138.4) | 0.03695 (dPC − 124.4) − 7.7524 (10−10) | 0.5651 | P < 0.004 |
RESULTS
Heart and body mass
Fetal and neonatal sheep exhibited exponential growth of heart and body, with a prenatal slowing in growth that begins at the breakpoint (X0) of about 128 dPC, almost 3 wk prior to birth (Fig. 1A and Table 2). Body and heart weight regressions were compared between males (n = 54) and females (n = 48) and were not significantly different. Heart:body weight ratio declined at a constant rate across the period studied (Table 1). Both the LV and RV free walls increased in weight in the neonatal segment, but their growth rates were unequal (Fig. 1B and Table 2; P < 0.0001). At birth the LV:heart and RV:heart weight ratios were nearly equal at ∼0.29 (Fig. 1C); however, a breakpoint occurred at 143.7 dPC (95% CI: 133.8–153.7) for LV:heart and at 146.4 dPC (CI: 142.9 to 149.9) for RV:heart weight ratio. After this breakpoint, the LV:heart weight ratio climbed rapidly and then plateaued at ∼0.37. During the same time period, the RV:heart mass ratio dropped rapidly, plateauing at ∼0.18. The LV:heart weight ratio was best fit by this segmental regression model (R2 = 0.73), as was the RV:heart weight ratio (R2 = 0.70).
Figure 1.

A) The increase in heart and body weight slows somewhat near birth (n = 114). B) LV and RV free wall weights are similar in fetal sheep. After birth both free walls continue to increase in weight, but the LV does so more rapidly than the RV (combined n = 39; P = 0.0075). C) The ratio of each free wall to total heart weight diverged rapidly at birth (n = 39). Regression (solid) lines and 95% CI (dashed) best fit to each data set are shown; bars show the 95% CI of the breakpoint. Fetal data from Jonker et al. (3). Regression data are included in the text and Tables 1 and 2.
Cell size
There was a significant increase in cellular dimensions of all classes of myocytes in the neonatal segment or period (Fig. 2; all P < 0.0001 except LV quadrinucleate width, P = 0.0037; RV quadrinucleate length, P = 0.0007; and RV quadrinucleate width, P = 0.043). The growth rate for RV myocyte width was constant between the fetal and neonatal periods, as evidenced by the statistical preference for linear rather than segmental linear regression of these data (Fig. 2D and Table 1). In both ventricles, and at all fetal and neonatal ages, myocytes with more nuclei were longer and wider than those with fewer nuclei (Fig. 2).
Figure 2.

A, B) Cardiomyocyte length was best described by bisegmental regression, with increased growth occurring in the neonatal segment (n = 79 fetuses and neonates were studied, of which n = 75 LV and n = 74 RV had binucleated myocytes, and n = 15 had quadrinucleated myocytes in sufficient quantities to measure; at least 100 myocytes were measured per ventricle of each animal). C, D) Cardiomyocyte width was best described by bisegmental regression only in the LV; linear regression best describes myocyte width in the RV. Shown are the best-fit linear regression lines (solid) of each data set and 95% CI (dashed); bars show 95% CI of the breakpoints. Fetal data from Jonker et al. (3). Regression data are included in Tables 1 and 2. bi, binucleate; mono, mononucleate.
Changes in myocyte length:width ratio indicate more rapid growth along the long or short cell axis. In the LV, the length:width ratio of mono- and binucleated (but not quadrinucleated) myocytes declined with advancing age as a result of more rapid growth in width than in length (P < 0.0001), but no perinatal changes in growth rates were found (note the negative slopes in Table 1). In contrast, the decline in RV myocyte length:width ratios slowed near term (note the negative slopes in the fetal segment of Table 2), and we did not detect continued change in the neonatal segment (P > 0.4).
All myocyte volumes increased with age in the neonatal period or segment [Fig. 3, note positive slopes in Tables 1 and 2; all P < 0.0001 except quadrinucleate volume LV (P = 0.001) and RV (P = 0.0056)]; volume of binucleated myocytes increased twice as fast in the LV as in the RV (P < 0.0001). Myocyte volume change was examined as a function of nuclei number per cell. Growth rates per nucleus of all classes of myocytes, regardless of nucleation, were similar within each ventricle (in the fetal segment LV 25.5 μm3 nucleus−1 d−1, RV 22.14 μm3 nucleus−1 d−1; X0 LV 138.5 dPC, RV 129.5 dPC; in the neonatal segment LV 233.8 μm3 nucleus−1 d−1, RV 113.2 μm3 nucleus−1 d−1; Fig. 3A, B). Myocyte volume per nucleus was found to be independent of cellular nucleation; indeed binucleated myocytes were on average twice the size of mononucleated myocytes at all ages across all the animals studied, and this relationship was not different between the LV and RV (Fig. 3D). This led to a close relationship between myocyte volume per nucleus and age (Fig. 3C). Although in the fetal segment, myocyte volumes per nucleus were greater in RV than in LV myocytes, after the change in growth rate (X0) LV myocytes began growing faster than RV myocytes (P < 0.0001) and soon overtook RV myocytes in volume per nucleus.
Figure 3.

LV (A) and RV (B) cell volumes were calculated and were best fit by bisegmental regression that showed increased growth in the neonatal segment (n = 79 fetuses and neonates were studied, of which only n = 75 LV and n = 74 RV had binucleated myocytes. LV and RV quadrinucleated myocytes were only measured in n = 15 of the neonates. At least 100 myocytes were measured per ventricle of each animal). C) The cardiomyocytes cell volume per nucleus increased rapidly in the postnatal segment. D) The slope of the relationship of binucleated and mononucleated myocyte volume between ventricles is not significantly different from 2 for the LV (n = 75) or RV (n = 74), indicating that cell volume is similarly regulated as a function of nuclei number in mononucleated and binucleated myocytes. Fetal data from Jonker et al. (3). Regression (solid) lines and 95% CI (dashed) best fit to each data set are shown; bars show 95% CI of the breakpoints. Regression data are included in Tables 1 and 2. bi, binucleate; mono, mononucleate.
Cell cycle activity and nucleation
Approximately 29% of LV myocytes were still mononucleated at birth; a negligible percentage had more than 2 nuclei (the overwhelming majority of which were quadrinucleated), and most were binucleated (Fig. 4A and Table 3). The percentage of LV myocytes that were mononucleated dropped rapidly to ∼7% at 3 wk of age and less than 5% at 8 wk of age (Table 3). Concurrently, the number of LV myocytes with more than 2 nuclei (quadrinucleated) increased to ∼7% at 8 wk of age. Nucleation of RV myocytes showed similar trends as in LV myocytes (Fig. 4B and Table 3). Approximately 22% of RV myocytes were mononucleated at birth, and a negligible percentage was quadrinucleated. The percentage of RV myocytes that were mononucleated dropped to ∼13% at 3 wk, and remained constant thereafter. Only 2.9% of RV myocytes at 8 wk of age were quadrinucleated. Myocyte morphology changed from a tapered to blockier shape, although at all ages organization of the contractile elements was clear (Fig. 5). Cellular morphology was reflected by changes in the shape factor, a ratio of myocyte volume to the volume predicted by a cylindrical model based on myocyte length and width. Bisegmental regression was statistically preferred for LV and RV binucleate myocytes (X0 = 176 and 163.4 dPC, respectively), and RV mononucleates (X0 = 168.6).
Figure 4.

In the LV (A) and RV (B), the percent of cardiomyocytes with 1 nucleus declines rapidly before birth (n = 79 animals, at least 300 myocytes per ventricle of each animal were counted). Most of these myocytes become binucleated. A small but growing proportion of neonatal cardiomyocytes have 4 or more nuclei. In the LV (C) and RV (D), the proportion of myocytes in the cell cycle is low at birth (n = 79 animals, at least 500 myocytes per ventricle of each animal were counted). Insets: Cell cycle activity normalized to the proportion of myocytes that are mononucleated. Fetal data from Jonker et al. (3). Regression lines (solid) and 95% CI (dashed; best fit to each data set) are shown; bars show quadrinucleate 95% CI of the breakpoints. Regression data are included Tables 1, 2, and 3. mono, mononucleate.
TABLE 3.
Combined fetal and neonatal data sets that are statistically best fit by nonlinear regression, where y = a2 + (a1 − a2) / (1 + e (K0 – dPC)/slope)
| Parameter | Equation | R2 |
|---|---|---|
| LV mononucleation (%) | 2.976 + 100.824/(1+ e−(135.1 − dPC)/11.31) | 0.9482 |
| LV binucleation (%) | −3.143 + 94.173/(1+ e(133.8 − dPC)/10.57) | 0.9459 |
| RV mononucleation (%) | 10.96 + 89.84/(1+ e−(133.4 − dPC)/8.802) | 0.9537 |
| RV binucleation (%) | −0.7731 + 87.8031/(1+ e(133.1 − dPC)/8.755) | 0.9548 |
Figure 5.
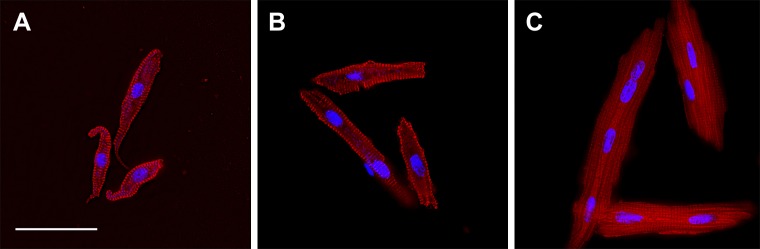
LV cardiomyocytes from sheep 92 dPC (A), 1 d after birth (B), and 45 d after birth (C). Cells imaged for myosin (red) and DNA (cyan). Scale bar, 50 μm (applies to all panels).
Myocytes active in the cell cycle (as assessed by Ki-67 immunostaining) were mainly mononucleated. Cell cycle activity in myocytes was variable between animals (Fig. 4C, D). Despite this variability, cell cycle activity within each neonate was correlated between the LV and RV (Pearson's r = 0.5768, P = 0.0193, n = 16). On average, ∼1% of all myocytes in either the LV or the RV were active in the cell cycle in the week after birth. Cell cycle activity as a percentage of all cells declined in the neonatal segment (LV P = 0.001, RV P < 0.0001). Approximately 5% of mononucleated myocytes were active in the cell cycle; there was also no significant relationship between age and cell cycle activity as a percentage of mononucleated myocytes.
Cell number
Myocyte numbers were calculated from cell volumes and the mono- and binucleate fractions of the LV and RV masses. Although not appreciated in the former analysis (3), a substantial decline in fetal myocyte number is evident when the fetal data are displayed together with neonatal myocyte number (Fig.6A, B). Accordingly, fetal myocyte numbers were analyzed by bisegmental regression, and neonatal myocyte numbers were analyzed by linear regression. These independent regressions have a compatible intersection at the time of birth, confirming the good continuity of the fetal and neonatal data also observed in Figs. 1–4.
Figure 6.

LV (A) and RV (B) total free wall myocyte numbers in the fetus and neonate. Bisegmental linear regressions were fitted to the previously published fetal data (n = 63 fetuses) from Jonker et al. (3). Separately, linear regressions were fitted to the neonatal data (n = 16 neonates). An increase in RV but not the LV cell number was found during the neonatal period (P = 0.028). Regression lines (solid) and 95% CI (dashed; best fit to each data set) are shown; bars show 95% CI of the breakpoints. Regression data are included in Tables 1 and 2. LV (C) and RV (D) myocyte numbers were compared at 10 d intervals before term and after birth. Comparison of adjacent ages (mean 134 ± 1 dPC, n = 6; 140 ± 1 dPC, n = 13; 4 ± 2 d postnatal, n = 5) determined that total myocyte number decreased immediately prior to birth (by 34% in the LV and 38% in the RV), but not at birth. sd of total number is shown. Quadrinucleate myocytes contribute less than the thickness of the line to any group. E) LV and (F) RV abundance of cleaved to whole PARP-1 was compared in early gestation and at 10 d intervals before term and after birth (mean 94 ± 1 dPC, n = 6; 133 ± 3 dPC, n = 7; 139 ± 2 dPC, n = 7; 4 ± 3 d postnatal, n = 7). Error bars show standard error of the mean. G) A representative PARP-1 Western blot. Blot image is inverted. Ladder overlay is contrast-enhanced white light image.
Bisegmental linear regressions of fetal myocyte numbers were statistically significantly better than linear regressions (RV and LV both P < 0.0001). These regressions demonstrated that myocyte number increased until 136 d of gestation, after which cell number steeply declined (Fig. 6A, B). To better understand the apparent perinatal decrease in myocyte number, numbers were compared at 10 d intervals before term and after birth (Fig. 6C, D). Total myocyte number was found to decline prior to birth by 34% in the LV (P < 0.0001) and 38% in the RV (P = 0.0003), but not after birth. The prenatal decline in total cell number was due to reduced mononucleated cell number: in the LV, mononucleated number dropped by 47% between 128 and 137 dPC (11–20 d before birth) and between 138 and 147 dPC (1–10 d before birth; P < 0.0001) and 59% between 138 and 147 dPC and 0–9 d after birth (P = 0.0107), whereas no significant changes were detected in LV binucleated number. In the RV, mononucleated number dropped by 55% between 128 and 137 dPC and 138 and 147 dPC (P = 0.0012), but no significant changes were detected in RV binucleated number.
In the neonatal period, LV cell number could not be shown to change by linear regression (Fig. 6A) but RV cell number increased (Fig. 6B; P = 0.028). The number of myocyte nuclei also increased in the RV (P = 0.01), but in the LV nuclear number did not change significantly.
Bisegmental vs. simple linear regression
Two-phase growth (bisegmental linear analysis) was statistically the best fitting model for most cardiomyocyte size, growth, and maturation parameters considered (P values for model comparison rejection of the simple linear regression are noted in the tables). Notably, nearly all of the breakpoints occurred prior to birth. The median age at which the breakpoint occurred was 131.8 d postconception (range 118.6–176.0 d; different from the age at birth by 2-tailed Wilcoxon signed-rank test; P < 0.05).
Western blot analysis
Total and cleaved PARP-1 was compared between 90 and 100 dPC, 128 and 137 dPC, 138 and 147 dPC and 0–9 d after birth. Total PARP-1 levels were different between groups in both LV and RV (P < 0.05); in the LV, total levels were higher at 128–137 than 138–147 dPC (P < 0.05). Cleaved PARP-1 fragments, as a ratio to whole PARP-1 (Fig. 6E–G), were different between age groups in both ventricles (P < 0.05). Cleaved to whole PARP-1 ratios were higher at 128–137 than 138–147 dPC in the LV, and higher at 138–147 dPC than in newborns in the RV (P < 0.05).
DISCUSSION
Contrary to our hypothesis, the perinatal change for most cardiomyocyte parameters occurred prior to birth rather than at or after birth. In both ventricles, total cell and nuclei numbers started to decrease at about 136 dPC and had fallen by about one-third by the time of birth. This corroborates reports of a wave of cell deaths in the rodent heart (25) but contradicts the notion that this is stimulated by birth. In our study, cell numbers did not decrease further after birth. To the contrary, total cell and nuclei numbers increased after birth in the RV.
The role of birth in cardiac maturation
We found most parameters of cardiac myocyte growth to have different rates between the fetus and neonate. However, we found when we performed best-fit bisegmental linear regressions, the intersections of the fetal and neonatal segments most often fell before birth (median 131.8). We expected birth to mark the transition to a neonatal growth phenotype. However, there are considerable hormonal, neuroendocrine, and autonomic changes in the late gestation fetus that may alter cardiomyocyte growth trajectories prior to birth (15). It may be that these signals are more powerful determinants of myocyte maturation than term birth. If so, this finding has implications for stressed pregnancies and preterm infants in whom the normal milieu is disrupted.
Cardiomyocyte attrition
In rodents, myocyte apoptosis is reported to increase at birth, especially in the RV (25–27) and is thought to contribute to remodeling of the heart in response to the changes in hemodynamic forces occurring at birth (28, 29). However, in the sheep we found a substantial (greater than 30%) loss of cell number in both the LV and RV immediately prior to birth, driven by reduced numbers of mononucleated cells. PARP-1, a nuclear protein involved in DNA repair, is a target for caspases and other apoptosis effectors and is cleaved in apoptotic cells (30). In addition to whole PARP-1 (116 kDa), we analyzed caspase-cleaved PARP-1 (89 kDa), and a ∼61 kDa fragment cleaved by another protease (30). Higher levels of cleaved PARP-1 in near-term fetal hearts support our speculation that the myocyte attrition observed is due to apoptosis.
In the current study, we cannot distinguish whether mononucleated cells died or whether binucleated cells died but were replaced by terminal differentiation of mononucleated myocytes. In any case, a wave of cell attrition does reduce myocyte number in the immature ovine heart, but not in response to birth. It is relevant that other investigators have found that hearts of young lambs were more susceptible to apoptotic stimuli than those of older lambs (31), indicating a relative predisposition to apoptosis in the less mature cardiomyocyte. It has been proposed that the signal leading to perinatal myocyte loss is associated with angiotensin, either due to withdrawal from the cell cycle or altered hemodynamic forces (27, 29). The exact regulatory mechanisms driving cell apoptosis or survival, and the benefit to the organism of an apoptotic wave, are unknown but are of considerable interest given the role that myocyte number plays in heart disease.
Cell cycle activity and terminal differentiation
Despite a decreasing percentage of cells entering the cell cycle (Fig. 4C, D) and a decreasing percentage of cell cycle activity ending in cytokinesis (Fig 4A, B), the generation rate of new myocytes remained high until 136 dPC (Fig. 6A, B). This was possible because the total number of myocytes in the cell cycle (for example, the product of Fig. 4C and Fig. 6A) does not begin to decline until 136 d of gestation. Further, until 120 dPC more than half of cell cycle activity ends in cytokinesis, which expands the pool of proliferation-capable mononucleated cardiomyocytes (3). Finally, the cell cycle may progress more rapidly with advancing gestational age (3).
We found that generation of new myocytes contributed to RV growth in the normally growing newborn lamb (Fig. 6B). As neonatal myocytes in the cell cycle occasionally display the morphologic characteristics of cytokinesis, we reason that mitotic division of functional myocytes drives the increase in RV cell number. Because proliferation and terminal differentiation change the number of mononucleated myocytes in predictable ways (3), we determined that cell cycle activity was balanced between these outcomes in the neonatal RV. In contrast, in this study we were unable to detect proliferative expansion of cardiomyocyte number in the neonatal LV (Fig. 6A).
Interestingly, hearts of 9-wk-old sheep born prematurely do not have fewer myocytes than those born at term (32), suggesting that birth itself does not reduce the capacity of cardiac myocytes to divide. It is unknown if large mammals experience a juvenile surge in myocyte number through division of functional myocytes, as has recently been shown in mice (33). In mammals, division of functional myocytes is restricted by maturation, and wholesale myocyte renewal is limited to immature hearts. Our finding that proliferation continued to grow myocyte number in the RV after birth suggests that immature characteristics are retained in at least some myocytes in the heart of the neonatal large mammal.
As the cellular mechanism of terminal differentiation is poorly understood, no definitive marker for terminal differentiation of perinatal cardiac myocytes has been determined. Given the distribution of cell cycle activity and mitotic figures, it is generally thought that mononucleated cardiac myocytes have proliferative potential but binucleated myocytes do not. However, even in the absence of multiple nuclei, nuclear DNA copy greater than 2n is thought to indicate terminal differentiation in the human (6, 34, 35). In 3-wk-old lambs, of the tiny minority of myocytes which remain mononucleated, about half are tetraploid (32). The ploidy of mononucleated myocytes in the late gestation fetal heart is unknown (and cannot be determined in this study). If tetraploid mononucleated myocytes are terminally differentiated the proliferative potential of the late gestation heart may be considerably lower than indicated by the mononucleation index.
Different growth and roles of the RV and LV before and after birth
In the neonatal heart, the LV grows more rapidly than the RV (Fig. 1A), leading to a dramatic divergence in the free wall:heart weight ratios (Fig. 1B). This is primarily due to binucleated myocytes, which comprise the majority of myocytes in the neonatal heart and enlarge 2 times faster in the neonatal LV than in the RV (Fig. 3A, B). We estimated that enlargement of binucleated myocytes is responsible for ∼75% of neonatal LV free wall growth, but only 50% in the RV. In the neonatal RV, proliferation and formation of binucleated myocytes each contribute ∼20% to total free wall growth. The remaining growth is due to formation of quadrinucleated myocytes, and enlargement of mononucleates and quadrinucleates.
In the immature heart, the LV and RV often exhibit similar trends, yet also consistent differences, in myocyte maturation and growth. Binucleated myocytes are almost exactly twice the size of mononucleated myocytes from the same ventricle at any age studied (Fig. 3D), yet RV myocytes are larger than LV myocytes at any given age prior to birth. This indicates that myocyte size is regulated with age as a function of its DNA content and which ventricle it belongs to, regardless of maturational status. Differences between the LV and RV may be the result of a myocyte identity acquired during embryonic heart looping (36), but are perhaps more likely due to hemodynamic or other physiologic factors to which cardiomyocytes are sensitive (37–39).
LV myocytes grow more rapidly in width than in length, leading to a significant decline in their length:width ratio. This is stereotypical of concentric hypertrophy, and in the nondevelopmental situation is considered a feedback response to pressure overload (39). In contrast, the length:width ratio of RV myocytes remains the same through the neonatal period. These neonatal growth patterns likely result from changes in hemodynamic forces following birth (18, 19, 39, 40).
CONCLUSIONS
In this study we show that most cardiac myocyte growth trajectories change prior to birth in the sheep. Also occurring before birth is a wave of cell loss that reduces myocyte number by about a third in both the LV and RV. Despite this, the ovine RV continues to create new myocytes after birth, indicating that some myocytes of large mammals retain proliferative potential in the newborn period. The findings of prenatal myocyte loss and postnatal RV myocyte proliferation offer new mechanistic insight into regulation of myocyte number in the newborn heart and suggest that there may be undeveloped opportunities to manipulate myocyte endowment in the perinatal period.
Acknowledgments
The authors thank Kevin Hearn and Adrienne Wilburn for technical assistance, and Debra Anderson for editorial assistance. The Eunice Kennedy Shriver National Institute of Child Health and Human Development and the Office of the Director of the U.S. National Institutes of Health (NIH), under award numbers P01-HD-34430, K12-HD-043488 and R01-HD-071068, and the M. Lowell Edwards Endowment funded this research. The content is solely the responsibility of the authors and does not necessarily represent the official views of the NIH.
Glossary
- dPC
days postconception
- LV
left ventricle
- PARP-1
poly (ADP-ribose) polymerase 1
- RV
right ventricle
- X0
age at breakpoint of bisegmental regressions
REFERENCES
- 1.Soonpaa M. H., Kim K. K., Pajak L., Franklin M., Field L. J. (1996) Cardiomyocyte DNA synthesis and binucleation during murine development. Am. J. Physiol. 271, H2183–H2189 [DOI] [PubMed] [Google Scholar]
- 2.Walsh S., Pontén A., Fleischmann B. K., Jovinge S. (2010) Cardiomyocyte cell cycle control and growth estimation in vivo—an analysis based on cardiomyocyte nuclei. Cardiovasc. Res. 86, 365–373 [DOI] [PubMed] [Google Scholar]
- 3.Jonker S. S., Zhang L., Louey S., Giraud G. D., Thornburg K. L., Faber J. J. (2007) Myocyte enlargement, differentiation, and proliferation kinetics in the fetal sheep heart. J. Appl. Physiol. (1985) 102, 1130–1142 [DOI] [PubMed] [Google Scholar]
- 4.Burrell J. H., Boyn A. M., Kumarasamy V., Hsieh A., Head S. I., Lumbers E. R. (2003) Growth and maturation of cardiac myocytes in fetal sheep in the second half of gestation. Anat. Rec. A Discov. Mol. Cell. Evol. Biol. 274A, 952–961 [DOI] [PubMed] [Google Scholar]
- 5.Adler C. P., Friedburg H., Herget G. W., Neuburger M., Schwalb H. (1996) Variability of cardiomyocyte DNA content, ploidy level and nuclear number in mammalian hearts. Virchows Arch. 429, 159–164 [DOI] [PubMed] [Google Scholar]
- 6.Adler C. P., Costabel U. (1975) Cell number in human heart in atrophy, hypertrophy, and under the influence of cytostatics. Recent Adv. Stud. Cardiac Struct. Metab. 6, 343–355 [PubMed] [Google Scholar]
- 7.Austin A., Fagan D. G., Mayhew T. M. (1995) A stereological method for estimating the total number of ventricular myocyte nuclei in fetal and postnatal hearts. J. Anat. 187, 641–647 [PMC free article] [PubMed] [Google Scholar]
- 8.Bergmann O., Bhardwaj R. D., Bernard S., Zdunek S., Barnabé-Heider F., Walsh S., Zupicich J., Alkass K., Buchholz B. A., Druid H., Jovinge S., Frisén J. (2009) Evidence for cardiomyocyte renewal in humans. Science 324, 98–102 [DOI] [PMC free article] [PubMed] [Google Scholar]
- 9.Mollova M., Bersell K., Walsh S., Savla J., Das L. T., Park S. Y., Silberstein L. E., Dos Remedios C. G., Graham D., Colan S., Kühn B. (2013) Cardiomyocyte proliferation contributes to heart growth in young humans. Proc. Natl. Acad. Sci. USA 110, 1446–1451 [DOI] [PMC free article] [PubMed] [Google Scholar]
- 10.Brillantes A. M., Bezprozvannaya S., Marks A. R. (1994) Developmental and tissue-specific regulation of rabbit skeletal and cardiac muscle calcium channels involved in excitation-contraction coupling. Circ. Res. 75, 503–510 [DOI] [PubMed] [Google Scholar]
- 11.Hamaguchi S., Kawakami Y., Honda Y., Nemoto K., Sano A., Namekata I., Tanaka H. (2013) Developmental changes in excitation-contraction mechanisms of the mouse ventricular myocardium as revealed by functional and confocal imaging analyses. J. Pharmacol. Sci. 123, 167–175 [DOI] [PubMed] [Google Scholar]
- 12.Lopaschuk G. D., Jaswal J. S. (2010) Energy metabolic phenotype of the cardiomyocyte during development, differentiation, and postnatal maturation. J. Cardiovasc. Pharmacol. 56, 130–140 [DOI] [PubMed] [Google Scholar]
- 13.Comline R. S., Silver M. (1972) The composition of foetal and maternal blood during parturition in the ewe. J. Physiol. 222, 233–256 [DOI] [PMC free article] [PubMed] [Google Scholar]
- 14.Kliegman R. M., Miettinen E. L., Adam P. A. (1981) Fetal and neonatal responses to maternal canine starvation: circulating fuels and neonatal glucose production. Pediatr. Res. 15, 945–951 [DOI] [PubMed] [Google Scholar]
- 15.Walker D. W. (1994) Development of the autonomic nervous system, including adreno-chromaffin tissue. In Textbook of Fetal Physiology (Thorburn G. D., and Harding R., eds.), pp. 298–300, Oxford University Press, Oxford [Google Scholar]
- 16.Fisher D. A., Polk D. H. (1994) Development of the fetal thyroid system. In Textbook of Fetal Physiology (Thorburn G. D., and Harding R., eds.), pp. 359–368, Oxford University Press, Oxford [Google Scholar]
- 17.Dawes G. S., Johnston B. M., Walker D. W. (1980) Relationship of arterial pressure and heart rate in fetal, new-born and adult sheep. J. Physiol. 309, 405–417 [DOI] [PMC free article] [PubMed] [Google Scholar]
- 18.Teitel D. F., Iwamoto H. S., Rudolph A. M. (1987) Effects of birth-related events on central blood flow patterns. Pediatr. Res. 22, 557–566 [DOI] [PubMed] [Google Scholar]
- 19.Rudolph A. M. (1970) The changes in the circulation after birth. Their importance in congenital heart disease. Circulation 41, 343–359 [DOI] [PubMed] [Google Scholar]
- 20.Soonpaa M. H., Field L. J. (1998) Survey of studies examining mammalian cardiomyocyte DNA synthesis. Circ. Res. 83, 15–26 [DOI] [PubMed] [Google Scholar]
- 21.Lewandowski A. J., Bradlow W. M., Augustine D., Davis E. F., Francis J., Singhal A., Lucas A., Neubauer S., McCormick K., Leeson P. (2013) Right ventricular systolic dysfunction in young adults born preterm. Circulation 128, 713–720 [DOI] [PubMed] [Google Scholar]
- 22.Smolich J. J., Walker A. M., Campbell G. R., Adamson T. M. (1989) Left and right ventricular myocardial morphometry in fetal, neonatal, and adult sheep. Am. J. Physiol. 257, H1–H9 [DOI] [PubMed] [Google Scholar]
- 23.Schindelin J., Arganda-Carreras I., Frise E., Kaynig V., Longair M., Pietzsch T., Preibisch S., Rueden C., Saalfeld S., Schmid B., Tinevez J. Y., White D. J., Hartenstein V., Eliceiri K., Tomancak P., Cardona A. (2012) Fiji: an open-source platform for biological-image analysis. Nat. Methods 9, 676–682 [DOI] [PMC free article] [PubMed] [Google Scholar]
- 24.GraphPad Software Inc. How the F test works to compare models. Retrieved February 20, 2015, from http://www.graphpad.com/guides/prism/6/curve-fitting/index.htm?reg_howtheftestworks.htm
- 25.Kajstura J., Mansukhani M., Cheng W., Reiss K., Krajewski S., Reed J. C., Quaini F., Sonnenblick E. H., Anversa P. (1995) Programmed cell death and expression of the protooncogene bcl-2 in myocytes during postnatal maturation of the heart. Exp. Cell Res. 219, 110–121 [DOI] [PubMed] [Google Scholar]
- 26.Fernandez E., Siddiquee Z., Shohet R. V. (2001) Apoptosis and proliferation in the neonatal murine heart. Dev. Dyn. 221, 302–310 [DOI] [PubMed] [Google Scholar]
- 27.Choi J. H., Yoo K. H., Cheon H. W., Kim K. B., Hong Y. S., Lee J. W., Kim S. K., Kim C. H. (2002) Angiotensin converting enzyme inhibition decreases cell turnover in the neonatal rat heart. Pediatr. Res. 52, 325–332 [DOI] [PubMed] [Google Scholar]
- 28.James T. N. (1998) Normal and abnormal consequences of apoptosis in the human heart. Annu. Rev. Physiol. 60, 309–325 [DOI] [PubMed] [Google Scholar]
- 29.Bishopric N. H. (2002) Angiotensin signaling and apoptosis in the neonatal heart: necessary evils? Pediatr. Res. 52, 322–324 [DOI] [PubMed] [Google Scholar]
- 30.Chaitanya G. V., Steven A. J., Babu P. P. (2010) PARP-1 cleavage fragments: signatures of cell-death proteases in neurodegeneration. Cell Commun. Signal. 8, 31 [DOI] [PMC free article] [PubMed] [Google Scholar]
- 31.Karimi M., Wang L. X., Hammel J. M., Mascio C. E., Abdulhamid M., Barner E. W., Scholz T. D., Segar J. L., Li W. G., Niles S. D., Caldarone C. A. (2004) Neonatal vulnerability to ischemia and reperfusion: Cardioplegic arrest causes greater myocardial apoptosis in neonatal lambs than in mature lambs. J. Thorac. Cardiovasc. Surg. 127, 490–497 [DOI] [PubMed] [Google Scholar]
- 32.Bensley J. G., Stacy V. K., De Matteo R., Harding R., Black M. J. (2010) Cardiac remodelling as a result of pre-term birth: implications for future cardiovascular disease. Eur. Heart J. 31, 2058–2066 [DOI] [PubMed] [Google Scholar]
- 33.Naqvi N., Li M., Calvert J. W., Tejada T., Lambert J. P., Wu J., Kesteven S. H., Holman S. R., Matsuda T., Lovelock J. D., Howard W. W., Iismaa S. E., Chan A. Y., Crawford B. H., Wagner M. B., Martin D. I., Lefer D. J., Graham R. M., Husain A. (2014) A proliferative burst during preadolescence establishes the final cardiomyocyte number. Cell 157, 795–807 [DOI] [PMC free article] [PubMed] [Google Scholar]
- 34.Adler C. P., Friedburg H. (1986) Myocardial DNA content, ploidy level and cell number in geriatric hearts: post-mortem examinations of human myocardium in old age. J. Mol. Cell. Cardiol. 18, 39–53 [DOI] [PubMed] [Google Scholar]
- 35.Ya Brodsky V.., Sarkisov D. S., Arefyeva A. M., Panova N. W., Gvasava I. G. (1994) Polyploidy in cardiac myocytes of normal and hypertrophic human hearts; range of values. Virchows Arch. 424, 429–435 [DOI] [PubMed] [Google Scholar]
- 36.Srivastava D., Olson E. N. (2000) A genetic blueprint for cardiac development. Nature 407, 221–226 [DOI] [PubMed] [Google Scholar]
- 37.Rudolph A. M. (2001) Congenital diseases of the heart: clinical-physiological considerations, pp. 3–38, Futura Pub. Co., Armonk, NY [Google Scholar]
- 38.Jonker S. S., Faber J. J., Anderson D. F., Thornburg K. L., Louey S., Giraud G. D. (2007) Sequential growth of fetal sheep cardiac myocytes in response to simultaneous arterial and venous hypertension. Am. J. Physiol. Regul. Integr. Comp. Physiol. 292, R913–R919 [DOI] [PubMed] [Google Scholar]
- 39.Carabello B. A. (2002) Concentric versus eccentric remodeling. J. Card. Fail. 8(6, Suppl):S258–S263 [DOI] [PubMed] [Google Scholar]
- 40.Pinson C. W., Morton M. J., Thornburg K. L. (1987) An anatomic basis for fetal right ventricular dominance and arterial pressure sensitivity. J. Dev. Physiol. 9, 253–269 [PubMed] [Google Scholar]