

Abstract
Preclinical data suggest multiple roles for the insulin like growth factor receptor 1 (IGF-1R) in neuroendocrine tumors (NET) including mediating resistance to mTOR inhibitors. Everolimus, an oral mTOR inhibitor and octreotide LAR are approved for subgroups of well differentiated NET. The primary objective was to establish the safety and recommended phase II dose (RP2D) of cixutumumab, a monoclonal antibody against IGF-1R with everolimus and octreotide LAR. Patients with well differentiated NET were treated with everolimus 10 mg po daily, octreotide LAR 20 mg IM every 21 days and escalating doses of cixutumumab. An expansion cohort was enrolled at RP2D. Correlative studies included evaluation of mTOR pathway inhibition in paired tumor biopsies and effects of this combination on metabolism per indirect calorimetry. 19 patients with progressive disease, including 9 to the expansion portion were enrolled. 2 patients had dose limiting toxicities of grade 3 mucositis at cixutumumab 15 mg/kg. Long term tolerance at RP2D was problematic, the most common ≥ grade 3 adverse event (AE) being fatigue. One patient with metastatic insulinoma had a confirmed partial response while seventeen had stable disease. Median progression free survival was 43.6 weeks and median overall survival was 25.5 months.
Conclusions
The RP2D of this combination per predefined study protocol cixutumumab iv 10 mg/kg, octreotide LAR 20 mg IM every 21 days plus everolimus 10 mg po daily is associated with non-DLT toxicities limiting long term tolerance. Although a signal of activity was noted in this study, this will need to be reconciled with limited tolerance of the combination and data from larger studies of anti-IGF-1R monoclonal antibodies in NET that have been disappointing.
Introduction
The incidence of neuroendocrine tumors (NETs) has increased from 1.09 cases per 100,000 in 1973 to 5.25 per 100,000 in 2004 (Yao, et al. 2008). While often slow growing, these cancers are nonetheless incurable and lethal when advanced. However, treatment options continue to be limited, especially for carcinoid tumors. Mutations in the mammalian target of rapamycin (mTOR) pathway have been reported in 14% of pNETs and such abnormalities have also been associated with more aggressive tumors (Jiao, et al. 2011; Meric-Bernstam and Gonzalez-Angulo 2009). The phase III randomized, placebo-controlled RADIANT-3 study showed significant improvement in progression free survival (PFS) with everolimus, an oral inhibitor of mTOR in patients with pancreatic NETs (Yao, et al. 2011). Another placebo-controlled phase III study, RADIANT-2 randomized patients with advanced neuroendocrine tumors associated with carcinoid syndrome to octreotide long-acting repeatable (LAR) in combination with placebo or everolimus and showed improved PFS in the everolimus arm although this did not meet the predefined threshold for significance (Pavel, et al. 2011). IGF-1R receptors and ligands are known to be expressed at higher concentrations in NETs than in normal tissue (Wulbrand, et al. 2000). Studies in carcinoid cell lines show that IGF1 is a major regulator of neuroendocrine secretion and growth (von Wichert, et al. 2000). Other in vitro studies have shown that blockade of IGF1R results in inhibition of NET cells growth and induction of apoptosis (Hopfner, et al. 2006). Mouse models of pancreatic neuroendocrine tumors suggest a role for the insulin growth factor-2, IGF2 in tumorigenesis (Christofori, et al. 1995). Finally, other preclinical studies have suggested that IGF-1 protects cancer cells from rapamycin-induced cell death and that inhibition of IGF-1R prevents rapamycin-induced AKT activation and sensitizes tumor cells to mTOR inhibitors thus providing a rationale for combined blockade of these pathways (O'Reilly, et al. 2006; Thimmaiah, et al. 2003).
The goals of this phase I study were to establish the safety and RP2D of everolimus and octreotide LAR in combination with escalating doses of the anti-IGF1R monoclonal antibody, and to evaluate for preliminary evidence of activity in patients with advanced, low to intermediate grade NETs.
Patients and Methods
Eligibility criteria
Eligible patients had progressive, advanced or metastatic low or intermediate grade neuroendocrine cancers (carcinoid of any site or pNET) refractory to or without standard therapy options, evaluable or measurable disease by RECIST (Response Evaluation Criteria in Solid Tumors) (Therasse, et al. 2000) and Eastern Cooperative Oncology Group (ECOG) performance status of 0-1. Patients may have received prior therapy (except mTOR inhibitors or agents targeting IGF1R) with no limitation on the number of prior regimens. Patients also had to be age 18 years or older with adequate hematopoietic, hepatic and kidney function; fasting serum glucose ≤ 132 mg/dl and fasting serum cholesterol ≤ 300 mg/dl and fasting triglycerides ≤ 375 mg / dl. Exclusion criteria included: women who were pregnant or nursing; treatment with radiotherapy or chemotherapy within 4 weeks; major surgery within 3 weeks; known central nervous system metastasis requiring anticonvulsants or steroids; patients on therapeutic anticoagulation not on stable dosages; uncontrolled severe cardiac disease or diabetes mellitus; any medical condition that would impair administration of an oral medication; prior mTOR and / or IGF1R therapies and uncontrolled serious medical or psychiatric illness.
The protocol was approved by the institutional review board at M.D Anderson Cancer Center, and written informed consent was obtained for all patients prior to performing study-related procedures in accordance with federal and institutional guidelines.
Study Design
This was a single institution, single arm, inter-patient dose escalation study with a dose expansion cohort of 9 patients enrolled at the recommended dose. The total duration of treatment was 12 months.
Drug administration and dose-escalation procedures
Cixutumumab was supplied by the Division of Cancer Treatment and Diagnosis of the National Cancer Institute (Bethesda, MD) as single-use vials and weight based dose was administered iv over 90 minutes every 21 days. Everolimus was supplied by Novartis Pharmaceuticals (Basel, Switzerland) and was orally administered to fasting patients on a once daily continuous dosing schedule. Keeping the doses of everolimus (10 mg po daily) and octreotide LAR (20mg IM every 21 days) constant, cixutumumab was evaluated at escalating doses of 10 mg /kg and 15 mg/kg every 21 days of a 21 day cycle. Octreotide LAR was administered every 21 days rather than the standard practice of every 28 days to fit with the study schedule for patients' convenience.
For the dose-escalation portion of the study, patients were enrolled sequentially into escalating dosing cohorts of 6 patients each rather than the traditional 3 +3 design as at the beginning of the study, it was unclear if the maximum tolerated dose (MTD) would be reached. Therefore, larger cohorts were chosen to better characterize pharmacodynamics, PD and the RP2D. Intra-patient dose escalation was not permitted and once each sequential cohort was enrolled, accrual was held until all patients on that cohort had completed 1 cycle of therapy. Dose-limiting toxicity (DLT) was defined as any ≥ grade 4 hematological toxicity, grade 3 neutropenia or thrombocytopenia that does not resolve to either grade 0 or 1 following dose interruption for > 7 days, grade ≥ 3 non-hematologic toxicity (except grade ≥ 3 hyperglycemia, hyperlipidemia that could be controlled with appropriate medical management within 3 weeks; grade ≥3 nausea vomiting that could be controlled with medication within 7 days), or any toxicity leading to > 14 days of treatment delay occurring during the first cycle with definite, possible or probable attribution to cixutumumab and/or everolimus. If one or no patients in any cohort of six patients developed DLT, dose escalation was permitted. If two or more patients in any expanded cohort developed DLT, dose escalation was stopped and the cohort immediately below was deemed to be RP2D.
For patients with ≥ grade 3 treatment related toxicities, dosing of the drug was held until resolution to ≤ 1 and restarted at one dose level reduction for hematological toxicities and per physician's discretion for other transient grade 4 toxicities. For IMC-A12, doses were reduced to the next lower level in increments of 5 mg/kg iv q 21 days up to 5 mg/kg iv q 21 days. For everolimus, dose was reduced from 10 mg po daily to 5 mg po daily; 5 mg po every other day successively. If further reductions of either drug were required or if patients required a dose delay of > 21 days, therapy with that drug was discontinued permanently.
Clinical evaluation and safety assessment
Prior to study entry, patients underwent clinical history and physical examination, performance status assessment, vital signs, complete blood count (CBC), chemistries, coagulation parameters, urinalysis, serum pregnancy test, tumor markers, hemoglobin A1C, fasting total cholesterol and triglycerides, EKG, indirect calorimetry and baseline tumor measurements. While on study, patients underwent evaluation including history and physical examination, vital signs, CBC, lipid panel and chemistries every cycle. Urinalysis was repeated each cycle. Given prior reports of hearing loss in patients treated with IGF-1R monoclonal antibodies, audiometry testing with comprehensive audiometry and tympanometry was performed at baseline and at end of study. Adverse events were classified/graded weekly according to the Common Terminology Criteria of Adverse Events, version 4.0. Response was assessed every 3 cycles and evaluated by RECIST version 1 as in other major NET trials.(Therasse et al. 2000) All patients who received at least one treatment were considered evaluable for toxicity and those who had received at least one complete cycle of therapy and had their disease re-evaluated were considered evaluable for response.
Pharmacodynamic Analysis
Paired pre- (within 4 weeks of initiating therapy) and post-treatment biopsies (24 hours after day 1 administration of cixutumumab and everolimus during cycle 2) were obtained and were frozen immediately for reverse phase protein array (RPPA) or formalin-fixed paraffin embedded for immunohistochemistry (IHC).
Immunohistochemistry
IHC was performed on pre-treatment and post-treatment core biopsies with the following antibodies as previously reported: pAKT S473 (Cell Signaling), pS6 S235/236 (Cell Signaling), pS6 S240/244 (Cell Signaling, Danvers, MA), p4E-BP1 T70 (Cell Signaling, Danvers, MA)(Akcakanat, et al. 2008; Meric-Bernstam, et al. 2014). Ki-67 immunostaining was performed in the M.D. Anderson IHC Core laboratory with the following antibodies: Ki-67 (Dako Carpinteria, CA). Positive and negative controls were included for all assays. Immunoreactivity score (IRS) was calculated as % staining multiplied by intensity.
Reverse Phase Protein Array
Protein lysate was extracted and RPPA was performed in the MD Anderson Cancer Center Functional Proteomics Core Facility as described previously (Meric-Bernstam, et al. 2012). Samples were re-suspended in 3 volumes of RPPA lysis buffer (Hennessy, et al. 2010) already mixed with 1 volume of 4× SDS sample buffer. Samples were sonicated using a microtip probe (Fisher Scientific, Waltham, MA) and protein concentrations were determined using BCA kit (Pierce, Rockford, IL). 2-mercaptoethanol was added (10% (v/v) of 4× SDS sample buffer) and final protein concentration was adjusted to 3 μg/μl. Samples were probed with antibodies validated for RPPA that are enriched for components of PI3K/AKT/mTOR pathway. A total of 161 unique proteins (including phosphoproteins) were evaluated. The list of antibodies is included in Supplementary Table 1. Analyses of the log transformed protein levels were performed.
Indirect Calorimetry
Given the known effects of IGF and mTOR signaling pathways on metabolism, indirect calorimetry was obtained at baseline and on cycle 2 day 1 using a handheld indirect calorimeter in a rested and fasting state.
Statistical Methods
Descriptive statistics were used for baseline characteristics, safety assessments and exploratory assessments, including progression free survival, overall survival and tumor response.
The RPPA spot signal intensity data from MicroVigene was processed using the R package SuperCurve (version 1.4.3), available at “http://bioinformatics.mdanderson.org/OOMPA” as previously described (Meric-Bernstam et al. 2012). The modified Z-Scores of 5 important mTOR pathway biomarkers were calculated and used to compute the composite mTOR pathway activity score. Composite mTOR pathway activity score was defined as the sum of the modified Z-Scores of phospho-protein of 4E-BP1, S6K, and S6 (i.e. Score= pS6 240/244 + pS6 S235/236 + pS6K T389 + p4E-BP1 S65 + p4E-BP1 T37/46). The modified Z-score proposed by Iglewicz and Hoaglin was calculated based on the median of expressions and absolute deviation about the median (Iglewicz and Hoaglin 1993). Linear mixed model was used to compare the mTOR activity scores and individual protein expression between pre- and post-treatment. Regulation of mTOR pathway biomarkers and mTOR pathway activity was performed as planned analysis (p ≤ 0.05) and functional proteomics profile was performed as exploratory analysis. To account for multiple testing, we estimated the false discovery rate, FDR of the model using the Benjamini-Hochberg method with the false discovery rate, FDR-adjusted p-value, q< 0.3 being significant.
Spearman's rank correlation (rho) was used to assess the associations between protein expression at pre-treatment and on-treatment, or the change and the best response in % tumor size change.
Univariate Cox proportional hazards model was fitted to assess the association between the Z-Score of biomarker's expression at pre-treatment, on-treatment or the pharmacodynamics Z-Score change (zPDϪ=On-treatment Z-score – Pre-treatment Z-score) and progression free survival (PFS). Statistical significance was measured using the Wald test. Again, we adjusted for multiple testing as described above.
The exact Wilcoxon signed rank test was applied to compare the immunostaining of the pre-treatment and on-treatment biopsies. For markers that had a range of intensity, highest intensity was used for analysis.
Changes in indirect calorimetry from baseline to cycle 2 were tested using Wilcoxon signed rank test.
Results
Patient Demographics and Treatment
Nineteen patients, 10 in the dose-escalation portion and 9 in the MTD expansion portion were enrolled from November 2010 to May 2012 (Table 1). None of the patients had multiple endocrine neoplasia or other hereditary syndromes associated with NETs. All patients had progression of their disease prior to enrollment on trial. A total of 207 cycles were administered. The median number of cycles per patient was 10 (range, 3-19). Reasons for study discontinuation were disease progression in 8 patients, completion of study in 4, toxicities in 4 and withdrawal of consent in 2 patients. One patient was taken off study per treating physician's discretion due to complications from carcinoid heart disease.
Table 1. Baseline demographics and patient characteristics.
| N=19 | ||
|---|---|---|
|
| ||
| Characteristic | No. | % |
|
| ||
| Sex | ||
| Male | 10 | 53 |
| Female | 9 | 47 |
|
| ||
| Age, years | ||
| Median | 66 | |
| Range | 45-79 | |
|
| ||
| ECOG performance status | ||
| 0 | 15 | 34 |
| 1 | 4 | 66 |
|
| ||
| Previous lines of systemic therapies | ||
| Median | 1 | |
| Range | 0-3 | |
|
| ||
| Previous therapy | ||
| Chemotherapy | 9 | 47 |
| Radiotherapy | 4 | 21 |
| Somatostatin Analogue | 13 | 68 |
| Radioembolization | 2 | 11 |
| VEGF-targeting antibody | 3 | 16 |
| Interferon Therapy | 1 | 5 |
| Surgery | 8 | 42 |
|
| ||
| NET origin | ||
| Pancreatic | 4 | |
| Small Bowel | 6 | |
| Lung | 4 | |
| Kidney | 1 | |
| Other / Unknown | 4 | |
|
| ||
| Functional Status | ||
| Functional | 6 | |
| Non-functional | 13 | |
|
| ||
| Number of metastatic Sites | ||
| 1 | 5 | |
| 2 | 8 | |
| 2+ | 6 | |
|
| ||
| Time from diagnosis | ||
| Median | 18 | |
| Mean | 38 | |
|
| ||
| Serum Chromogranin levels | ||
| 2× – 4× ULN | 3 | |
| >4× ULN | 10 | |
Abbreviations: ECOG, Eastern Cooperative Oncology Group; VEGF, vascular endothelial growth factor;
Dose escalation and determination of maximum tolerated dose
In the cixutumumab 10 mg/kg cohort, 6 patients were treated without any DLTs. However, at the next cohort of cixutumumab 15 mg/kg, two of four patients experienced DLTs with both developing grade 3 mucositis. Further dose escalation was hence stopped and the RP2D was deemed to be cixutumumab 10 mg/m2, everolimus 10 mg po daily and octreotide LAR 20mg IM every 21 days i.e. the previous dose level. An additional nine patients were enrolled to further evaluate tolerability and preliminary anti-tumor activity and no further DLTs were noted.
Safety
All nineteen patients were evaluable for toxicities with all having at least one toxicity of any grade during the study. The most frequently observed adverse events seen in all courses were fatigue, hyperlipidemia, and weight loss (all with incidence rates of 74%); other common adverse events were altered taste (68%), hyperglycemia and mucositis (both 63%). 11 (57%) patients had at least one ≥ grade 3 toxicity. The most common grade 3 adverse events was fatigue (21%); other common grade 3 adverse events included mucositis, elevated liver tests and electrolyte abnormalities (all 11%). There were no grade 5 AEs, and one patient had grade 4 hyperglycemia.
Only one patient completed entire study per protocol at RP2D. The mean number of cycles delivered at the full RP2D in the 15 patients treated at this level was 4 (median 3). Four patients were taken off study due to toxicities including persistent grade 3 neutropenia (1), fatigue (3), and fatigue and weight loss (1). Two patients withdrew consent citing toxicities including fatigue, nausea and rash. 15 patients required dose reductions and / or interruptions due to toxicities. Everolimus was dose reduced in all 15 patients – most commonly due to thrombocytopenia (5 patients), fatigue (4 patients) and mucositis (3 patients). Of these 15 patients, 8 patients required dose reduction of everolimus during or prior to cycle 2. Other reasons included elevated creatinine, hyperglycemia and altered mental status in one patient each. One patient who elected to stop everolimus while on study stayed on cixutumumab and octreotide LAR until end of protocol. Three patients had dose reduction in cixutumumab due to thrombocytopenia, altered mental status and hyperglycemia (1 patient each). Cixutumumab was discontinued in one patient due to grade 3 elevation in alkaline phosphatase. Octreotide LAR was not dose reduced in any patients but was discontinued in one patient due to bradycardia.
One patient developed worsening carcinoid heart disease thought to be unlikely to be related to study drugs and was taken off study per physician discretion. He underwent valve replacement and died several weeks later from post-operative complications.
Fifteen patients had baseline and end of study audiometry assessments of which 4 patients had grade 1 change in hearing sensitivity unilaterally and one patient had bilateral changes (grade 1 and grade 2) that were not clinically significant and were identified on audiograms.
Pharmacodynamic Analysis
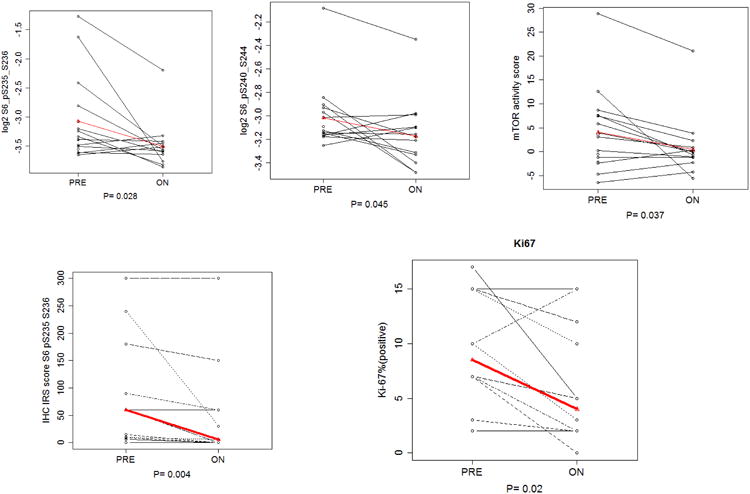
All 19 patients underwent pre-treatment biopsies, and 15 had post-treatment biopsies. All pre-treatment and on-treatment H&Es were reviewed, and patients without tumor on core biopsy samples had their samples excluded from IHC and RPPA analysis. The overall difference between pre- and post-treatment biopsies demonstrated statistically significant decline with treatment for S6 pS240/244 (p=0.045) and S6 pS235/236 (p=0.028), two proteins frequently assessed as downstream markers of mTOR signaling (Figure 1 A and B). The mTOR activation score significantly decreased with treatment (adjusted mean pre-treatment 4.025 vs on-treatment -0.41, p=0.037) (Figure 1 C). Thus the RPPA analysis confirms mTOR pathway inhibition by the treatment.
Figure 1. Pharmacodynamic changes in mTOR pathway activity, Ki-67 with treatment.
We next assessed whether baseline proteomics profile or pharmacodynamic changes were associated with best tumor response represented as % change in tumor size. Pre-treatment expression of ER alpha pS118 was strongly inversely correlated with % tumor size change (Supplementary Table 2). STAT3 pY705, SMAD3, RPTOR, PRAS40, pT246 and ANXA7 (annexin VII) were moderately inversely correlated with % tumor size change and four biomarkers (YAP pS127, VEGFR2, AKT pT308, and MEK1 pS217/221) were moderately positively correlated with % tumor size change. After adjusting for multiple testing, ER alpha pS118, smad3, and STAT3 pY705, retained significance.
The treatment associated-decrease of MEK1 pS217/221 was strongly inversely correlated with % tumor size change while ANXA7 and ER alpha pS118 were strongly positively correlated with % tumor size change. The pharmacodynamic changes of 15 additional proteins were moderately negatively correlated, and those of 23 proteins were moderately positively correlated with % tumor size change. After adjusting for multiple tumor testing, 25 positively, and 14 negatively correlated markers remained significant at FDR<0.3 (Supplementary Table 3).
Higher expression of AKT pT308 z-score on RPPA at pre-treatment was associated with worse PFS (HR=2.379, p=0.011). The increase of 4E-BP1 pT37/T46 expression on-treatment was marginally significantly associated with worse PFS (HR=1.995, p=0.081, Table 1, 2). Greater increase in AKT pT308 or p70S6K pT389 expression between pre-treatment and on-treatment biopsies were significantly or marginally significantly associated with better PFS (AKT pT308: HR=0.107, p=0.006; p70S6K pT389: HR=0.554, p=0.084). Based on Supplemental Table 4, increased pharmacodynamic change in fifteen proteins which have hazard ratio (HR) <1 was associated with decreased risk of PFS. Increased pharmacodynamics z-score change in 21 proteins which had hazard ratio (HR)>1 were associated with increased risk of PFS. All of these thirty-six biomarkers were significant at FDR<0.3.
Table 2. All hematologic and non-hematologic adverse events: worst grade per patient in all cycles in at least 25% of all patients and / or ≥ grade 3 (n = 19).
| Adverse Event | Any Grade | Grade 3 | Grade 4 | |||
|---|---|---|---|---|---|---|
|
| ||||||
| No. of Patients | % | No. of Patients | % | No. of Patients | % | |
|
| ||||||
| Total | 19 | 100 | 10 | 53 | 1 | 5 |
| Fatigue | 14 | 74 | 4 | 21 | 0 | 0 |
| Hyperlipidemia | 14 | 74 | 0 | 0 | 0 | 0 |
| WeightLoss | 14 | 74 | 0 | 0 | 0 | 0 |
| Dysguesia | 13 | 68 | 0 | 0 | 0 | 0 |
| Hyperglycemia | 12 | 63 | 1 | 5 | 1 | 5 |
| Mucositis | 12 | 63 | 2 | 11 | 0 | 0 |
| Diarrhea | 11 | 58 | 0 | 0 | 0 | 0 |
| Epistaxis | 10 | 53 | 0 | 0 | 0 | 0 |
| Thrombocytopenia | 10 | 53 | 0 | 0 | 0 | 0 |
| Anorexia | 9 | 47 | 1 | 5 | 0 | 0 |
| Rash | 8 | 42 | 0 | 0 | 0 | 0 |
| Pain | 6 | 32 | 0 | 0 | 0 | 0 |
| Nail ridging | 6 | 32 | 0 | 0 | 0 | 0 |
| Neutropenia | 5 | 26 | 1 | 5 | 0 | 0 |
| Elevated AST, ALT or AlkPhos | 5 | 26 | 2 | 11 | 0 | 0 |
| Infection | 3 | 16 | 1 | 5 | 0 | 0 |
| Electrolyte abnormalities | 3 | 16 | 2 | 11 | 0 | 0 |
| Anemia | 2 | 11 | 1 | 5 | 0 | 0 |
| Injury | 1 | 5 | 1 | 5 | 0 | 0 |
| Retinal Detachment | 1 | 5 | 1 | 5 | 0 | 0 |
| Thromboembolism | 1 | 5 | 1 | 5 | 0 | 0 |
| Dehydration | 1 | 5 | 1 | 5 | 0 | 0 |
Graded per National Cancer Institute Common Terminology Criteria for Adverse Events, version 3. Abbreviations: ALT, alanine amino-transferase; AST, aspartate amino-transferase
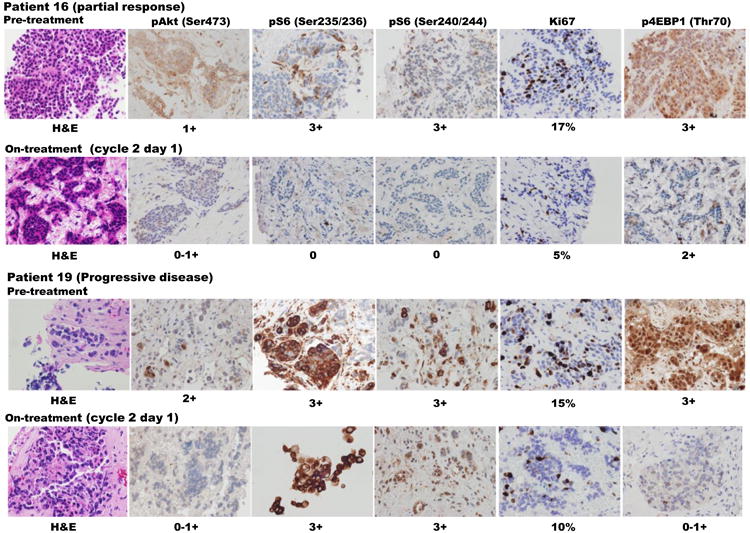
IHC data was performed for five biomarkers (pAKT, Ki67, p4E-BP1, pS6 235/236 and pS6 240/244). Thirteen patients have matched pre- and on-treatment IHC values evaluable for pAKT, pS6 235/236 and pS6 240/244, meanwhile, twelve patients have matched pre- and on-treatment IHC values of Ki67 and p4E-BP1 T70. Treatment was associated with a statistically significant decrease in pS6 S235/236 IRS score (p= 0.0063) and Ki-67 (p=0.02). The pS6 S235/236, pS6 S240/244 immunostaining and Ki-67 showed more robust inhibition in the patient who had a partial response compared with another patient who experienced progressive disease (Figure 2).
Figure 2. IHC changes in mTOR pathway components, Ki-67 with treatment in responder vs non-responder.
Metabolic Analysis
14 patients had paired indirect calorimetry results at baseline and cycle 2 day 1. Paired results were not obtained in the rest because they were either not fasting at the time of testing or were not on treatment and differences in mean values were calculated by paired T test. The mean basal oxygen consumption (VO2) was 216.7 / minute and mean basal resting metabolic rate (RMR) was 1517.9 kilocalories / day. The corresponding values at cycle 2 day 1 were significantly reduced to 190.2 ml / minute for VO2 (p = 0.001) and 1319.2 kilocalories / day for RMR (p < 0.001) (Figure 3).
Figure 3. Changes in V02 with treatment as measured by indirect calorimetry.

Antitumor Activity
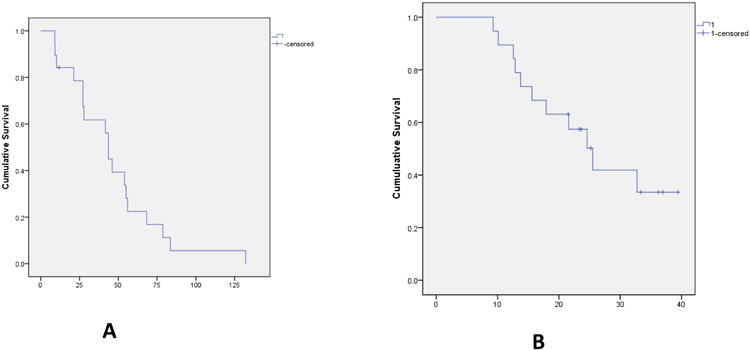
All nineteen patients were eligible for response evaluation. There were no complete responses. One patient with metastatic insulinoma secreting proinsulin had a confirmed partial response. Prior to initiating therapy on this trial, the patient's clinical course was marked by recurrent episodes of hypoglycemia as detected by a continuous glucose monitoring system and also significant weight gain as a result of hormonal disturbances. However, within two cycles of therapy, he no longer had hypoglycemia and in fact required therapy with metformin for hyperglycemia. He was also able to lose significant amount of weight suggestive of normalization of his anabolic hormones although his hyperglycemia could also have been an adverse effect of one or more of the study drugs. Seventeen patients had stable disease as best response with reduction in RECIST tumor measurements ranging from 1 – 22%. 4 patients were on study for entire duration of 12 months. Median progression free survival (PFS) was 43.6 weeks (range 9 – 132 weeks; 95% CI 39.8 – 47.3 weeks). Median overall survival was 25.5 months (95% CI 19.2 – 31.7 months). Median number of cycles of treatment was 10 (range 3 – 19). There were 4 patients with pNETs on the trial including the patient with insulinoma described above. The other three patients with pNETs had stable disease ranging from 20 – 44 weeks (Figure 4).
Figure 4. Progression Free Survival (A) in weeks and Overall Survival (B) in months.
Discussion
The primary objective of this phase I study was to establish the RP2D of the combination of cixutumumab, everolimus and octreotide LAR based on observation of DLTs during the 1st cycle and was deemed to be cixutumumab 10 mg/kg, everolimus 10 mg po daily and octreotide LAR 20mg IM every 21 days. The maximum dose of octreotide LAR was limited to 20 mg IM as mandated by protocol. Although no further DLTs were noted, only one patient finished the study per protocol with the rest experiencing significant toxicities, most commonly fatigue, mucositis and / or myelosuppression. All 15 of these patients required dose reduction of everolimus and 3 patients required dose reduction of cixutumumab. The most common AEs noted with everolimus include stomatitis, rash, diarrhea and fatigue and the most common ≥ grade 3 AEs are stomatitis, myelosuppression and hyperglycemia (Yao et al. 2011). In the phase II study of ganitumab, a human monoclonal antibody against IGF-1R in NET, the most common AEs included fatigue, hyperglycemia and nausea while the most common ≥ grade 3 AEs were myelosuppression and hyperglycemia (Strosberg, et al. 2013). These overlapping toxicity profiles perhaps explain the poor long-term tolerance at RP2D. This underscores the need to look beyond MTD to establish long term tolerability of novel therapies in patients with diseases with an indolent course such as NET.
As a preplanned analysis, changes in mTOR pathway biomarkers and mTOR pathway activity at cycle 2 day 1 compared to baseline were evaluated. As evaluated by RPPA, the mTOR activity score significantly decreased with treatment as did levels of downstream markers of the mTOR pathway suggesting inhibition this pathway with treatment. These results were also validated by IHC as mTOR pathway downstream marker pS6 revealed a statistically significant decrease in IRS score. Decrease in Ki-67 suggests that this inhibition of the mTOR pathway was associated with decreased tumor proliferation between initiation of therapy and time of biopsy at the beginning of cycle 2. However, this is in contrast to the fact that only one patient had a partial response. Interestingly, this was the only patient who did not require dose reductions and completed study per protocol. This raises the possibility of lack of adequate target inhibition due to dose reductions following this time point. Exploratory analyses aimed to identify predictive baseline proteomic markers or pharmacodynamic changes. These are presented in Supplementary Data. After adjusting for multiple testing, the marker that most strongly correlated with tumor shrinkage was baseline estrogen receptor, ER alpha expression (Supplementary Table 2). Recent work by our group also suggests that estrogen induced genes and progesterone receptors are up regulated in indolent neuroendocrine tumors compared to more aggressive ones (Estrella et al, in press). These findings warrant further evaluation of estrogen and progesterone receptors / pathways as prognostic biomarkers in neuroendocrine tumors.
Activated AKT is a key effector of the IGF and PI3K pathways via phosphorylation of a vast number of proteins affecting multiple cellular responses including metabolism. The net effect of these changes is increased glucose utilization and metabolism (Alayev and Holz 2013). As an exploratory objective, we measured changes in indirect calorimetry from baseline to cycle 2 day 1 in 14 patients to evaluate the effect of inhibition of these pathways. We found a statistically significant decrease in basal oxygen consumption and metabolic rate. Although these findings are preliminary, the observed reduction in oxygen consumption is very intriguing. An ongoing trial (NCT01561404) is evaluating the positive impact of reduced oxygen consumption on physical exercise in patients being treated with mTOR inhibitors after renal transplant and may further validate our findings.
Evaluation of anti-tumor activity as measured by response rate and PFS was a secondary objective of the study. A major limitation of evaluation of novel agents in NETs is that they often cause disease stabilization without true responses per RECIST criteria. Indeed, in the phase III trials leading to approval of sunitinib and everolimus in pNETs, while radiographic responses were modest, there was a significant improvement in PFS compared to the placebo arms (Raymond, et al. 2011; Yao et al. 2011) raising the question whether other modalities for measuring response such as modified RECIST may be more suitable for NET. In the current study, given the small size, definite conclusions regarding the activity of the combination are difficult to make. However, only one confirmed partial response per RECIST was noted. As discussed above, this could be related to lack of adequate dosing of the combination. In this context, recent attempts at evaluating IGF-1R monoclonal antibodies in NETs that have yielded disappointing results should also be noted (Strosberg et al. 2013),(Reidy-Lagunes, et al. 2012).
There are several potential explanations for this discrepancy between promising preclinical results and lack of efficacy in clinical trials: a) Lack of biomarkers: It is conceivable that only a subset of NETs may respond to these agents and further work is required for identification of these putative subsets (Gualberto, et al. 2010; Yee 2012). b) Alternative signaling pathways: Treatment of RIP-Tag2 mice with cixutumumab failed to have a significant impact on pNET growth or invasiveness despite reduction of IGF1R levels – this was demonstrated to be due to signaling through the insulin receptor (Ulanet, et al. 2010). Resistance to IGF-1R blockade may be also be regulated by targets such as EGFR, Her2 or overexpression of IGFR pathway components (Garofalo, et al. 2011; Haluska, et al. 2008). c) Heterogeneity of patient populations: Accumulating evidence points to the differences in genetic and clinical profiles of NETs from different sites. Therefore, future studies should be designed to accrue homogenous subsets of NET patients through international collaboration as needed to generate more meaningful conclusions. d) Finally, these discrepancies between preclinical and clinical results may reinforce the inherent limitations of reproducibility and translation of preclinical data (Begley and Ellis 2012), especially in a tumor type such as NET that lacks robust preclinical models.
In summary, this phase I trial established the recommended phase II dose of the regimen to be cixutumumab 10 mg/kg, everolimus 10 mg po daily and octreotide LAR 20mg IM every 21 days. However, long term tolerability without dose reductions may be difficult. A clear signal of benefit for anti-IGF-1R therapy was not observed keeping in line with prior clinical trials in this patient population. Further work is required to elucidate potential predictive biomarkers of and mechanism of resistance of this combination in NETs prior to launching a phase II trial.
Supplementary Material
Acknowledgments
Supported by: 5U01CA062461 (J.C.Y.), the Sheikh Khalifa Al Nahyan Ben Zayed Institute for Personalized Cancer Therapy, NCATS grant UL1 TR000371 (Center for Clinical and Translational Sciences), the MD Anderson Cancer Center Support grant (P30 CA016672) and Novartis.
Footnotes
Note: Presented in part at the 2014 Gastrointestinal Cancers Symposium, San Francisco
Conflicts of Interest: JY: Paid consultant, Novartis; Research funding, Novartis, FMB: Paid consultant, Novartis
NCT trial identifier: NCT01204476
References
- Accili D, Kido Y, Nakae J, Lauro D, Park BC. Genetics of type 2 diabetes: insight from targeted mouse mutants. Curr Mol Med. 2001;1:9–23. doi: 10.2174/1566524013364040. [DOI] [PubMed] [Google Scholar]
- Akcakanat A, Sahin A, Shaye AN, Velasco MA, Meric-Bernstam F. Comparison of Akt/mTOR signaling in primary breast tumors and matched distant metastases. Cancer. 2008;112:2352–2358. doi: 10.1002/cncr.23456. [DOI] [PMC free article] [PubMed] [Google Scholar]
- Alayev A, Holz MK. mTOR signaling for biological control and cancer. J Cell Physiol. 2013;228:1658–1664. doi: 10.1002/jcp.24351. [DOI] [PMC free article] [PubMed] [Google Scholar]
- Begley CG, Ellis LM. Drug development: Raise standards for preclinical cancer research. Nature. 2012;483:531–533. doi: 10.1038/483531a. [DOI] [PubMed] [Google Scholar]
- Christofori G, Naik P, Hanahan D. Deregulation of both imprinted and expressed alleles of the insulin-like growth factor 2 gene during beta-cell tumorigenesis. Nat Genet. 1995;10:196–201. doi: 10.1038/ng0695-196. [DOI] [PubMed] [Google Scholar]
- Cohen P, Frame S. The renaissance of GSK3. Nat Rev Mol Cell Biol. 2001;2:769–776. doi: 10.1038/35096075. [DOI] [PubMed] [Google Scholar]
- Garofalo C, Manara MC, Nicoletti G, Marino MT, Lollini PL, Astolfi A, Pandini G, Lopez-Guerrero JA, Schaefer KL, Belfiore A, et al. Efficacy of and resistance to anti-IGF-1R therapies in Ewing's sarcoma is dependent on insulin receptor signaling. Oncogene. 2011;30:2730–2740. doi: 10.1038/onc.2010.640. [DOI] [PubMed] [Google Scholar]
- Gualberto A, Dolled-Filhart M, Gustavson M, Christiansen J, Wang YF, Hixon ML, Reynolds J, McDonald S, Ang A, Rimm DL, et al. Molecular analysis of non-small cell lung cancer identifies subsets with different sensitivity to insulin-like growth factor I receptor inhibition. Clin Cancer Res. 2010;16:4654–4665. doi: 10.1158/1078-0432.CCR-10-0089. [DOI] [PMC free article] [PubMed] [Google Scholar] [Retracted]
- Haluska P, Carboni JM, TenEyck C, Attar RM, Hou X, Yu C, Sagar M, Wong TW, Gottardis MM, Erlichman C. HER receptor signaling confers resistance to the insulin-like growth factor-I receptor inhibitor, BMS-536924. Mol Cancer Ther. 2008;7:2589–2598. doi: 10.1158/1535-7163.MCT-08-0493. [DOI] [PMC free article] [PubMed] [Google Scholar]
- Hennessy BT, Lu Y, Gonzalez-Angulo AM, Carey MS, Myhre S, Ju Z, Davies MA, Liu W, Coombes K, Meric-Bernstam F, et al. A Technical Assessment of the Utility of Reverse Phase Protein Arrays for the Study of the Functional Proteome in Non-microdissected Human Breast Cancers. Clin Proteomics. 2010;6:129–151. doi: 10.1007/s12014-010-9055-y. [DOI] [PMC free article] [PubMed] [Google Scholar]
- Hopfner M, Baradari V, Huether A, Schofl C, Scherubl H. The insulin-like growth factor receptor 1 is a promising target for novel treatment approaches in neuroendocrine gastrointestinal tumours. Endocr Relat Cancer. 2006;13:135–149. doi: 10.1677/erc.1.01090. [DOI] [PubMed] [Google Scholar]
- Iglewicz B, Hoaglin DC. How to Detect and Handle Outliers. Milwaukee, WI: American Society for Quality Control; 1993. [Google Scholar]
- Jiao Y, Shi C, Edil BH, de Wilde RF, Klimstra DS, Maitra A, Schulick RD, Tang LH, Wolfgang CL, Choti MA, et al. DAXX/ATRX, MEN1, and mTOR pathway genes are frequently altered in pancreatic neuroendocrine tumors. Science. 2011;331:1199–1203. doi: 10.1126/science.1200609. [DOI] [PMC free article] [PubMed] [Google Scholar]
- Katome T, Obata T, Matsushima R, Masuyama N, Cantley LC, Gotoh Y, Kishi K, Shiota H, Ebina Y. Use of RNA interference-mediated gene silencing and adenoviral overexpression to elucidate the roles of AKT/protein kinase B isoforms in insulin actions. J Biol Chem. 2003;278:28312–28323. doi: 10.1074/jbc.M302094200. [DOI] [PubMed] [Google Scholar]
- Meric-Bernstam F, Akcakanat A, Chen H, Do KA, Sangai T, Adkins F, Gonzalez-Angulo AM, Rashid A, Crosby K, Dong M, et al. PIK3CA/PTEN mutations and Akt activation as markers of sensitivity to allosteric mTOR inhibitors. Clin Cancer Res. 2012;18:1777–1789. doi: 10.1158/1078-0432.CCR-11-2123. [DOI] [PMC free article] [PubMed] [Google Scholar]
- Meric-Bernstam F, Akcakanat A, Chen H, Sahin A, Tarco E, Carkaci S, Adrada BE, Singh G, Do KA, Garces ZM, et al. Influence of biospecimen variables on proteomic biomarkers in breast cancer. Clin Cancer Res. 2014;20:3870–3883. doi: 10.1158/1078-0432.CCR-13-1507. [DOI] [PMC free article] [PubMed] [Google Scholar]
- Meric-Bernstam F, Gonzalez-Angulo AM. Targeting the mTOR signaling network for cancer therapy. J Clin Oncol. 2009;27:2278–2287. doi: 10.1200/JCO.2008.20.0766. [DOI] [PMC free article] [PubMed] [Google Scholar]
- Nakae J, Kitamura T, Ogawa W, Kasuga M, Accili D. Insulin regulation of gene expression through the forkhead transcription factor Foxo1 (Fkhr) requires kinases distinct from Akt. Biochemistry. 2001;40:11768–11776. doi: 10.1021/bi015532m. [DOI] [PubMed] [Google Scholar]
- O'Reilly KE, Rojo F, She QB, Solit D, Mills GB, Smith D, Lane H, Hofmann F, Hicklin DJ, Ludwig DL, et al. mTOR inhibition induces upstream receptor tyrosine kinase signaling and activates Akt. Cancer Res. 2006;66:1500–1508. doi: 10.1158/0008-5472.CAN-05-2925. [DOI] [PMC free article] [PubMed] [Google Scholar]
- Pavel ME, Hainsworth JD, Baudin E, Peeters M, Horsch D, Winkler RE, Klimovsky J, Lebwohl D, Jehl V, Wolin EM, et al. Everolimus plus octreotide long-acting repeatable for the treatment of advanced neuroendocrine tumours associated with carcinoid syndrome (RADIANT-2): a randomised, placebo-controlled, phase 3 study. Lancet. 2011;378:2005–2012. doi: 10.1016/S0140-6736(11)61742-X. [DOI] [PubMed] [Google Scholar]
- Raymond E, Dahan L, Raoul JL, Bang YJ, Borbath I, Lombard-Bohas C, Valle J, Metrakos P, Smith D, Vinik A, et al. Sunitinib malate for the treatment of pancreatic neuroendocrine tumors. N Engl J Med. 2011;364:501–513. doi: 10.1056/NEJMoa1003825. [DOI] [PubMed] [Google Scholar]
- Reidy-Lagunes DL, Vakiani E, Segal MF, Hollywood EM, Tang LH, Solit DB, Pietanza MC, Capanu M, Saltz LB. A phase 2 study of the insulin-like growth factor-1 receptor inhibitor MK-0646 in patients with metastatic, well-differentiated neuroendocrine tumors. Cancer. 2012;118:4795–4800. doi: 10.1002/cncr.27459. [DOI] [PubMed] [Google Scholar]
- Strosberg JR, Chan JA, Ryan DP, Meyerhardt JA, Fuchs CS, Abrams T, Regan E, Brady R, Weber J, Campos T, et al. A multi-institutional, phase II open-label study of ganitumab (AMG 479) in advanced carcinoid and pancreatic neuroendocrine tumors. Endocr Relat Cancer. 2013;20:383–390. doi: 10.1530/ERC-12-0390. [DOI] [PMC free article] [PubMed] [Google Scholar]
- Therasse P, Arbuck SG, Eisenhauer EA, Wanders J, Kaplan RS, Rubinstein L, Verweij J, Van Glabbeke M, van Oosterom AT, Christian MC, et al. New guidelines to evaluate the response to treatment in solid tumors. Journal of the National Cancer Institute. 2000;92:205–216. doi: 10.1093/jnci/92.3.205. [DOI] [PubMed] [Google Scholar]
- Thimmaiah KN, Easton J, Huang S, Veverka KA, Germain GS, Harwood FC, Houghton PJ. Insulin-like growth factor I-mediated protection from rapamycin-induced apoptosis is independent of Ras-Erk1-Erk2 and phosphatidylinositol 3′-kinase-Akt signaling pathways. Cancer Res. 2003;63:364–374. [PubMed] [Google Scholar]
- Ulanet DB, Ludwig DL, Kahn CR, Hanahan D. Insulin receptor functionally enhances multistage tumor progression and conveys intrinsic resistance to IGF-1R targeted therapy. Proc Natl Acad Sci U S A. 2010;107:10791–10798. doi: 10.1073/pnas.0914076107. [DOI] [PMC free article] [PubMed] [Google Scholar]
- von Wichert G, Jehle PM, Hoeflich A, Koschnick S, Dralle H, Wolf E, Wiedenmann B, Boehm BO, Adler G, Seufferlein T. Insulin-like growth factor-I is an autocrine regulator of chromogranin A secretion and growth in human neuroendocrine tumor cells. Cancer Res. 2000;60:4573–4581. [PubMed] [Google Scholar]
- Wulbrand U, Remmert G, Zofel P, Wied M, Arnold R, Fehmann HC. mRNA expression patterns of insulin-like growth factor system components in human neuroendocrine tumours. Eur J Clin Invest. 2000;30:729–739. doi: 10.1046/j.1365-2362.2000.00700.x. [DOI] [PubMed] [Google Scholar]
- Yao JC, Hassan M, Phan A, Dagohoy C, Leary C, Mares JE, Abdalla EK, Fleming JB, Vauthey JN, Rashid A, et al. One hundred years after “carcinoid”: epidemiology of and prognostic factors for neuroendocrine tumors in 35,825 cases in the United States. J Clin Oncol. 2008;26:3063–3072. doi: 10.1200/JCO.2007.15.4377. [DOI] [PubMed] [Google Scholar]
- Yao JC, Shah MH, Ito T, Bohas CL, Wolin EM, Van Cutsem E, Hobday TJ, Okusaka T, Capdevila J, de Vries EG, et al. Everolimus for advanced pancreatic neuroendocrine tumors. N Engl J Med. 2011;364:514–523. doi: 10.1056/NEJMoa1009290. [DOI] [PMC free article] [PubMed] [Google Scholar]
- Yee D. Insulin-like growth factor receptor inhibitors: baby or the bathwater? J Natl Cancer Inst. 2012;104:975–981. doi: 10.1093/jnci/djs258. [DOI] [PMC free article] [PubMed] [Google Scholar]
Associated Data
This section collects any data citations, data availability statements, or supplementary materials included in this article.