

Abstract
Importance
Considerable advances have been made in our understanding of the genetics underlying amyotrophic lateral sclerosis (ALS). Nevertheless, for the majority of patients who receive a diagnosis of ALS, the role played by genetics is unclear. Further elucidation of the genetic architecture of this disease will help clarify the role of genetic variation in ALS populations.
Objective
To estimate the relative importance of genetic factors in a complex disease such as ALS by accurately quantifying heritability using genome-wide data derived from genome-wide association studies.
Design, Setting, and Participants
We applied the genome-wide complex trait analysis algorithm to 3 genome-wide association study data sets that were generated from ALS case-control cohorts of European ancestry to estimate the heritability of ALS. Cumulatively, these data sets contained genotype data from 1223 cases and 1591 controls that had been previously generated and are publically available on the National Center for Biotechnology Information database of genotypes and phenotypes website (http://www.ncbi.nlm.nih.gov/gap). The cohorts genotyped as part of these genome-wide association study efforts include the InCHIANTI (aging in the Chianti area) Study, the Piemonte and Valle d’Aosta Register for Amyotrophic Lateral Sclerosis, the National Institute of Neurological Disorders and Stroke Repository, and an ALS specialty clinic in Helsinki, Finland.
Main Outcomes and Measures
A linear mixed model was used to account for all known single-nucleotide polymorphisms simultaneously and to quantify the phenotypic variance present in ostensibly outbred individuals. Variance measures were used to estimate heritability.
Results
With our meta-analysis, which is based on genome-wide genotyping data, we estimated the overall heritability of ALS to be approximately 21.0% (95% CI, 17.1–24.9) (SE = 2.0%), indicating that additional genetic variation influencing risk of ALS loci remains to be identified. Furthermore, we identified 17 regions of the genome that display significantly high heritability estimates. Eleven of these regions represent novel candidate regions for ALS risk.
Conclusions and Relevance
We found the heritability of ALS to be significantly higher than previously reported. We also identified multiple, novel genomic regions that we hypothesize may contain causative risk variants that influence susceptibility to ALS.
INTRODUCTION
Amyotrophic lateral sclerosis (ALS) is the most common motor neuron disease affecting adults. It is characterized by muscle atrophy and paralysis of limb and bulbar musculature, and generally results in death from respiratory failure within 3 to 5 years of symptom onset.1,2 Between 5% and 10% of cases of ALS are considered familial in nature, whereas the majority of cases are classified as sporadic (ie, resulting from disease occurrence in individuals with no apparent family history).1 A number of familial aggregation studies, twin studies, and epidemiological studies suggest that genetic factors contribute to sporadic ALS.3–5 Furthermore, a number of loci relevant to ALS pathogenesis have been identified to the point where the genetic etiology is known in two-thirds of familial cases and one-third of sporadic cases.6,7 In particular, a hexanucleotide repeat expansion in the C9orf72 gene has recently been identified as the most common cause of ALS and frontotemporal dementia, a closely related neurodegenerative disease.6,8 Genome-wide association studies (GWASs) have also identified putatively associated variants with moderate risk effects associated with risk of ALS development (Table 1).9,10,12–14
Table 1.
ALS Variants
| Primary variant | Chr | Position (b37) | Gene Name | Citation(s) |
|---|---|---|---|---|
|
| ||||
| rs80356717 | 1 | 11078893 | TARDBP | Chiò et al., 2009 |
| rs16856202 | 1 | 232155151 | DISC1 | Landers et al., 2009 |
| rs179943 | 6 | 16398318 | ATXN1 | Bettens et al., 2010 |
| rs2708909 | 7 | 48051679 | SUN3, HUS1* | Chiò et al., 2009 |
| rs10260404 | 7 | 154210798 | DPP6* | Cronin et al., 2008; van Es et al., 2007 |
| rs2708851 | 7 | 48085802 | C7orf57 | Chiò et al., 2009 |
| rs3849942 | 9 | 27543281 | c9ORF72* | Laaksovirta et al., 2010 |
| rs2225389 | 9 | 27409264 | MOB3B | Laaksovirta et al., 2010 |
| rs2306677 | 12 | 26636386 | ITPR2 | van Es et al., 2007 |
| rs13048019 | 21 | 32918294 | TIAM1 | Laaksovirta et al., 2010 |
Moderate effect loci previously identified by GWAS as contributing risk to ALS development. All SNPs are in build37.
Indicates nearby gene.
Although additional genetic factors remain to be found for ALS, it is not clear how many such ALS genes exist or what portion of the neurodegenerative disease is attributable to genetic factors. One way to quantify the role that genetics plays in any disease is to measure heritability. In this context, heritability refers to the portion of a disease that is due to genetic (inherited) factors. Prior work in family studies has estimated that between 1.6% and 5.6% of individuals who receive a diagnosis of ALS have a family member with ALS.15 Twin studies have further estimated concordance to be between 38% and 85%. This range is narrowed only slightly when stratifying the analysis by type of ALS: twin concordance is estimated to be between 60% and 86% when considering the familial form of ALS and between 38% and 78% when considering the sporadic form of ALS.15
As we move toward an era of personalized medicine, understanding the heritable components of a phenotype are critical to estimating an individual’s susceptibility to disease. “Missing heritability” results when the individual genes identified by GWASs do not account for all of the genetic variance of a phenotype as estimated by twin or family studies, and it suggests that there are genetic factors contributing to the disease that have yet to be identified. To more accurately capture the heritability associated with ALS risk, it is necessary to estimate the polygenic additive variance using all genome-wide single-nucleotide polymorphisms (SNPs) simultaneously, as opposed to restricting analysis to single significant SNPs, which is the standard GWAS approach.16–18 This was recently performed using sporadic ALS cases and resulted in an estimate of approximately 12%, which validated it as a way to estimate disease risk in a given population by measuring common variation.19
Genome-wide complex trait analysis (GCTA) is a software tool that uses a sophisticated algorithm that allows heritability estimates to be calculated based on all genome-wide SNPs simultaneously.18,20 It measures the genome in a fundamentally different way than GWASs do.
A GWAS examines the entire genome for the presence of genetic variants associated with the phenotype being examined, and it measures each variant individually to produce a P value to quantify the statistical significance of that association. Genome-wide complex trait analysis, on the other hand, examines all known variants simultaneously to determine the genetic variance associated with the phenotype in question. Thus, smaller effect variants that do not reach significance in a GWAS analysis are included in the analysis to give a more robust measurement of heritability. In essence, a GWAS generally only identifies large or moderate effect variants, whereas GCTA includes rarer effect variants in its calculations.
In our analysis, we used the GCTA method to compute a lower bound on ALS heritability in populations of Central European and Scandinavian ancestry. We further used this mixed modeling approach to identify regions of the genome that are likely to contain more of this heritable risk. By definition, these regions are candidate loci for ALS.
METHODS
Description of Cohorts
Three ALS GWAS data sets, herein referred to as cohorts, were obtained. The first cohort included 440 Finnish cases collected from an ALS specialty clinic in Helsinki, Finland, and 521 ethnically matched controls obtained from a study of elderly Finnish individuals.14 Individuals with both sporadic and familial forms of ALS are included in the Finnish cohort. Genotyping was performed using Illumina Infinium Human 370 Beadchips.14
The second cohort of ALS samples consisted of 276 US cases and 807 controls from the National Institute of Neurological Disorders and Stroke (NINDS) Neurogenetics Repository at the Coriell Institute for Medical Research in Camden, New Jersey. Cases included both sporadic and familial forms, and controls were drawn from various sites across the United States. All controls were extensively screened for family histories with primary neurological disorders. Genotyping was performed using Illumina Infinium II HumanHap 550 Beadchips.9,21
Lastly, 507 Italian cases were obtained through the Piemonte and Valle d’Aosta Register for Amyotrophic Lateral Sclerosis, an epidemiological study based in 2 regions of northwestern Italy; 263 Italian controls were obtained from the InCHIANTI (aging in the Chianti area) Study, a population-based cohort of elderly individuals in central Italy.22 Both cases and controls were genotyped using Illumina Infinium I HumanHap 500 Beadchips.
The X and Y chromosomes were excluded from this analysis, as were individuals with known monogenic mutations. Study descriptives were calculated for each cohort (Table 2). Additional details for these cohorts can be found in the referenced works.
Table 2.
Descriptive Statistics
| Cases | Controls | Study Details | |||||||||
|---|---|---|---|---|---|---|---|---|---|---|---|
|
| |||||||||||
| Cohort | Sample size | Female (%) | LAO Bulbar (%) | AAO (years [SD]) | Sample size | Female (%) | LAO Bulbar (%) | AAO (years [SD]) | # SNPs used for imputation | # SNPs imputed | Genomic inflation factor (λ)* |
|
| |||||||||||
| US | 276 | 36.6 | 23.4 | 54.7 (12.2) | 807 | 58.4 | NA | 58.6 (16.4) | 519579 | 16566574 | 1.03 |
| Italians | 507 | 46.6 | 26.8 | 61.4 (11.2) | 263 | 44.9 | NA | 59.8 (8.8) | 511645 | 16505937 | 1.12 |
| Finnish | 440 | 51.1 | 25.8 | 56.6 (11.6) | 521 | 79.5 | NA | 88.6 (2.9) | 326410 | 17070203 | 1.17 |
Descriptive statistics for individual cohorts involved in the analyses. Imputed SNPs were filtered for quality by excluding variants with MAF lower than 0.01 or R2 value lower than 0.30.
Lambda factors were drawn from the initial study publications.
LAO = Location (of disease) at onset. AAO = Age at onset.
Quality Control
To control for artifacts introduced to the data during genotyping, initial standard quality-control measures were applied to all data sets prior to analyses. These measures exclude individuals with call rates of less than 95% and individuals who did not self-identify as white or who exhibited a sex mismatch between phenotype and genotype data. Individuals with markers that departed significantly from Hardy-Weinberg equilibrium (P < .001) were also excluded. Additional specific cohort-level quality-control measures can be found in the referenced cohort-specific publications.9,14,21,22
To avoid systematic differences between cases and controls being interpreted as genetic variance, a more stringent quality-control process was then applied to the data. This included excluding individuals with incomplete phenotype data and removing markers with a minor allele frequency of less than 1%. This step was performed using PLINK.23 To control for underlying cryptic relatedness within the cohorts, pairs with an estimated relatedness of greater than 0.125, or samples identified as first- or second-degree relatives by identity-by-descent analyses, were also excluded.20 Principle component analysis was performed using GCTA, and eigenvalues 1 to 20 were used as covariates to control for population stratification and confirm European ancestry of samples of individuals.24 The first 2 principle components within each population were plotted to confirm that the case and control samples within these populations were consistently matched (eFigure 1 in the Supplement). Imperfect case-control matching may result in modest changes in estimates of heritability, but prior work has indicated that these are insignificant fluctuations, and stringent quality control removes artifactual contributions to genetic variance.25,26 In addition, quality control for this method is applied more stringently than in GWASs, to ensure that ascertainment bias or other study-design effects, such as technical artifacts between cases and controls, are accounted for and do not contribute to estimates of genetic variance.18 Furthermore, ALS is a relatively rare condition, making it unlikely that the controls are cryptically affected.
Sample collection was approved by the ethics committees for ophthalmology, otorhinolaryngology, neurology and neurosurgery, and internal medicine in the hospital district of Helsinki and Uusimaa and by the institutional review boards of the National Institute on Aging, the NINDS, and the National Institute of Mental Health. All participants provided written informed consent and received no financial compensation. The samples are kept at the NINDS Neurogenetics Repository at the Coriell Institute for Medical Research and can be accessed from the institute’s website (http://www.coriell.org [protocol 2008-146]).
After quality-control measures were applied, imputation was performed in a 2-stage design. Missing genotypes for each cohort were estimated using 566 haplotypes derived from 379 participants with European ancestry from the 1000 Genomes project, using a Markov Chain–based haplotyper (MaCH; version 1.0.16 [http://genome.sph.umich.edu/wiki/Minimac]). Chunk-Chromosome, a MaCH helper utility, was used to divide the chromosomes into smaller segments, streamlining the imputation process by running the segments in parallel. Segments were produced using 2500-marker segments, with a 500-marker overlap between adjacent segments. The number of segments produced per cohort was dependent on the number of genotyped variants. Each chromosome segment was approximately 20 megabases (Mb) long, although the length varied slightly between cohorts. For example, the Italian and US cohorts produced more segments because more genotyped SNPs were available for imputation (Table 2). The default settings of Minimac were then used to impute variants into each cohort. Following imputation, variants with minor allele frequencies of less than 0.01 were removed. The R2 metric from MaCH, which measures the squared correlation between proximal experimental and imputed genotypes, was used to remove imputed SNPs below a value of 0.30. The R2 cutoff is designed to measure the correlation between imputed and true genotypes, and the default value in the GCTA software is 0.3.18 Removing SNPs with R2 < 0.3 minimizes the effects that imputation error may have on analyses because these SNPs are more likely to be poor in quality.27 Genomic control estimates confirmed minimal population stratification per cohort.
Genome-Wide Heritability Analyses
Imputed and segmented data were merged using GCTA, and SNPs were divided into 3 basic data sets for each cohort. These included (1) all imputed and genotyped SNPs, (2) all known SNPs located within ±1 Mb of a region identified by replicated GWASs as being associated with ALS (Table 1); and (3) SNPs not located within ±1 Mb of a region identified by GWASs as being associated with ALS.
Individual data were further divided into subsets to explore the heritability of different forms of ALS. These subsets include individuals with known site of disease onset (limb-onset or bulbar-onset ALS) and individuals 50 years of age or older (late-onset ALS). Individuals whose disease onset was earlier than 50 years ago are generally considered early-onset patients within the ALS literature and were excluded from our study because there were not enough samples to perform the analysis.28–31 Given that the median age at onset of ALS is 63 years,32 we felt that 50 years of age adequately separated early-onset from late-onset individuals.
Genome-wide complex trait analysis was performed for each cohort.18,20 Genetic relationship matrices were calculated for each subset of data to determine the genetic relationship between pairs of individuals. Genetic relationship matrices were then input into restricted maximum likelihood analyses to produce estimates of the proportion of phenotypic variance explained by the SNPs within each subset of data. Disease prevalence was specified as 0.0001 based on epidemiological reports from general European ancestry populations.15,32–36 Estimates were transformed to the liability scale in GCTA to account for ascertainment bias.
A random-effects meta-analysis was conducted with the rmeta package in R version 2.15 (R Foundation for Statistical Computing, Vienna, Austria). Heterogeneity was quantified using the I2 statistic, where 0% indicates no heterogeneity and 100% indicates pure heterogeneity.37 These analyses were also applied to the genotyped data before imputation, in order to compare the differences in variation captured.
Heritability Fine Mapping Analyses
To localize heritability signals within the genome, we applied a mixed model heritability analysis using the software GCTA to unmerged segments of the genome, in approximately 20-Mb increments across all cohorts. Statistically significant segments were selected for follow-up and were further subdivided into identical 1-Mb regions. Statistical significance after Bonferroni correction was defined as P < .0004. This was estimated by dividing 0.05 by the number of available segments across the genome.
Genome-wide complex trait analysis was applied to all segments in each cohort separately, and the resulting summary statistics were meta-analyzed using a random-effects model.
RESULTS
For all ALS types and all known SNPs, heritability was estimated to be 21.0% (95% CI, 17.1–24.9) (SE = 2.0%) (Table 3). Late-onset and limb-onset individuals exhibited marginally higher estimates at 22.0% (95% CI, 17.1–26.9) (SE = 2.5%) and 23.0% (95% CI, 17.1–28.89) (SE = 3.0%), respectively. However, the highest heritability estimate was observed among individuals with bulbar-onset disease (35.0% [95% CI, 29.1–40.9] [SE = 3.0%]). These genome-wide results were statistically significant (P < 1 × 10⁻¹⁰) and are visually depicted in Figure 1. These analyses were also run on subsets of the genome defined by GWAS and non-GWAS regions (eFigures 2 and 3 in the Supplement). Cohort-level estimates for the genotyped and imputed SNP set analysis are provided in Table 4. The estimates are very close between subsets, with the imputed SNP sets reporting smaller standard errors and more significant P values.
Table 3.
Meta Analysis Results
| ALS type | SNPs Included in Analysis | Heritability Estimate from Random Effects | Lower 95% CI | Upper 95% CI | P-value from Random Effects | Heterogeneity χ2 distribution | I2 | Heterogeneity P-value |
|---|---|---|---|---|---|---|---|---|
|
| ||||||||
| All | All SNPs | 0.21 | 0.19 | 0.23 | < 1E-10 | 0.51 | 0 | 0.7745 |
| GWAS SNPs in ALS-loci/regions | 0.02 | −0.01 | 0.04 | 0.00132 | 11.18 | 82.11 | 0.004 | |
| Non-GWAS Regions | 0.21 | 0.19 | 0.23 | < 1E-10 | 0.49 | 0 | 0.783 | |
| Late Onset | All SNPs | 0.22 | 0.2 | 0.25 | < 1E-10 | 0.39 | 0 | 0.8247 |
| GWAS SNPs in ALS-loci/regions | 0.02 | 0 | 0.04 | 0.01038 | 4.06 | 50.74 | 0.132 | |
| Non-GWAS Regions | 0.22 | 0.2 | 0.25 | < 1E-10 | 0.35 | 0 | 0.841 | |
| Limb | All SNPs | 0.23 | 0.21 | 0.26 | < 1E-10 | 1.38 | 0 | 0.503 |
| GWAS SNPs in ALS-loci/regions | 0.03 | −0.02 | 0.07 | 0.00038 | 19.07 | 89.51 | 0.0001 | |
| Non-GWAS Regions | 0.23 | 0.2 | 0.26 | < 1E-10 | 0.74 | 0 | 0.691 | |
| Bulbar | All SNPs | 0.35 | 0.32 | 0.38 | < 1E-10 | 1.53 | 0 | 0.464 |
| GWAS SNPs in ALS-loci/regions | 0.01 | −0.02 | 0.03 | 0.62908 | 0.24 | 0 | 0.887 | |
| Non-GWAS Regions | 0.35 | 0.32 | 0.38 | < 1E-10 | 1.49 | 0 | 0.475 | |
Meta-results from stratified analyses. Considerable heterogeneity is observed in most GWAS regions. The random-effect model assumes a normal distribution. CI values are within 1.96 standard deviations of the heritability estimate produced from random effects.
Figure 1. Heritability Estimates Across Stratified ALS Cohorts.
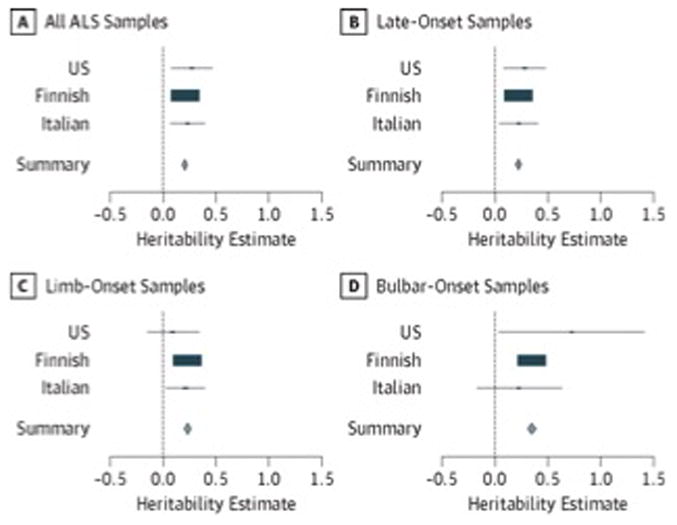
Cohort-specific heritability estimates are shown in blue, the rectangle size is proportional to the effect size. The 95% CIs of the summary heritability estimates are shown as diamonds (and provided numerically in Table 3), with the centerline of each diamond representing the summary heritability estimate for that particular subset of data (A–D). ALS indicates amyotrophic lateral sclerosis.
Table 4.
Cohort-level Results – Imputed Data
| ALS type | Imputed SNPs Included in Analysis | Cohort | Heritability Estimate | Standard Error | P-value |
|---|---|---|---|---|---|
|
| |||||
| All | ALL | Finnish | 0.209714 | 0.000001 | 8.82E-13 |
| All | GWAS | Finnish | 0.041609 | 0.008938 | 3.22E-10 |
| All | nonGWAS | Finnish | 0.209714 | 0.000001 | 1.40E-14 |
| All | ALL | US | 0.274123 | 0.000300 | 5.43E-11 |
| All | GWAS | US | 0.000001 | 0.009359 | 5.00E-01 |
| All | nonGWAS | US | 0.274123 | 0.000291 | 4.79E-11 |
| All | ALL | Italians | 0.231467 | 0.000052 | 3.89E-16 |
| All | GWAS | Italians | 0.000001 | 0.010478 | 5.00E-01 |
| All | nonGWAS | Italians | 0.231467 | 0.000056 | 3.89E-16 |
| Late onset | ALL | Finnish | 0.223782 | 0.000001 | 8.85E-15 |
| Late onset | GWAS | Finnish | 0.040397 | 0.010568 | 1.41E-06 |
| Late onset | nonGWAS | Finnish | 0.223782 | 0.000001 | 7.80E-15 |
| Late onset | ALL | US | 0.284462 | 0.000505 | 1.20E-07 |
| Late onset | GWAS | US | 0.000001 | 0.013299 | 5.00E-01 |
| Late onset | nonGWAS | US | 0.284462 | 0.000517 | 9.59E-08 |
| Late onset | ALL | Italians | 0.228339 | 0.000083 | 5.00E-16 |
| Late onset | GWAS | Italians | 0.000001 | 0.012124 | 5.00E-01 |
| Late onset | nonGWAS | Italians | 0.228339 | 0.000088 | 5.00E-16 |
| Limb | ALL | Finnish | 0.234402 | 0.000103 | 1.03E-08 |
| Limb | GWAS | Finnish | 0.069177 | 0.012020 | 2.07E-13 |
| Limb | nonGWAS | Finnish | 0.234402 | 0.000102 | 1.02E-08 |
| Limb | ALL | US | 0.319497 | 0.000337 | 1.34E-08 |
| Limb | GWAS | US | 0.000001 | 0.012100 | 5.00E-01 |
| Limb | nonGWAS | US | 0.319497 | 0.000331 | 1.23E-08 |
| Limb | ALL | Italians | 0.213583 | 0.000178 | 4.26E-09 |
| Limb | GWAS | Italians | 0.000001 | 0.012786 | 5.00E-01 |
| Limb | nonGWAS | Italians | 0.213583 | 0.000181 | 4.43E-09 |
| Bulbar | ALL | Finnish | 0.349506 | 0.000307 | 2.28E-11 |
| Bulbar | GWAS | Finnish | 0.036142 | 0.019554 | 1.80E-02 |
| Bulbar | nonGWAS | Finnish | 0.349506 | 0.000306 | 6.15E-11 |
| Bulbar | ALL | US | 0.726281 | 0.002809 | 4.82E-04 |
| Bulbar | GWAS | US | 0.000001 | 0.028333 | 5.00E-01 |
| Bulbar | nonGWAS | US | 0.726281 | 0.002497 | 4.39E-04 |
| Bulbar | ALL | Italians | 0.227231 | 0.000059 | 6.43E-10 |
| Bulbar | GWAS | Italians | 0.000001 | 0.023483 | 5.00E-01 |
| Bulbar | nonGWAS | Italians | 0.227231 | 0.000067 | 6.67E-10 |
Cohort-level heritability estimates produced from each stratified SNP set.
Heritability Estimates Across Stratified ALS Cohorts
Cohort-specific heritability estimates are shown in blue, the rectangle size is proportional to the effect size. The 95% CIs of the summary heritability estimates are shown as diamonds (and provided numerically in Table 3), with the centerline of each diamond representing the summary heritability estimate for that particular subset of data (A-D). ALS indicates amyotrophic lateral sclerosis.
When considering all ALS types, we found that 17 regions of the genome (each approximately 20 Mb long) were highly significant (P < .0004) in at least 1 cohort (Figure 2). The regional results from each cohort were then meta-analyzed using random effects; these results are show in Figure 2. Regional heritability estimates for all segments can be found in the eTable in the Supplement. Each of these 17 regions was further divided into 1-Mb segments. Combined heritability estimates for the majority of these segmented regions are graphically depicted in the supplemental regional figures (eFigures 4–17 in the Supplement). Three particularly noteworthy regions are discussed herein.
Figure 2. Genome-Wide Heritability Estimates, in Approximately 20-Mb Imputed Segments.
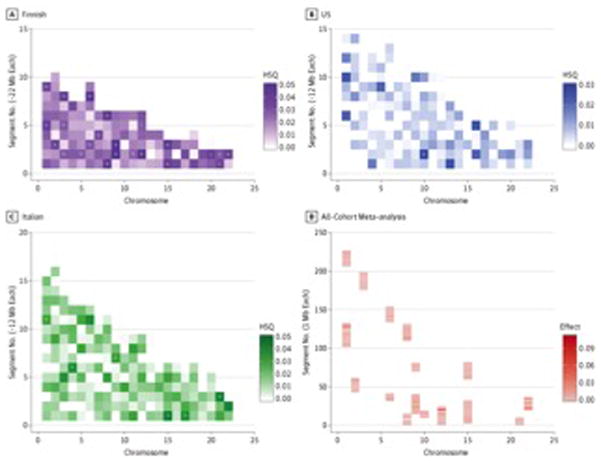
Heat plots show heritability estimates across the genome for each cohort. The x-axis represents chromosomes 1 to 22, and the y-axis represents the length of each chromosome in base pairs. The regions of interest are identified by greater pigmentation within the approximately 12- to 22-Mb segments. P < .0004 were considered statistically significant in the Finnish population; P < .0003 were considered statistically significant in the Italian and US cohorts. This difference is due to the varying number of segments each cohort produced during imputation (Table 2). D, The most significant regions from all 3 cohorts were meta-analyzed. Each bar represents approximately 1 Mb; hence, there are an additional number of segments. HSQ indicates heritability estimate; Mb, megabases.aP ≤ .0004.bP ≤ .001.cP ≤ .0007.dP ≤ .0003.
Heat plots show heritability estimates across the genome for each cohort. The x-axis represents chromosomes 1 to 22, and the y-axis represents the length of each chromosome in base pairs. The regions of interest are identified by greater pigmentation within the approximately 12- to 22-Mb segments. P < .0004 were considered statistically significant in the Finnish population; P < .0003 were considered statistically significant in the Italian and US cohorts. This difference is due to the varying number of segments each cohort produced during imputation (Table 2). D, The most significant regions from all 3 cohorts were meta-analyzed. Each bar represents approximately 1 Mb; hence, there are an additional number of segments. HSQ indicates heritability estimate; Mb, megabases.aP ≤ .0004.bP ≤ .001.cP ≤ .0007.dP ≤ .0003.
When examined, it was found that some of the regions contributing to the heritability of ALS are those previously identified by GWASs or are within areas that border these regions. This effect was most notable on the short arm of chromosome 9, where the C9orf72 hexanucleotide repeat expansion is located, causing more than 40% of familial cases of ALS and more than 20% of sporadic cases of ALS.6,8 This can be seen in Figure 3. Exome sequencing has also previously identified mutations in VCP (a nearby region also on chromosome 9) as contributors to familial ALS.38 Here we observe a significantly elevated regional heritability estimate in the segment of the genome containing VCP.
Figure 3. Regional Heritability Estimates and Accompanying Gene Models for Chromosome 9.
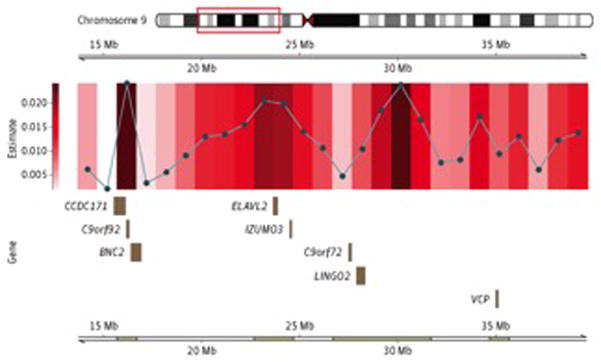
Regions of significance identified in Figure 2 are further divided into 1-Mb segments. The gene model describes the protein-coding segments located in the 1-Mb region with the smallest P value. Mb indicates megabases.
Other regions identified as having significant heritability for ALS have not been reported by previous GWASs but are located near potential genes of interest. These include a region on chromosome 15 between position (build 37) 24 001 200 base pairs (bp) and position 25 001 200 bp (P = 8.52 × 10⁻⁴), shown in Figure 4, and a gene-rich region on the long arm of chromosome 22, between position (build 37) 36 675 903 bp and position 37 675 903 bp (P = 1.46 × 10⁻³), shown in Figure 5. Gene products associated with the remaining most heritable 1-Mb regional segments (17 distinct chromosomal regions) are provided in the supplemental regional figures (ie, eFigures 4–17 in the Supplement), along with the precise genomic locations of these regions.
Figure 4. Regional Heritability Estimates and Accompanying Gene Models for Chromosome 15.
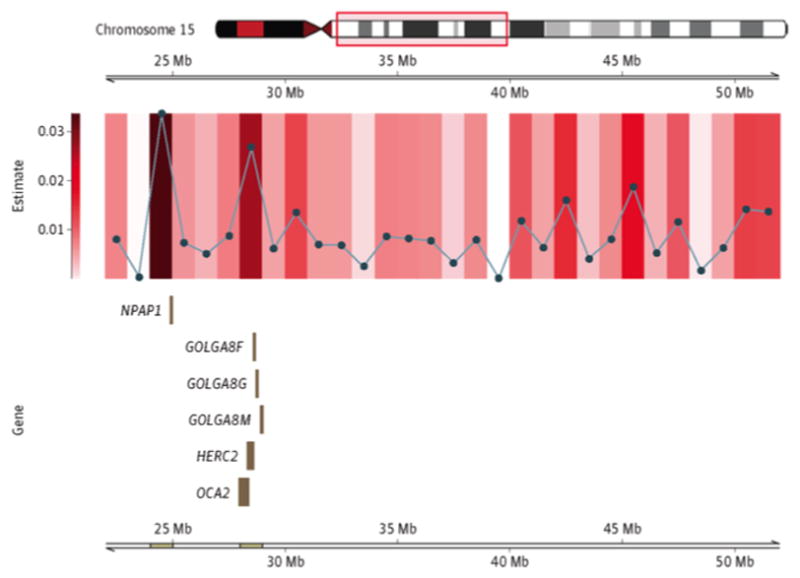
Regions of significance identified in Figure 2 are further divided into 1-Mb segments. The accompanying gene model describes the protein-coding segments located in the 1-Mb region with the smallest P value. Mb indicates megabases.
Figure 5. Regional Heritability Estimates and Accompanying Gene Models for Chromosome 15.
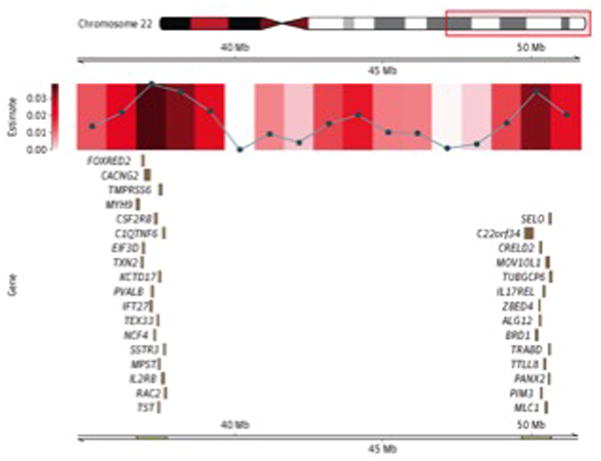
Regions of significance identified in Figure 2 are further divided into 1-Mb segments. The accompanying gene model describes the protein-coding segments located in the 1-Mb region with the smallest P value. Mb indicates megabases.
DISCUSSION
Genome-wide association studies of ALS do not often replicate successfully, which suggests that the ALS phenotype is driven not by a single locus but by many genes that cumulatively elevate risk.21 The cohorts used here have been used in prior ALS GWASs, with varying success. Chiò et al9 identified a region on chromosome 7 containing the genes SUNC1, HUS1, and C7orf57, but the variants tagging this region were only marginally associated with ALS and did not reach genome-wide significance. Laaksovirta et al14 identified 2 strong signals of association, one on chromosome 21 in a region containing the SOD1 gene and the other on chromosome 9 containing the genes MOBKL2B, IFNK, and C9orf72. Cumulatively, the samples described in these 3 cohorts are relatively small from a power perspective, but these cohorts contain enough samples to observe variants with odds ratios below 1.5 using GWAS methods. However, because GCTA does not identify genetic variants directly, these data sets are sufficient to examine potential regions of heritability.
Our data confirm that much of the genetic variation driving susceptibility to ALS remains to be discovered. Although microarray-based genotyping methods limit the sensitivity by which heritability can be calculated, our analyses show a significant increase over previous GWAS estimates published by Fogh et al.19 This is because standard GWAS methods typically identify common variants with lower effects, whereas rare variants with presumably larger effects are tagged less accurately.
Additional factors may affect heritability estimates. When considering a meta-analysis of the heritability estimates produced by GCTA, one assumes a normal distribution of values despite the estimates being bound between 0 and 1. Thus, very low or very high estimates should be subject to additional scrutiny. Other factors include demographic differences between cohorts that contribute to the variation observed between heritability estimates. For example, the more recent ancestry and expansion of the Finnish population is reflected in their genetic structure. Compared with the other cohorts, the Finnish produced lower heritability estimates across the genome but higher estimates when only GWAS SNPs are considered (eFigure 2 in the Supplement).
The heterogeneity observed in GWAS regions is notable because it suggests potential differences in the coverage of the genome between cohorts in regions where prior associations have been made. The use of imputation to compare the same set of SNPs between cohorts should account for this; however, genotypes are imputed based on the haplotype structures of individual cohorts, and, therefore, although analysis occurs across the same set of SNPs, differences are expected. However, the similarity of results between the genotyped and imputed SNP estimates suggests a high degree of concordance between the SNP sets.
The prevalence value also affects heritability estimates, although to a lesser degree.39 The prevalence of ALS varies with age; therefore, we used a prevalence value standardized for age, specified here as 0.0001. Because the prevalence within the case population is larger than that within the control population, estimates were transformed to the liability scale. This also serves to control for ascertainment bias. Previous work has indicated that assumed prevalence values ranging from 0.005 to 0.015 affect GCTA estimates by only approximately 5%.39 The relatively conservative prevalence value used in this analysis provides significant evidence for the presence of additional genetic variance in ALS.
In addition, we included all available cases and controls in order to obtain the greatest possible power in our analysis, but it is possible that imperfections in case-control matching can result in marginal fluctuations in the heritability estimates reported here. The likelihood of this affecting our results was significantly reduced by considering the genetic ancestry of our samples and including principle components in our analysis.26 As the sample size of the included cohorts would otherwise be relatively small, the inclusion of as many quality samples as possible was important to the statistical significance of our results. Bootstrapping analyses can be useful for determining if the significant results of an analysis can be obtained simply by chance. Prior work combining GCTA and bootstrapping analyses have showed that the results produced by GCTA are highly reliable and unlikely obtained by chance.40 Lastly, 9 of the 10 loci used here have been replicated independently in other ALS GWAS data sets.6,8,12,13,41–46 Six of the 10 loci used here were initially identified in 2 of the 3 data sets used here: SUNC1, HUS1, C7orf57, MOBKL2B, IFNK, and C9orf72.9,14
Despite the improved estimates in heritability using the GCTA algorithm, our estimates are still likely to represent only the lower boundary of heritability. For example, insertions and deletions and structural variants were not considered in our method. De novo mutations are reported in known ALS genes, such as SOD147 and FUS,48 and such genetic factors would not be captured by the GCTA method. Prior work has suggested that such mutations may occur at a relatively high rate: de novo mutations were observed in sporadic ALS trios at a rate of 0.64, where 30 nonsynonymous, amino acid–altering events were recorded in 47 probands.49 However, the frequency of such events closely follows the Poisson distribution, where most probands contain 0 de novo events and few contain several, which suggests that these events do not largely effect ALS risk.49
Furthermore, our current estimates are based on genotyping array data, which are well recognized to be suboptimal for identification of rare variants. Exome sequencing, and ultimately genome sequencing, will allow rare variants with presumably higher effect sizes to be identified, and incorporation of future data into our models will almost certainly produce higher estimates of heritability in ALS. This “extra” heritability arising from the rare variants is often referred to as missing heritability, a term that will likely disappear from the vernacular as genome sequencing data sets grow in size.
CONCLUSIONS
The ultimate importance of these analyses lies in their support of the hypothesis that disease risk is likely the result of combined effects of many genes. For clinicians and neurologists, this information may change how disease risk is addressed and how common risk factors are identified. In addition to providing genome-wide estimates of heritability, we present data that show several regions of the genome harboring variants that contribute to risk of ALS. However, at this stage, these regions are large and contain many genes. It is not possible using current knowledge to identify which gene within these regions is responsible, and it may be misleading to nominate any particular gene within a region without biological validation. This is a common problem resulting from GWAS analyses and will be addressed in future studies using direct genotyping. It is our recommendation that these regions be followed up in candidate studies.
Supplementary Material
Table 5.
Cohort-level Results – Genotyped Data
| ALS type | Genotyped SNPs Included in Analysis | Cohort | Heritability Estimate | Standard Error | P-value |
|---|---|---|---|---|---|
|
| |||||
| All | ALL | Finnish | 0.209608 | 0.008411 | 8.00E-11 |
| All | GWAS | Finnish | 0.043400 | 0.009516 | 2.00E-09 |
| All | nonGWAS | Finnish | 0.209608 | 0.008773 | 1.00E-18 |
| All | ALL | US | 0.273985 | 0.096277 | 5.00E-01 |
| All | GWAS | US | 0.000001 | 0.009683 | 5.00E-01 |
| All | nonGWAS | US | 0.273985 | 0.099078 | 5.00E-01 |
| All | ALL | Italians | 0.231350 | 0.081525 | 5.00E-01 |
| All | GWAS | Italians | 0.009292 | 0.011155 | 2.00E-01 |
| All | nonGWAS | Italians | 0.231350 | 0.079332 | 5.00E-01 |
| Late onset | ALL | Finnish | 0.223669 | 0.011135 | 6.00E-17 |
| Late onset | GWAS | Finnish | 0.033892 | 0.010927 | 1.00E-04 |
| Late onset | nonGWAS | Finnish | 0.223669 | 0.011761 | 2.00E-16 |
| Late onset | ALL | US | 0.284318 | 0.097278 | 5.00E-01 |
| Late onset | GWAS | US | 0.000001 | 0.013372 | 5.00E-01 |
| Late onset | nonGWAS | US | 0.284318 | 0.102572 | 5.00E-01 |
| Late onset | ALL | Italians | 0.228224 | 0.090171 | 5.00E-01 |
| Late onset | GWAS | Italians | 0.013224 | 0.013192 | 1.00E-01 |
| Late onset | nonGWAS | Italians | 0.228224 | 0.087311 | 5.00E-01 |
| Limb | ALL | Finnish | 0.234284 | 0.013641 | 1.90E-17 |
| Limb | GWAS | Finnish | 0.068766 | 0.012300 | 3.00E-13 |
| Limb | nonGWAS | Finnish | 0.234284 | 0.014947 | 1.08E-16 |
| Limb | ALL | US | 0.091735 | 0.122753 | 2.00E-03 |
| Limb | GWAS | US | 0.000001 | 0.011687 | 5.00E-01 |
| Limb | nonGWAS | US | 0.132400 | 0.121146 | 2.00E-01 |
| Limb | ALL | Italians | 0.213475 | 0.090444 | 6.00E-16 |
| Limb | GWAS | Italians | 0.008173 | 0.012437 | 2.00E-01 |
| Limb | nonGWAS | Italians | 0.213475 | 0.093281 | 2.29E-02 |
| Bulbar | ALL | Finnish | 0.349330 | 0.017267 | 7.00E-13 |
| Bulbar | GWAS | Finnish | 0.012349 | 0.017944 | 2.00E-01 |
| Bulbar | nonGWAS | Finnish | 0.349330 | 0.016878 | 8.00E-13 |
| Bulbar | ALL | US | 0.725915 | 0.347415 | 2.00E-01 |
| Bulbar | GWAS | US | 0.000001 | 0.028841 | 5.00E-01 |
| Bulbar | nonGWAS | US | 0.725915 | 0.354909 | 5.00E-01 |
| Bulbar | ALL | Italians | 0.227785 | 0.202949 | 1.00E-01 |
| Bulbar | GWAS | Italians | 0.000001 | 0.022377 | 5.00E-01 |
| Bulbar | nonGWAS | Italians | 0.227785 | 0.202138 | 1.00E-02 |
Cohort-level heritability estimates produced from each stratified SNP set.
Acknowledgments
Additional Information: The collection of the Finnish data was supported by the National Institutes of Health and the National Institute on Aging, Microsoft Research, the ALS Association, Helsinki University Central Hospital, the Finnish Academy, the Sigrid Juselius Foundation, Finnish Medical Society Duodecim, and Kuopio University. The collection of the Italian samples was supported by Ministero della Salute, Ricerca Sanitaria Finalizzata 2007 (to Drs Chiò and Restagno), Fondazione Vialli e Mauro for ALS, Torino (to Dr Chiò), Regione Piemonte, Progetti Finalizzati (to Dr Restagno), the Intramural Research Program of the National Institutes of Health and the National Institute on Aging (grant Z01-AG000949-02), the NINDS, the Packard Center for ALS Research at Hopkins (to Dr Traynor), and the ALS Association (to Dr Traynor). The US samples were obtained from the NINDS Neurogenetics ALS Repository at Coriell Cell Repositories. We gratefully acknowledge support for the GENEVA (Genes and Environmental Exposures in Veterans with ALS) study from the National Institutes of Health (grant ES013244) and the ALS Association (grant 1230). The National Registry of Veterans with ALS (grant CSP 500A) and its DNA bank (grant CSP 478) were supported by the Department of Veterans Affairs Cooperative Studies Program (CSP). This study utilized the high-performance computational capabilities of the Biowulf Linux cluster at the National Institutes of Health (http://biowulf.nih.gov) and DNA panels, samples, and clinical data from the National Institute of NINDS Human Genetics Resource Center DNA and Cell Line Repository. The people who contributed samples are acknowledged in the descriptions of every panel on the repository website (http://ccr.coriell.org/Sections/Collections/NINDS/?SsId=10).
Funding/Support: This work was supported by the intramural programmes of the National Institute on Aging, the NINDS, and the National Institute of Mental Health, as well as by grants from the ALS Association and the Packard Center for ALS Research at Johns Hopkins. This work was also supported by the Intramural Research Program of the National Institute on Aging (project Z01 AG000949-02), the NINDS, Istituto Superiore di Sanita (grant 2005–10 to Dr Ferruci), PF A15 Regione Piemonte (to Dr Restagno), and the Medical Research Council.
Footnotes
Conflict of Interest Disclosures: Drs Singleton, Tienari, and Traynor have a patent pending on the clinical testing and therapeutic intervention for the hexanucleotide repeat expansion of C9orf72.
Correction: This article was corrected on July 16, 2014, for a misspelled word in the Main Outcomes and Measures section of the abstract, on August 22, 2014, for incorrect information in the caption to Figure 1 and in Tables 2 and 4, and on September 8, 2014, for typographical errors.
Role of the Sponsor: The funding agencies had no role in the design and conduct of the study; collection, management, analysis, and interpretation of the data; preparation, review, or approval of the manuscript; and decision to submit the manuscript for publication.
References
- 1.Chiò A, Mora G, Calvo A, Mazzini L, Bottacchi E, Mutani R PARALS. Epidemiology of ALS in Italy: a 10-year prospective population-based study. Neurology. 2009;72(8):725–731. doi: 10.1212/01.wnl.0000343008.26874.d1. [DOI] [PubMed] [Google Scholar]
- 2.Johnson L, Miller JW, Gkazi AS, et al. Screening for OPTN mutations in a cohort of British amyotrophic lateral sclerosis patients. Neurobiol Aging. 2012;33(12):2948.e15–2948.17. doi: 10.1016/j.neurobiolaging.2012.06.023. [DOI] [PubMed] [Google Scholar]
- 3.Al-Chalabi A, Fang F, Hanby MF, et al. An estimate of amyotrophic lateral sclerosis heritability using twin data. J Neurol Neurosurg Psychiatry. 2010;81(12):1324–1326. doi: 10.1136/jnnp.2010.207464. [DOI] [PMC free article] [PubMed] [Google Scholar]
- 4.Chiò A, Logroscino G, Traynor BJ, et al. Global epidemiology of amyotrophic lateral sclerosis: a systematic review of the published literature. Neuroepidemiology. 2013;41(2):118–130. doi: 10.1159/000351153. [DOI] [PMC free article] [PubMed] [Google Scholar]
- 5.Fang F, Kamel F, Lichtenstein P, et al. Familial aggregation of amyotrophic lateral sclerosis. Ann Neurol. 2009;66(1):94–99. doi: 10.1002/ana.21580. [DOI] [PMC free article] [PubMed] [Google Scholar]
- 6.Renton AE, Majounie E, Waite A, et al. ITALSGEN Consortium. A hexanucleotide repeat expansion in C9ORF72 is the cause of chromosome 9p21-linked ALS-FTD. Neuron. 2011;72(2):257–268. doi: 10.1016/j.neuron.2011.09.010. [DOI] [PMC free article] [PubMed] [Google Scholar]
- 7.Schymick JC, Talbot K, Traynor BJ. Genetics of sporadic amyotrophic lateral sclerosis. Hum Mol Genet. 2007;16(R2):R233–R242. doi: 10.1093/hmg/ddm215. [DOI] [PubMed] [Google Scholar]
- 8.DeJesus-Hernandez M, Mackenzie IR, Boeve BF, et al. Expanded GGGGCC hexanucleotide repeat in noncoding region of C9ORF72 causes chromosome 9p-linked FTD and ALS. Neuron. 2011;72(2):245–256. doi: 10.1016/j.neuron.2011.09.011. [DOI] [PMC free article] [PubMed] [Google Scholar]
- 9.Chiò A, Schymick JC, Restagno G, et al. A two-stage genome-wide association study of sporadic amyotrophic lateral sclerosis. Hum Mol Genet. 2009;18(8):1524–1532. doi: 10.1093/hmg/ddp059. [DOI] [PMC free article] [PubMed] [Google Scholar]
- 10.Landers JE, Melki J, Meininger V, et al. Reduced expression of the Kinesin-Associated Protein 3 (KIFAP3) gene increases survival in sporadic amyotrophic lateral sclerosis. Proc Natl Acad Sci U S A. 2009;106(22):9004–9009. doi: 10.1073/pnas.0812937106. [DOI] [PMC free article] [PubMed] [Google Scholar]
- 11.Bettens K, Brouwers N, Van Miegroet H, et al. Follow-up study of susceptibility loci for Alzheimer’s disease and onset age identified by genome-wide association. J Alzheimers Dis. 2010;19(4):1169–1175. doi: 10.3233/JAD-2010-1310. [DOI] [PubMed] [Google Scholar]
- 12.Cronin S, Berger S, Ding J, et al. A genome-wide association study of sporadic ALS in a homogenous Irish population. Hum Mol Genet. 2008;17(5):768–774. doi: 10.1093/hmg/ddm361. [DOI] [PubMed] [Google Scholar]
- 13.van Es MA, Van Vught PW, Blauw HM, et al. ITPR2 as a susceptibility gene in sporadic amyotrophic lateral sclerosis: a genome-wide association study. Lancet Neurol. 2007;6(10):869–877. doi: 10.1016/S1474-4422(07)70222-3. [DOI] [PubMed] [Google Scholar]
- 14.Laaksovirta H, Peuralinna T, Schymick JC, et al. Chromosome 9p21 in amyotrophic lateral sclerosis in Finland: a genome-wide association study. Lancet Neurol. 2010;9(10):978–985. doi: 10.1016/S1474-4422(10)70184-8. [DOI] [PMC free article] [PubMed] [Google Scholar]
- 15.Wingo TS, Cutler DJ, Yarab N, Kelly CM, Glass JD. The heritability of amyotrophic lateral sclerosis in a clinically ascertained United States research registry. PLoS One. 2011;6(11):e27985. doi: 10.1371/journal.pone.0027985. [DOI] [PMC free article] [PubMed] [Google Scholar]
- 16.Yang J, Benyamin B, McEvoy BP, et al. Common SNPs explain a large proportion of the heritability for human height. Nat Genet. 2010;42(7):565–569. doi: 10.1038/ng.608. [DOI] [PMC free article] [PubMed] [Google Scholar]
- 17.Yang J, Manolio TA, Pasquale LR, et al. Genome partitioning of genetic variation for complex traits using common SNPs. Nat Genet. 2011;43(6):519–525. doi: 10.1038/ng.823. [DOI] [PMC free article] [PubMed] [Google Scholar]
- 18.Yang J, Lee SH, Goddard ME, Visscher PM. Genome-wide complex trait analysis (GCTA): methods, data analyses, and interpretations. Methods Mol Biol. 2013;1019:215–236. doi: 10.1007/978-1-62703-447-0_9. [DOI] [PubMed] [Google Scholar]
- 19.Fogh I, Ratti A, Gellera C, et al. SLAGEN Consortium and Collaborators; ITALSGEN Consortium. A genome-wide association meta-analysis identifies a novel locus at 17q11.2 associated with sporadic amyotrophic lateral sclerosis. Hum Mol Genet. 2014;23(8):2220–2231. doi: 10.1093/hmg/ddt587. [DOI] [PMC free article] [PubMed] [Google Scholar]
- 20.Yang J, Lee SH, Goddard ME, Visscher PM. GCTA: a tool for genome-wide complex trait analysis. Am J Hum Genet. 2011;88(1):76–82. doi: 10.1016/j.ajhg.2010.11.011. [DOI] [PMC free article] [PubMed] [Google Scholar]
- 21.Schymick JC, Scholz SW, Fung HC, et al. Genome-wide genotyping in amyotrophic lateral sclerosis and neurologically normal controls: first stage analysis and public release of data. Lancet Neurol. 2007;6(4):322–328. doi: 10.1016/S1474-4422(07)70037-6. [DOI] [PubMed] [Google Scholar]
- 22.Traynor BJ, Nalls M, Lai SL, et al. Kinesin-associated protein 3 (KIFAP3) has no effect on survival in a population-based cohort of ALS patients. Proc Natl Acad Sci U S A. 2010;107(27):12335–12338. doi: 10.1073/pnas.0914079107. [DOI] [PMC free article] [PubMed] [Google Scholar]
- 23.Purcell S, Neale B, Todd-Brown K, et al. PLINK: a tool set for whole-genome association and population-based linkage analyses. Am J Hum Genet. 2007;81(3):559–575. doi: 10.1086/519795. [DOI] [PMC free article] [PubMed] [Google Scholar]
- 24.Price AL, Patterson NJ, Plenge RM, Weinblatt ME, Shadick NA, Reich D. Principal components analysis corrects for stratification in genome-wide association studies. Nat Genet. 2006;38(8):904–909. doi: 10.1038/ng1847. [DOI] [PubMed] [Google Scholar]
- 25.Germain M, Saut N, Greliche N, et al. Genetics of venous thrombosis: insights from a new genome wide association study. PLoS ONE. 2011;6(9):e25581. doi: 10.1371/journal.pone.0025581. [DOI] [PMC free article] [PubMed] [Google Scholar]
- 26.Price AL, Zaitlen NA, Reich D, Patterson N. New approaches to population stratification in genome-wide association studies. Nat Rev Genet. 2010;11(7):459–463. doi: 10.1038/nrg2813. [DOI] [PMC free article] [PubMed] [Google Scholar]
- 27.de Bakker PIW, Ferreira MAR, Jia X, Neale BM, Raychaudhuri S, Voight BF. Practical aspects of imputation-driven meta-analysis of genome-wide association studies. Hum Mol Genet. 2008;17(R2):R122–R128. doi: 10.1093/hmg/ddn288. [DOI] [PMC free article] [PubMed] [Google Scholar]
- 28.Chiò A, Logroscino G, Hardiman O, et al. Eurals Consortium. Prognostic factors in ALS: A critical review. Amyotroph Lateral Scler. 2009;10(5–6):310–323. doi: 10.3109/17482960802566824. [DOI] [PMC free article] [PubMed] [Google Scholar]
- 29.Turner MR, Barnwell J, Al-Chalabi A, Eisen A. Young-onset amyotrophic lateral sclerosis: historical and other observations. Brain. 2012;135(pt 9):2883–2891. doi: 10.1093/brain/aws144. [DOI] [PubMed] [Google Scholar]
- 30.Turner MR, Wicks P, Brownstein CA, et al. Concordance between site of onset and limb dominance in amyotrophic lateral sclerosis. J Neurol Neurosurg Psychiatry. 2011;82(8):853–854. doi: 10.1136/jnnp.2010.208413. [DOI] [PubMed] [Google Scholar]
- 31.Byrne S, Jordan I, Elamin M, Hardiman O. Age at onset of amyotrophic lateral sclerosis is proportional to life expectancy. Amyotroph Lateral Scler Frontotemporal Degener. 2013;14(7–8):604–607. doi: 10.3109/21678421.2013.809122. [DOI] [PubMed] [Google Scholar]
- 32.Traynor BJ, Codd MB, Corr B, Forde C, Frost E, Hardiman O. Incidence and prevalence of ALS in Ireland, 1995–1997: a population-based study. Neurology. 1999;52(3):504–509. doi: 10.1212/wnl.52.3.504. [DOI] [PubMed] [Google Scholar]
- 33.Mitchell JD, Borasio GD. Amyotrophic lateral sclerosis. Lancet. 2007;369(9578):2031–2041. doi: 10.1016/S0140-6736(07)60944-1. [DOI] [PubMed] [Google Scholar]
- 34.Piemonte and Valle d’Aosta Register for Amyotrophic Lateral Sclerosis (PARALS) Incidence of ALS in Italy: evidence for a uniform frequency in Western countries. Neurology. 2001;56(2):239–244. doi: 10.1212/wnl.56.2.239. [DOI] [PubMed] [Google Scholar]
- 35.Logroscino G, Traynor BJ, Hardiman O, et al. EURALS . Incidence of amyotrophic lateral sclerosis in Europe. J Neurol Neurosurg Psychiatry. 2010;81(4):385–390. doi: 10.1136/jnnp.2009.183525. [DOI] [PMC free article] [PubMed] [Google Scholar]
- 36.McGuire V, Longstreth WT, Jr, Koepsell TD, van Belle G. Incidence of amyotrophic lateral sclerosis in three counties in western Washington state. Neurology. 1996;47(2):571–573. doi: 10.1212/wnl.47.2.571. [DOI] [PubMed] [Google Scholar]
- 37.Higgins JPT, Thompson SG, Deeks JJ, Altman DG. Measuring inconsistency in meta-analyses. BMJ. 2003;327(7414):557–560. doi: 10.1136/bmj.327.7414.557. [DOI] [PMC free article] [PubMed] [Google Scholar]
- 38.Johnson JO, Mandrioli J, Benatar M, et al. ITALSGEN Consortium. Exome sequencing reveals VCP mutations as a cause of familial ALS. Neuron. 2010;68(5):857–864. doi: 10.1016/j.neuron.2010.11.036. [DOI] [PMC free article] [PubMed] [Google Scholar]
- 39.Do CB, Tung JY, Dorfman E, et al. Web-based genome-wide association study identifies two novel loci and a substantial genetic component for Parkinson’s disease. PLoS Genet. 2011;7(6):e1002141. doi: 10.1371/journal.pgen.1002141. [DOI] [PMC free article] [PubMed] [Google Scholar]
- 40.Zheng JS, Arnett DK, Lee YC, et al. Genome-wide contribution of genotype by environment interaction to variation of diabetes-related traits. PLoS ONE. 2013;8(10):e77442. doi: 10.1371/journal.pone.0077442. [DOI] [PMC free article] [PubMed] [Google Scholar]
- 41.Calvo A, Moglia C, Canosa A, et al. A de novo nonsense mutation of the FUS gene in an apparently familial amyotrophic lateral sclerosis case. Neurobiol Aging. 2014;35(6):1513.e7–1513.e11. doi: 10.1016/j.neurobiolaging.2013.12.028. [DOI] [PMC free article] [PubMed] [Google Scholar]
- 42.Kasperaviciute D, Weale ME, Shianna KV, et al. Large-scale pathways-based association study in amyotrophic lateral sclerosis. Brain. 2007;130(pt 9):2292–2301. doi: 10.1093/brain/awm055. [DOI] [PubMed] [Google Scholar]
- 43.Shatunov A, Mok K, Newhouse S, et al. Chromosome 9p21 in sporadic amyotrophic lateral sclerosis in the UK and seven other countries: a genome-wide association study. Lancet Neurol. 2010;9(10):986–994. doi: 10.1016/S1474-4422(10)70197-6. [DOI] [PMC free article] [PubMed] [Google Scholar]
- 44.Conforti FL, Spataro R, Sproviero W, et al. Ataxin-1 and ataxin-2 intermediate-length PolyQ expansions in amyotrophic lateral sclerosis. Neurology. 2012;79(24):2315–2320. doi: 10.1212/WNL.0b013e318278b618. [DOI] [PubMed] [Google Scholar]
- 45.van Es MA, van Vught PWJ, Blauw HM, et al. Genetic variation in DPP6 is associated with susceptibility to amyotrophic lateral sclerosis. Nat Genet. 2008;40(1):29–31. doi: 10.1038/ng.2007.52. [DOI] [PubMed] [Google Scholar]
- 46.Deng M, Wei L, Zuo X, et al. Genome-wide association analyses in Han Chinese identify two new susceptibility loci for amyotrophic lateral sclerosis. Nat Genet. 2013;45(6):697–700. doi: 10.1038/ng.2627. [DOI] [PubMed] [Google Scholar]
- 47.Alexander MD, Traynor BJ, Miller N, et al. “True” sporadic ALS associated with a novel SOD-1 mutation. Ann Neurol. 2002;52(5):680–683. doi: 10.1002/ana.10369. [DOI] [PubMed] [Google Scholar]
- 48.Chiò A, Calvo A, Moglia C, et al. A de novo missense mutation of the FUS gene in a “true” sporadic ALS case. Neurobiol Aging. 2011;32(3):553.e23–553.e26. doi: 10.1016/j.neurobiolaging.2010.05.016. [DOI] [PMC free article] [PubMed] [Google Scholar]
- 49.Chesi A, Staahl BT, Jovičić A, et al. Exome sequencing to identify de novo mutations in sporadic ALS trios. Nat Neurosci. 2013;16(7):851–855. doi: 10.1038/nn.3412. [DOI] [PMC free article] [PubMed] [Google Scholar]
Associated Data
This section collects any data citations, data availability statements, or supplementary materials included in this article.