Abstract
Background and Objective
Ovarian cancer has an extremely high mortality rate resulting from poor understanding of the disease. In order to aid understanding of disease etiology and progression, we identify the endogenous fluorophores present in a mouse model of ovarian cancer and describe changes in fluorophore abundance and distribution with age and disease.
Study Design/Materials and Methods
A mouse model of ovarian cancer was created by dosing with 4-vinylcyclohexene diepoxide, which induces follicular apoptosis (simulating menopause), and 7,12-dimethylbenz[a]anthracene, a known carcinogen. Imaging of ovarian tissue was completed ex vivo with a multiphoton microscope using excitation wavelength of 780 nm and emission collection from 405 to 505 nm. Two-photon excited fluorescence images and corresponding histologic sections with selective stains were used to identify endogenous fluorophores.
Results
The majority of collected fluorescence emission was attributed to NADH and lipofuscin, with additional contributions from collagen and elastin. Dim cellular fluorescence from NADH did not show observable changes with age. Changes in ovarian morphology with disease development frequently caused increased fluorescence contributions from collagen and adipose tissue-associated NADH. Lipofuscin fluorescence was much brighter than NADH fluorescence and increased as a function of both age and disease.
Conclusions
Our finding of NADH fluorescence patterns similar to that seen previously in human ovary, combined with the observation of lipofuscin accumulation with age and disease also seen in human organs, suggests that the findings from this model may be relevant to human ovarian disease. Increased lipofuscin fluorescence might be used as an indicator of disease in the ovary and this finding warrants further study.
Keywords: aging, carcinoma, lipofuscin, lipoprotein, multiphoton, microscopy, NADH
INTRODUCTION
Ovarian cancer is a devastating disease, with more than 225,000 new cases diagnosed and over 140,000 deaths each year worldwide [1]. When diagnosed at early stages the survival rate is high. However, due to lack of specific symptoms or an effective screening test, few women present with early stage disease. This situation leads to high mortality, as well as a lack of understanding of the development of ovarian cancer. The limited data available on women necessitates the use of an animal model to discover information about early cancerous changes. Discoveries in animal models can be translated to humans, to enable development of early diagnosis and treatment strategies.
A variety of ovarian tumor types can develop in women but adenocarcinoma is the most frequently occurring ovarian disease leading to death in women. For this reason, we use an animal model that develops adenocarcinoma, among other tumor types, through dosing with 4-vinylcyclohexene diepoxide (VCD) and 7,12-dimethylbenz[a]anthracene (DMBA). Dosing with VCD causes ovarian failure, simulating menopause. Creating ovarian failure in the mouse allows us to better approximate the hormonal environment in women who develop ovarian cancer, as they are most frequently peri- or post-menopausal. Further, by using an animal model that develops multiple tumor types, we can compare findings among tumors to identify if the changes observed are present among all diseased tissues or are specific to tumor cell origin or benign or malignant disease.
Optical imaging has shown great promise for detection of ovarian cancer and evaluation of disease progression, due to high resolution and sensitivity to tissue alterations. Fluorescence imaging and spectroscopy are particularly useful for early detection of disease because of the technique’s high sensitivity to endogenous or exogenous fluorophores, and flexibility in scale from wide field to microscopic. Tissue fluorophores absorb incident light and subsequently emit light, usually of a longer wavelength. The wavelengths and intensity of the remitted light are related to the quantity, type, and distribution of fluorophores present. Several types of fluorescence-based instruments have been used to study ovarian tissue, including point-sampling fluorescence spectroscopy [2-6], surface imaging fluorescence microscopy [7-8], depthresolved confocal microscopy [2,9,10], and two-photon excited fluorescence (TPEF) microscopy [11-13].
George et al. [5] used point fluorescence spectroscopy with excitation over 270–550 nm and emission collected over 290–700 nm to show differences in the endogenous fluorescence spectra between malignant and nonmalignant human ovarian tissue. Using laser-induced fluorescence spectroscopy, Hariri et al. [4] observed spectral differences in cyclic, acyclic and neoplastic rat ovaries. Adur et al. [12] used TPEF to visualize cells in fixed, H&E stained sections of ovarian epithelial cancer. Kirkpatrick et al. [13] used TPEF to study changes in cell metabolism with disease and demonstrated that normal low-risk human ovaries have a lower redox ratio (calculated from the intensity of wavelengths associated with the fluorescence emission of metabolic co-factors nicotinamide adenine dinucleotide [NADH] and flavin adenine dinucleotide [FAD]) than human ovaries with cancer.
TPEF has the advantage of high resolution, depth resolved imaging, with an imaging depth greater than confocal imaging. The greater depth of imaging is achieved by using near infrared short-pulsed light. The longer wavelengths penetrate deeper than ultraviolet or visible light, which are typically used in single photon techniques such as confocal microscopy and surface fluorescence imaging. Additionally, at near-infrared wavelengths there is minimal absorption and tissue damage. The short pulses of light and highly focused beams create a high instantaneous power density, resulting in a high probability of two photons being simultaneously absorbed by a fluorophore, followed by emission of one photon at a shorter wavelength than the incident light. The two-photon phenomenon is only probable at the focus of the beam, strongly suppressing out-of-focus signal and enabling deeper imaging.
TPEF allows for utilization of endogenous fluorescence, eliminating the possibility of toxicity or other side effects from exogenous contrast agents, and simplifying the imaging procedure. Endogenous fluorophores in the body include proteins containing aromatic amino acids (tryptophan, tyrosine, phenylalanine), metabolic co-factors such as NADH and FAD, structural proteins such as collagen and elastin, and a variety of other molecules including vitamins and lipopigments [14,15].
In this study, we utilize TPEF for high resolution, deep visualization of endogenous fluorescence in the mouse ovary. Acquiring better understanding of the relationship between fluorescence and tumor development in this mouse model may lead to improved methods for diagnosis and treatment of ovarian cancer in women. We hope to validate the usefulness of TPEF imaging for identifying disease related changes so that we may pursue in vivo imaging studies for disease detection in the future. We identify endogenous fluorophores present in the mouse ovary, and describe changes that occur with age and disease. Further, we discuss the potential translatability of these findings to women.
METHODS
Animals
All experiments were performed per NIH guidelines, and protocols were approved by the University of Arizona Institutional Animal Care and Use Committee. Female B6C3F1 mice (age 21 days, Harlan, Dublin, VA) were housed in microisolators and allowed a 7-day acclimation period before initiating the experiment. Fifty-two 28-dayold mice received intraperitoneal (IP) injections of 4-vinylcyclohexene diepoxide, 160 mg/kg/day in sesame oil, daily for 20 days, or received sesame oil vehicle only as control. Four months after the end of IP dosing, animals received a single injection of 7,12-dimethylbenz[a]anthracene, 50 μg in 5-μl sesame oil, or 5-μl sesame oil vehicle for controls, under the bursa of the right ovary. Animals were anesthetized by IP injection of 2% Avertin at 0.015 ml per gram body weight and sterile surgical method was used to expose the ovarian bursa for sub-bursal injection. The left ovary was not injected. Therefore, there were four experimental groups: VCD and DMBA exposed (VCD/DMBA), VCD and vehicle injection (CON/VCD), DMBA and vehicle injection (CON/DMBA), or vehicle injection only (CON/CON). Mice were sacrificed at 5, 7, or 9 months after sub-bursal injection with DMBA (age 11, 13, or 15 months, respectively). Ovaries were harvested immediately after euthanasia, rinsed with saline and were imaged using TPEF within 1 hour of excision.
TPEF Imaging
Imaging was performed with a single-beam multiphoton microscope (TrimScope, LaVision BioTec, Bielefeld, Germany) using a Titanium:Sapphire laser light source (Chameleon Ultra2, Coherent, UK) that was coupled to the scanner unit, with a pulse width of 120 femtoseconds at the sample. The laser intensity was adjusted with an electro-optical modulator (EOM 350-80; Conoptics, Danbury, CT). A water-immersion, 20× magnification, 0.95 NA objective (Olympus, Center Valley, PA) was used for imaging. However, rather than water, a more viscous surgical lubricant (Surgilube) was used for index matching with the objective. Simultaneous SHG and TPEF image data were recorded through non-descanning reverse detection using triple detector port equipped with Galium Arsenide (H7422A-40, Hamamatsu, Hamamatsu City, Japan) sensors. For this study, only the TPEF image data were analyzed. The excitation wavelength was set to 780 nm, and a bandpass filter HQ450/100M-2p-25 (Chroma, Bellows Falls, VT) and a dichroic mirror 505dcxr (Chroma) were used to collect light from TPEF. Power on the sample was set to 20 mW. Pixel dwell time was 4.61 microseconds and three-line summing was used. Images were taken at 10 μm depth increments from the surface of the tissue to 60–200 μm depth, resulting in 6–20 images per ovarian tissue specimen. Thus, TPEF imaging was completed in less than three minutes per specimen. All images had a 400 μm × 400 μm field of view and contained 993 × 993 or 1,021 × 1,021 pixels with 14-bit gray scale resolution.
Histology and Pathological Evaluation
After imaging, ovaries were fixed in Bouin’s solution for 2–4 hours, transferred to 70% ethanol, dehydrated, embedded in paraffin blocks, and sectioned at 5 μm thickness. Orientation was carefully maintained on filter paper so that the imaged region of the ovary was known. Multiple sections were mounted on glass microscope slides and covered with a layer of paraffin for preservation until sections were used for various staining protocols. For visual analysis and display purposes, great care was taken to obtain histological sections from similar locations on the same specimen to use for comparison of TPEF images and stained sections. However, histologic specimens were taken perpendicular to the imaged plane; thus, exact corresponding sections were not possible.
Every 20th section was stained with hematoxylin and eosin for standard structure-based pathology evaluation. Any ovary with suspected tumor had two to three additional sections immunostained with cytokeratin (anticytokeratin 18 antibody [E431-1] & rabbit polyclonal to wide spectrum cytokeratin, Abcam Inc., Cambridge, MA), per the manufacturer’s recommended protocol, to determine if the tumor was of epithelial origin.
All histologic specimens were evaluated by a pathologist and a gynecologic oncologist. The specimens were diagnosed per pathologic findings into the following six categories: normal, DMBA-effect, tubular adenoma, tubular adenoma with areas of focal dysplasia, sex cord-gonadal stromal tumor, or adenocarcinoma. Normal ovaries were those that contained only healthy tissue or changes consistent with a normal aging process. DMBA-effect was a benign abnormality, caused by DMBA exposure, which was characterized by epithelial cell proliferation, degenerating follicles, degenerating corpora lutea, and highly active steroidogenic cells. Tubular adenoma was a benign epithelial tumor of glandular origin characterized by cells organized in tubules. The sex cord-gonadal stromal tumors consisted of a granulosa cell tumor and a sertoli leydig tumor, which are both rare tumors in humans. Adenocarcinoma is a malignancy arising from the epithelial cells of the ovary and is the most common form of ovarian malignancy in humans.
Additional sections were stained and imaged to elucidate the origin of fluorescence signal. Previous studies have shown lipopigment fluorescence located in unstained cells throughout many tissues, including the ovarian stroma [16-18]. Furthermore, after staining with Sudan Black B, lipopigment fluorescence is blocked [19,20]. Therefore, randomly selected unstained specimens from normal and other diagnoses at each time point were imaged with a fluorescence microscope, stained with Sudan Black B and then re-imaged with the fluorescence microscope.
For Sudan Black B staining, sections were dewaxed, rehydrated, stained with Sudan Black B (Sigma–Aldrich, St. Louis, MO) overnight at room temperature, differentiated in 70% alcohol to remove background stain and counterstained with methyl green (Sigma–Aldrich), dehydrated and mounted in Permount (Fisher Scientific, Pittsburgh, PA). Sudan Black B is a dye that stains lipids nonspecifically but dissolves readily in phospholipids. Under this staining protocol, positive staining for lipid, neutral fat, phospholipid, or lipopigment is black, nuclei stain green, and red blood cells stain black.
Lipofuscins have been known to excite from the UV to the red and emit from the blue to the red [16-18,21]. It was previously shown that lipofuscin was the dominant signal in normal retinal pigment epithelium (RPE) when excited with 633, 568, and 488 nm light [21]. When excitation wavelengths less than 488 were used, strong autofluorescence was seen from other fluorophores in the RPE [21]. In order to see lipofuscin as the dominant signal we chose to use green light for excitation. Fluorescence imaging was completed with an Olympus IX70 fluorescence microscope. The light source was a mercury arc lamp with a 540/25 nm bandpass excitation filter, and a 605/55 nm bandpass emission filter was used for collection. Integration time was adjusted to obtain a measurable signal and Sudan Black B stained sections had an integration time twice that of unstained sections.
To further narrow the possible lipids resulting in fluorescence and verify the presence of the age-related lipopigment, lipofuscin, additional sections from each adenocarcinoma specimen and randomly selected specimens from normal and other diagnoses at each time point were stained with carbol fuchsin according to modified Zeihl–Neelsen technique. This method has been used to stain acid-fast lipofuscin in many tissues including the ovary [17,18,22]. Sections were dewaxed, rehydrated, stained with carbol fuchsin (Sigma–Aldrich) overnight at room temperature, differentiated in acid alcohol (1% HCL in 70% ethanol) to remove background staining, counterstained with 0.25% methylene blue (Sigma–Aldrich) in 1% acetic acid, dehydrated and mounted in Permount (Fisher Scientific). Under this staining protocol, positive staining for lipofuscin is deep magenta/purple, nuclei stain blue, and red blood cells stain pink. To confirm co-localization of bright fluorescence with lipofuscin, a section of normal tissue was imaged as described above (for Sudan Black B stained sections) with an Olympus IX70 fluorescence microscope before and after carbol fuchsin staining.
Each adenocarcinoma specimen and randomly selected normal specimens from each time point were also immunostained for F4/80 antibody to ovarian macrophages. Sections were dewaxed and rehydrated, endogenous peroxidase activity was blocked by immersion in 0.3% hydrogen peroxide in methanol for 15 minutes, then sections were rinsed. Antigen retrieval was performed by immersing sections in 10 mM sodium citrate buffer (pH 6) at 95–100°C for 20 minutes. Sections were rinsed and blocked for non-specific binding with 10% goat serum for 15 minutes at room temperature and rinsed again. Sections were incubated overnight at 48C in primary antibody, rat anti-mouse-F4/80 (Abd Serotec, Raleigh, NC). Sections were rinsed and incubated 60 minutes at room temperature with secondary antibody, goat anti-rat IgG biotinylated (Vector Labs, Burlingame, CA) and rinsed again. Sections were incubated with streptavidin (Dako, Carpinteria, CA) 10 minutes at room temperature, rinsed and stained with DAB (Dako) for approximately 1 minute. Sections were rinsed, counter-stained with hematoxylin, dehydrated, and mounted. Under this staining protocol, cell nuclei are purple and positive staining for F4/80 macrophage is dark brown.
Quantitative Image Analysis
Prior to analysis, each image was resized and converted to binary in ImageJ (NIH). TPEF images were resized from 993 × 993 pixels or 1,021 × 1,021 pixels to 1,024 × 1,024 pixels using bilinear interpolation. Only images with signal in at least 25% of the field of view (by eye) were analyzed. Images were converted to binary by a blinded observer using the “MaxEntropy” threshold, such that the brightest regions were made white and all other pixels were made black. The max entropy threshold uses probability distributions of the foreground and background gray levels to determine the optimal threshold [23].
Analysis of the binary images was performed in Matlab (Mathworks). Each region of white pixels was labeled using connected component labeling with 8-connectivity. Visual inspection of these images showed bright fluorescence occurring either as small punctate dots or as large (cellular or multi-cellular-sized), round-to-oval-shaped blobs. Further inspection revealed copious punctate fluorescence 6 or less pixels in diameter or less, and another, less numerous, group of fluorescent regions greater than 6 pixels in diameter. We translated the diameter to an area of 62 pixels, or 36 pixels (corresponding to approximately 5.5 μm2 area). Analysis of the connectedcomponent area-count histograms confirmed this visual observation. Based on bimodality of the connectedcomponent area-count histogram, white regions were separated into two groups: those containing 36-pixel-area or less and those containing greater than 36-pixel-area. For each image, three parameters were recorded: the number of regions less than or equal to 36-pixel-area and both number of regions greater than 36-pixel-area and the average area (in pixels) of regions with greater than 36-pixel-area.
Statistics
Statistical analysis for TPEF fluorescent regions was completed using a linear mixed effects model with random intercepts and a sandwich standard error estimator for each diagnosis in order to account for both within animal variation and between animal variations. In addition, Tukey–Kramer P-value adjustment was done to account for multiple comparisons. Differences were considered statistically significant for P < 0.05.
RESULTS
Animals
A total of 88 specimens from 52 animals were imaged. Sixteen specimens were not imaged due to unexpected death of the animal, instrument malfunction or user error. Of the 88 specimens imaged, 57 specimens were included in the analysis. The remaining specimens were not included in the analysis because they did not contain ovary or the ovary was entirely covered by fat and/or connective tissue in the area imaged, as confirmed by histology. Five hundred seventy-four images from the 57 specimens were included in the TPEF analysis. This number included 269 normal, 57 carcinoma, 95 DMBA effect, 63 tubular adenoma, 48 tubular adenoma with dysplasia, and 42 sex-cord tumor images.
All CON/CON animals imaged had normal ovaries. CON/DMBA dosed animals were normal or developed DMBA effect or granulosa cell tumor in the non-DMBA dosed ovary. In the DMBA-dosed ovary, CON/DMBA animals developed DMBA effect. All CON/VCD animals developed tubular adenomas (with or without dysplasia). All VCD/DMBA animals developed adenocarcinoma in the DMBA-dosed ovary and tubular adenoma (with or without dysplasia) or sex cord-gonadal stromal tumor in the non-DMBA dosed ovary [24]. The number of ovaries and images with each diagnosis at each age are shown in Table 1.
TABLE 1.
Number of Ovaries and Images with Each Diagnosis at Each Age
| Normal | DMBA effect | Tubular adenoma | Tubular adenoma w/dysplasia | Sex-cord tumor | Carcinoma | |
|---|---|---|---|---|---|---|
| 11 months | 5 (70) | 4 (25) | 3 (12) | 0 (0) | 0 (0) | 0 (0) |
| 13 months | 11 (130) | 4 (40) | 4 (30) | 4 (20) | 2 (42) | 3 (43) |
| 15 months | 6 (69) | 3 (30) | 3 (21) | 4 (28) | 0 (0) | 1 (14) |
| All ages combined | 22 (269) | 11 (95) | 10 (63) | 8 (48) | 2 (42) | 4 (57) |
Number of images shown in parentheses.
Origin of TPEF
A number of endogenous fluorophores, including NADH, FAD, collagen, elastin, and lipoproteins, experience two-photon excitation using laser wavelengths near 780 nm [12,13,25-27]. Furthermore, many of these fluorophores have emission in the range of the TPEF light collected (405–505 nm). NADH and FAD, cofactors used in metabolic processes in the mitochondria, have peak emission in the range of 440–460 and 515–520 nm, respectively [14,15,28]. It has been noted that NADH fluorescence emission maximum is shifted to 520 nm in adipose tissue [28]. Collagen and elastin are present in blood vessels and collagen is present throughout the tissue, providing support to the structure of the ovary. Both fluorophores have peak emission at 390–400 nm [14,15,28]. Collagen and elastin are easily distinguished from other fluorophores in the ovary due to their fibrillar structure [25]. Lipopigments associated with lipid oxidation, such as ceroid and lipofuscin, are generally found as cytoplasmic granules and have broad emission, including peaks in the 430–460 and 540–640 nm range [14]. Based on excitation and emission wavelengths, as well as relative abundance of fluorophores in the ovary, we expect the majority of our collected signal to originate from NADH and lipopigments.
TPEF images in this study show a broad range of fluorescence intensities, including dim and bright levels of fluorescence with different morphologies. The origin of the fluorescence signal was determined based on comparison of TPEF images with corresponding histology. Dim fluorescence was observed in regions corresponding to the cytoplasm of cells seen in H&E stained histological sections. The dim fluorescence is most easily seen in luteal cells in corpora lutea and granulosa cells surrounding developing follicles. In these cells, the intracellular fluorescence surrounds a dark spot with minimal fluorescence intensity, corresponding to cell nuclei in the H&E stained section (Fig. 1). Dim cellular fluorescence corresponds to NADH [13,25-27]. Similar dim fluorescence is seen in adipose cells, which are visible in some adenocarcinoma specimens (Fig. 2). The fluorescence in adipose cells is anticipated to be mainly from NADH [26,28].
Fig. 1.
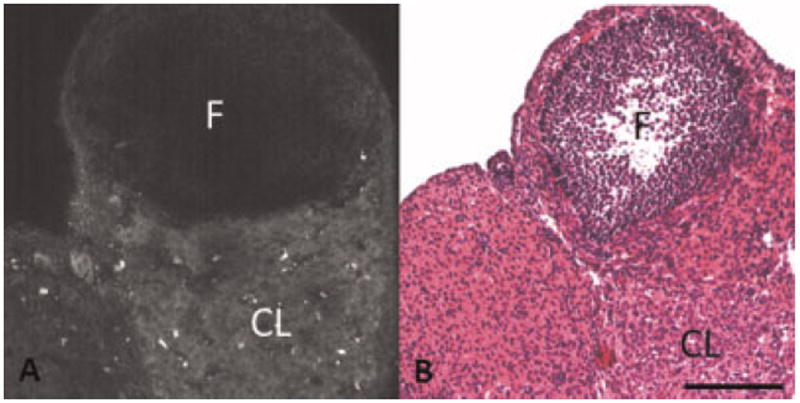
A: TPEF image showing dim fluorescence from a corpus luteum and granulosa cells surrounding a follicle in normal ovary. B: H&E of normal ovary showing a corpus luteum and a follicle surrounded by granulosa cells. F, follicle; CL, corpus luteum. Scale bar equals 100 μm.
Fig. 2.
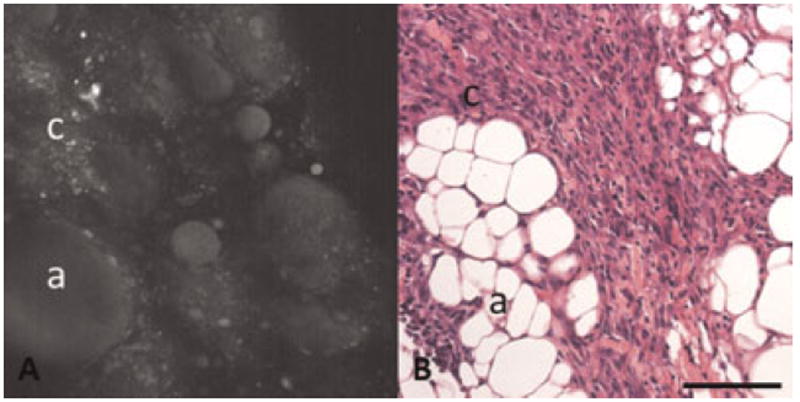
A: TPEF image showing dim fluorescence from adipose cells and carcinoma cells. B: H&E of carcinoma specimen with adipose cells and carcinoma cells. a, adipose cells; c, carcinoma cells. Scale bar equals 100 μm.
Additional dim fluorescence was seen in thin linear bands throughout the tissue. This morphology was frequently seen in TPEF images of carcinoma specimens. Corresponding H&E stained sections show an abundance of bands of collagenous connective tissue in the tumor. Therefore, this fluorescence is likely from collagen (Fig. 3). Similar linear fluorescence was also seen in ringlike structures in normal ovary. Comparison of these images to H&E shows that the ring-like structures correspond to collagen and elastin in blood vessels in the ovary (Fig. 4) [25].
Fig. 3.
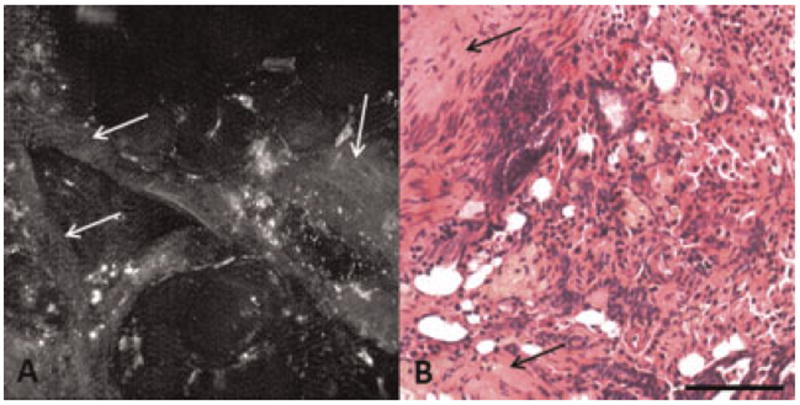
A: TPEF image showing dim linear bands of fluorescence in a carcinoma specimen. B: H&E showing collagen abundance in a carcinoma specimen. Arrow, collagen. Scale bar equals 100 μm.
Fig. 4.
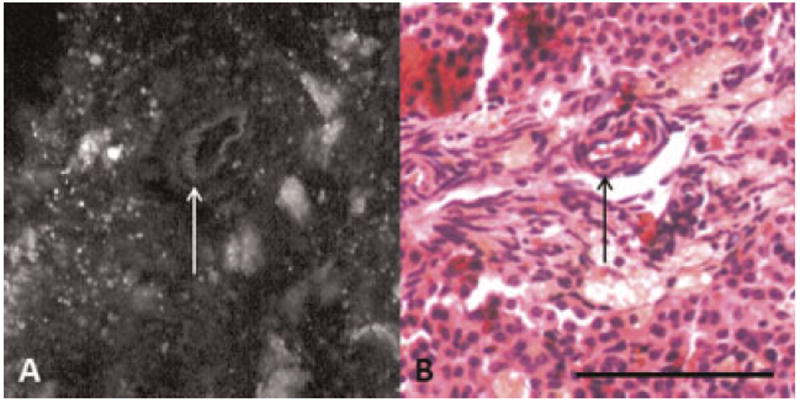
A: TPEF image showing collagen and elastin fluorescence from a blood vessel in a normal ovary. B: H&E showing blood vessels in normal ovary. Arrow, blood vessel. Scale bar equals 100 μm.
Isolated, bright punctate fluorescence, 1–3 μm in diameter, was seen throughout TPEF images of ovarian interstitial tissue in all diagnoses. However, the punctate material was not identifiable in H&E stained sections. Others have also noted some extremely bright punctate fluorescence in ovarian tissue [13,25] and have hypothesized that this fluorescence comes from fluorescent lipopigments such as lipofuscin. Further, similar bright fluorescence has been noted in cell culture and has been attributed to lipofuscin fluorescence through identification of its lysosomal localization [27].
In addition to the punctate fluorescence, some TPEF images show large regions (larger than 36-pixel area) with moderate-to-extremely bright fluorescence. Sometimes, these large fluorescent regions also contain brighter, punctate fluorescence. The bright fluorescence from the larger, cellular sized, regions appeared to correspond with the cytoplasm of large foamy cells, seen in the interstitial area of normal ovaries in H&E stained histological sections (Fig. 5). The interstitial cells containing the foamy material in H&E stained sections are varied in shape and size (5–20 μm in diameter). The cells appear to be macrophages, inactive interstitial cells (cells waiting to be recruited as luteal cells), or fibroblasts.
Fig. 5.
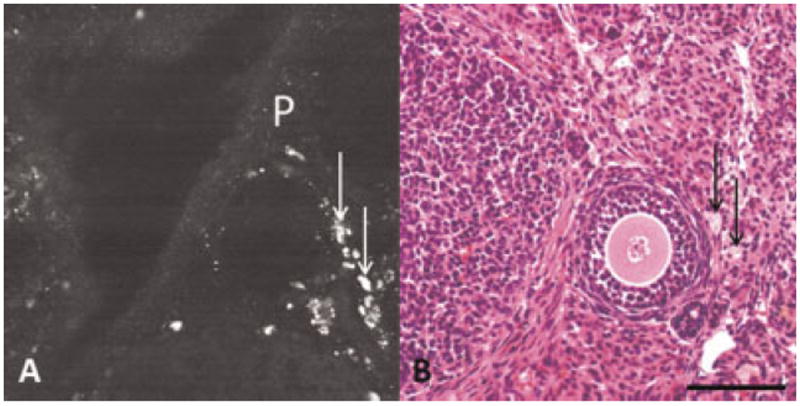
A: TPEF image showing bright punctate and bright cellular fluorescence in normal ovary. B: H&E showing foamy cells in normal ovary. P, punctate fluorescence; arrow, foamy cells. Scale bar equals 100 μm.
F4/80 immunostaining shows that some, but not all, of the foamy cells appearing in H&E stained sections are macrophages (Fig. 6). A large number of macrophages are seen in the interstitial tissue of normal ovary, corresponding to areas of bright fluorescence in TPEF images, and small foamy cells in H&E stained sections. The majority of the large foamy cells appearing in H&E stained sections of normal and carcinoma specimens do not stain positive as macrophages, and appear to be, instead, other ovarian interstitial cells.
Fig. 6.
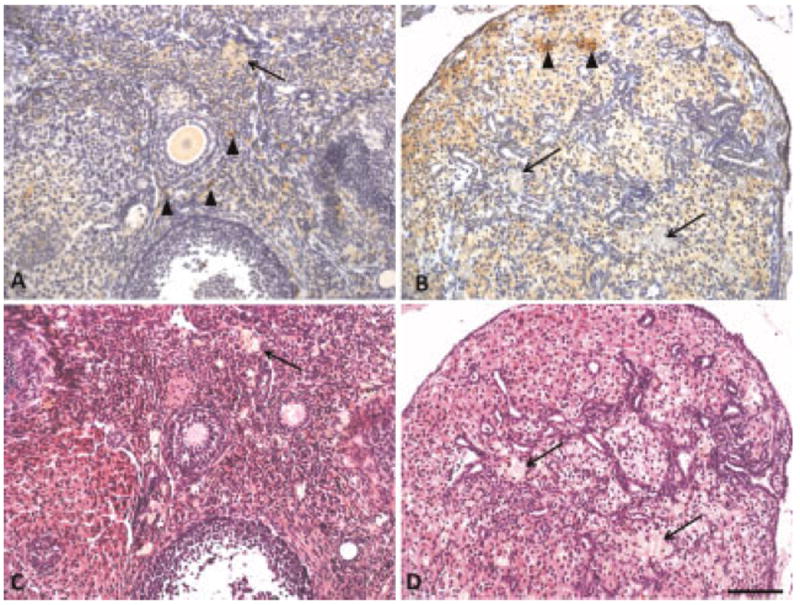
F4/80 positive macrophages stained brown in (A) normal ovary and (B) carcinoma. Corresponding H&E sections for (C) normal ovary and (D) carcinoma. Sections also contained foamy cells that are not macrophages. Arrow heads, macrophages; arrow, foamy cells that are not macrophages. Scale bar equals 100 μm.
Sudan Black B stained sections show positive lipid staining in small granules throughout the tissue, as well as positive lipid staining in the entire cytoplasm of some cells (Fig. 7B). The small granules seem to be the same size and distribution as the punctate fluorescence seen in TPEF images. The lipid-positive cells appear to be the same cells containing the foamy material in H&E stained sections. Further, staining with Sudan Black B provides great contrast, revealing lipid positive foamy cells in normal ovary that were difficult to see in H&E stained sections.
Fig. 7.
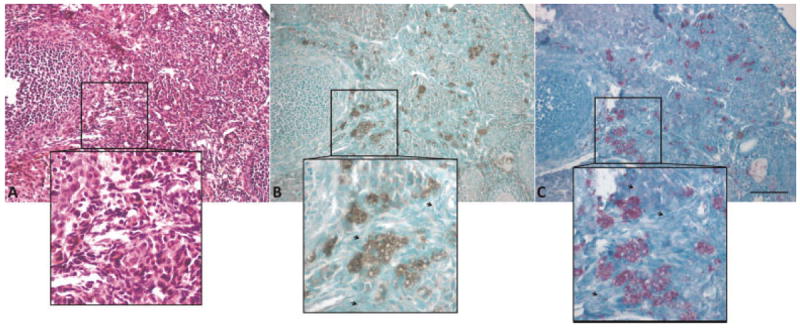
Normal ovary (A) Foamy appearing cells are present in H&E stained section (B) Lipid-filled cells and granules appear black in Sudan Black B stained section (C) lipofuscin appears purple in carbol fuchsin stained section. Squares show a zoomed in area to emphasize areas with many lipid-filled cells. Arrows point to granules. Scale bar equals 100 μm.
To further elucidate the content of the lipid material as lipofuscin, carbol fuchsin staining was performed. Carbol fuchsin stained sections revealed staining patterns consistent with Sudan Black staining. Positive staining for lipofuscin was located not only in small granules, but also throughout the cytoplasm in clusters of ovarian interstitial cells (Fig. 7C).
Fluorescence images of unstained normal ovary from the fluorescence microscope show dim cellular fluorescence from all cells, small punctate fluorescence throughout interstitial tissue, and bright cellular fluorescence from some clusters of interstitial cells (Fig. 8A). After staining with Sudan Black B, dim cellular fluorescence remains and all punctate and bright cellular fluorescence is blocked (Fig. 8C). This fluorescence imaging confirms that the foamy cells containing the fluorescent lipid material that stained with Sudan Black B are co-located with the bright fluorescent granules and foamy cells. In another section of normal ovary, fluorescence microscopy also shows small bright punctate fluorescence throughout tissue and clusters of brightly fluorescing cells (Fig. 9A). Similar to results from staining with Sudan Black B, after staining with carbol fuchsin the bright fluorescence is blocked, providing additional confirmation that the bright fluorescence is co-located with lipofuscin (Fig. 9C).
Fig. 8.

Fluorescence imaging shows co-localization of fluorescence and Sudan Black B stained lipid in normal ovary. A: unstained ovary section under green light, (B) ovary section stained with Sudan Black B (brightfield image), (C) Sudan Black B stained ovary section under green light. Scale bar equals 100 μm.
Fig. 9.

Fluorescence imaging shows co-localization of fluorescence and carbol fuchsin stained lipofuscin in normal ovary. A: unstained ovary section under green light, (B) ovary section stained with carbol fuchsin (brightfield image), (C) Carbol fuchsin stained ovary section under green light. Scale bar equals 100 μm.
Changes in TPEF with Age
Visual inspection of TPEF images of ovaries at three different ages (11, 13, and 15 months), did not reveal observable difference in the size, shape, or quantity of fluorescent regions associated with intracellular NADH, collagen, or blood vessel elastin. Visual examination of H&E stained histological sections also failed to reveal any observable differences in these tissue constituents. However, bright fluorescence associated with lipofuscin appeared to increase with age. With an increase in age, TPEF images of normal ovaries contained more small bright punctate fluorescent regions, as well as showed an increase in size of the large bright fluorescent regions (Fig. 10).
Fig. 10.
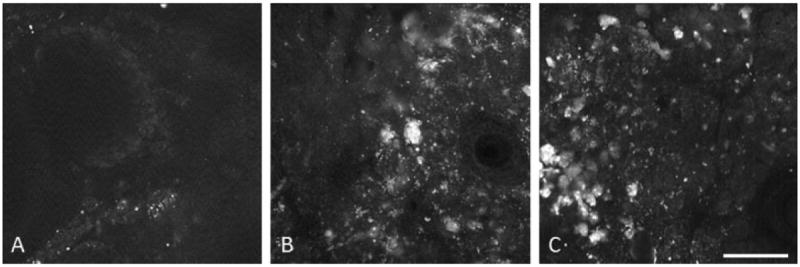
TPEF images of normal ovary showing increase in lipofuscin fluorescence with age. A: 11 months old, (B) 13 months old, and (C) 15 months old. Scale bar equals 100 μm.
Quantitative analysis of the TPEF images confirms that there is an increase in the number and size of brightly fluorescing regions with age. From 11 to 13 months of age there was a statistically significant increase in all three parameters tested: the number of regions less than or equal to 36-pixel-area (P < 0.0001), the number of regions greater than 36-pixel-area (P = 0.0319) and the size of regions greater than 36-pixel-area (P = 0.0123) (n [11 months] = 70, n [13 months] = 130). There was not a statistically significant change in any parameters from 13 to 15 months of age (n [13 months] = 130, n [15 months] = 69, P > 0.05; Fig. 11).
Fig. 11.
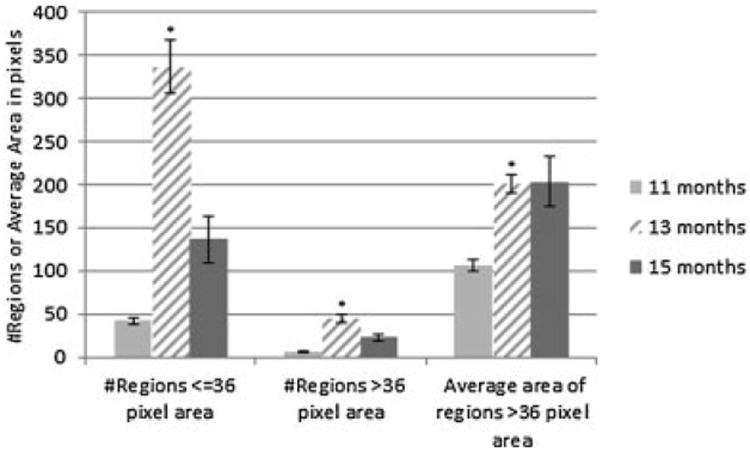
TPEF analysis results for normal ovary at each age. Bars indicate standard error of the mean. *Significant difference from previous age (P < 0.05).
Similar to findings from visual examination of TPEF images, visual examination of Sudan Black and carbol fuchsin stained sections of normal ovary reveal larger number and size of positively stained regions, indicating an increase in lipopigment accumulation with age (Fig. 12). At 11 months of age, the lipofuscin-filled cells are very small in size and number and there is some small punctate staining. In addition, at 11 months of age, the few lipofuscin-filled cells appear in small clusters. At 13 months of age, the cells containing lipofuscin appear larger in size and number than at 11 months. Further, the lipofuscin-filled cells are more widespread throughout the tissue. At 15 months of age, there are again more abundant and larger-sized lipofuscin-containing cells throughout the ovarian interstitial tissue.
Fig. 12.
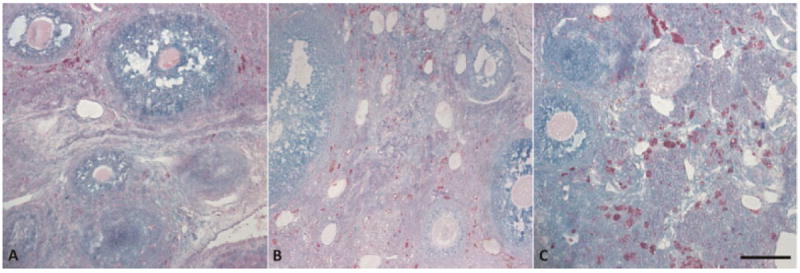
Lipofuscin (in red/purple) accumulation increases with age. Normal ovary at (A) 11 months, (B) 13 months, and (C) 15 months of age. Scale bar equals 100 μm.
Changes in TPEF with Disease
Changes in TPEF as a function of disease were primarily associated with observed changes in morphology. Most of the tumors contained fewer or no luteal or granulosa cells, reducing the contribution of fluorescence associated with NADH. In addition, carcinoma specimens frequently had abundance of adipose cells and bands of connective tissue throughout the tumor, changing the morphology of NADH fluorescence and increasing the contribution of fluorescence associated with collagen. Furthermore, in tumors, an abundance of bright fluorescence from lipofuscin frequently masked NADH fluorescence.
Visual inspection of TPEF images revealed an apparent increase in bright fluorescence in nearly all disease types. DMBA effect, tubular adenoma, tubular adenoma with dysplasia and carcinoma appeared to have larger size and quantity of bright fluorescent regions (Fig. 13). TA seemed to have the largest quantity of bright regions, with the regions dominating the entire field of view in some images. The sex-cord tumors appeared to contain the fewest bright regions of all tumors, with quantity of bright regions similar to normal tissue. TPEF images from each of the carcinoma specimens showed large variability in fluorescence morphology. Two carcinoma specimens appeared similar, with large clusters of bright regions. The other carcinoma specimens had fewer bright regions and included fluorescence from bands of collagen and NADH in adipose cells, as confirmed by histology.
Fig. 13.
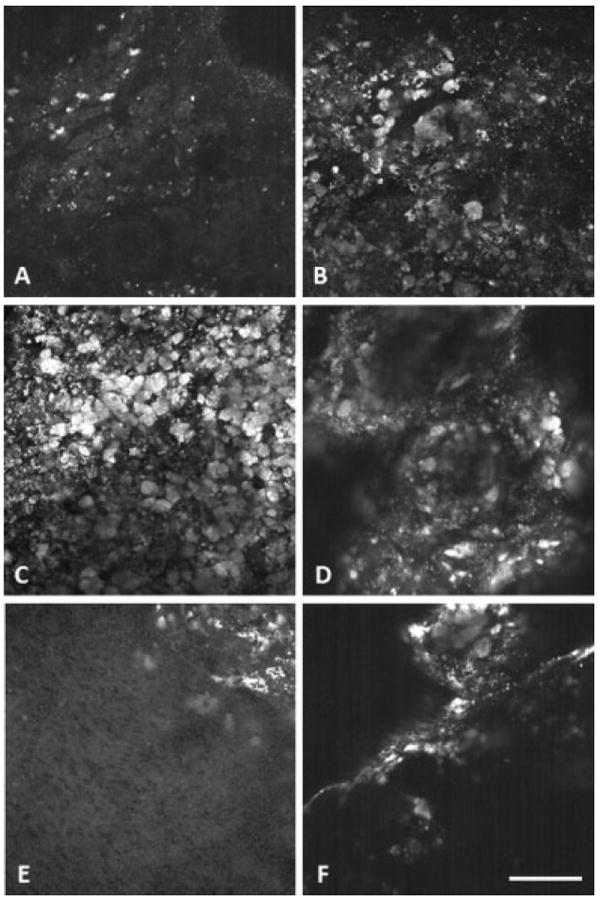
Representative aged-matched TPEF images for each diagnosis. A: Normal, (B) DMBA effect, (C) tubular adenoma, (D) tubular adenoma with dysplasia, (E) sex-cord tumor, and (F) carcinoma. Scale bar equals 100 μm.
Quantitative analysis of TPEF images, all ages combined for each diagnosis (n given in Table 1), confirmed a trend of larger and more numerous bright regions associated with disease (Fig. 14). The average number of bright regions less than or equal to 36-pixel-area was greater than normal for DMBA effect, and lower than normal for tubular adenoma with dysplasia, sex-cord tumor, and carcinoma, but the differences from normal were not significant (P > 0.05). The average number of bright regions greater than 36-pixel-area was greater than normal for DMBA effect, tubular adenoma, tubular adenoma with dysplasia and sex cord tumor, and less than normal for carcinoma, but again the differences from normal were not significant (P > 0.05). The average area of bright regions greater than 36-pixel-area was greater in all diseased tissue types as compared to normal, and this increase was statistically significant for tubular adenoma (P = 0.0002).
Fig. 14.
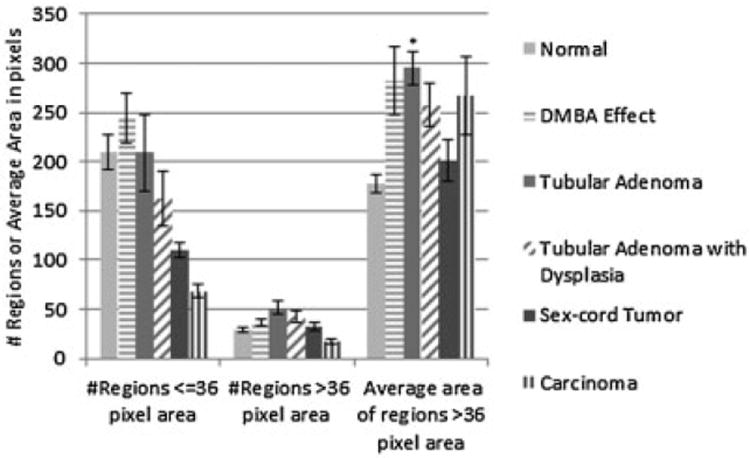
TPEF particle analysis results for each diagnosis. Bars indicate standard error of the mean. *Significant difference from normal (P = 0.0002).
Carbol fuchsin staining reveals lipofuscin morphology similar to the morphology of bright fluorescent regions seen in TPEF images. Further, examination of carbol fuchsin stained tissue sections supports the trend of increased lipofuscin accumulation with disease seen in the TPEF images (Fig. 15). DMBA effect, tubular adenoma, tubular adenoma with dysplasia and carcinoma all appeared to have larger lipofuscin containing cells than normal tissue. Furthermore, many of the cells appear to have much darker and denser staining than normal. The sex cord gonadal stromal tumors show few lipofuscin stained cells, in quantities similar to or less than normal. All diagnoses showed abundance of punctate lipofuscin staining throughout the tissue in varying quantities.
Fig. 15.
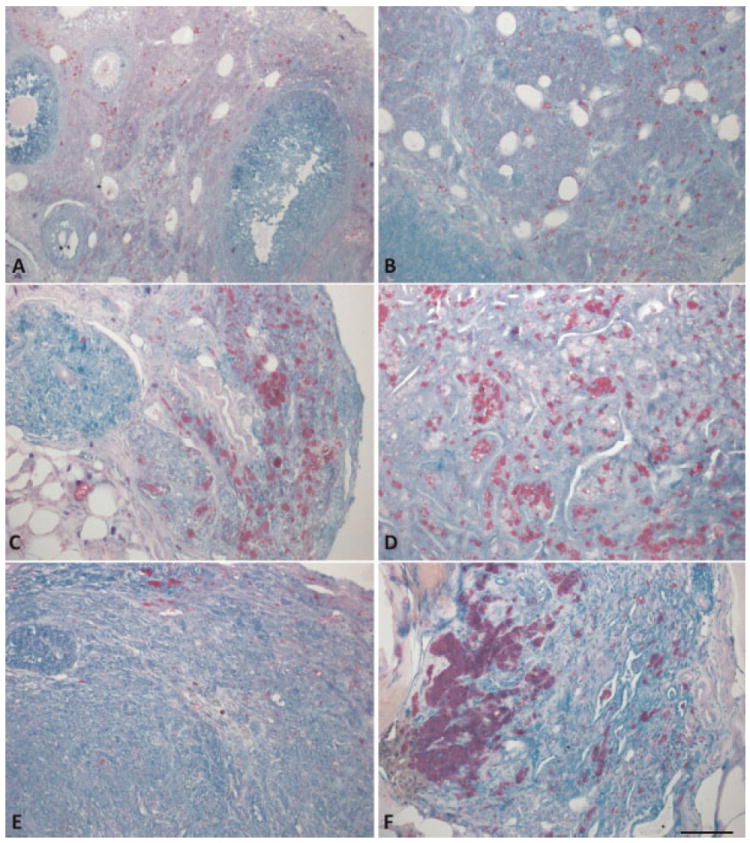
Lipofuscin (stained red/purple) accumulates in cells and granules throughout the tissue of each diagnosis. A: Normal, (B) DMBA effect, (C) tubular adenoma, (D) tubular adenoma with dysplasia, (E) sex-cord tumor, and (F) carcinoma. Scale bar equals 100 μm.
DISCUSSION
In this study, we have shown the origin of TPEF signal in mouse ovaries at various ages and disease states. With TPEF excitation of 780 nm and collection of 405–505 nm, vitamins, amino acids and FAD have negligible signal [26,29,30] as compared to NADH, collagen and lipopigments. With an increase in age, normal ovaries show an increase in TPEF signal from lipofuscin and no changes in TPEF from NADH or collagen. Occurrence of disease caused a change in the fluorescence morphology. Many tumors had an increase in TPEF signal from lipofuscin as compared to normal ovary. Carcinoma specimens also showed an increase in TPEF signal from collagen. The low number of macrophages present in F4/80 staining of carcinoma, as compared to the number of cells staining positive for lipofuscin, indicated that in carcinoma specimens the majority of lipofuscin is not accumulated in macrophages, but rather in other native ovarian interstitial cells such as fibroblasts.
The average size and number of fluorescent cells and punctate material found by TPEF region analysis matched well with the morphology of lipofuscin seen by carbol fuchsin staining. However, there were large deviations from the averages in each group. This is due to the high variability in the location of the lipofuscin granules and foamy cells throughout the tissue. As seen by carbol fuchsin staining, some areas of tissue in a section have areas with abundant punctate staining and many clusters of lipofuscin-filled cells as well as areas with less punctate staining and few or no lipofuscin-filled cells. Since the TPEF signal was collected from a small field of view (400 × 400 μm), the number and size of fluorescent cells and punctate fluorescence was highly variable based on the location that was imaged. For example, only two carcinoma specimens showed an area with foamy cells in the TPEF images even though all of the carcinoma specimens had foamy cells visible in H&E and carbol fuchsin stained sections. Furthermore, all images vary in the amount of field of view containing signal and the number of fluorescent regions is highly dependent on this amount. The curved or varied topography of the tissue surface combined with the water immersion objective led to the large number of images without signal in the full field of view. To reduce the effects from within-tissue variability, multiple locations on the tissue must be imaged in order to get a complete understanding of the fluorophore content and morphology in the tissue. To obtain images with signal in the entire field of view a multifocal approach could be implemented, or a contact probe could be utilized to flatten the tissue so that the depth of imaging in the tissue is equal across the field of view. Another limitation of this study was the low number of adenocarcinomas that developed. More conclusive findings could be drawn from a larger sample size.
Previous literature has shown the presence of punctate fluorescence in human ovaries [13]. Large regions of bright fluorescence, as was seen in this mouse model, have not been described in human ovaries. However, accumulation of lipopigments has previously been found in genital system granulomas [22]. Furthermore, the trend of more lipofuscin containing cells with age and disease follows the trend of lipofuscin accumulation with age and disease seen in the liver [29]. The significant increase in the size of foamy, lipofuscin containing cells with the development of a variety of tumors is likely due to heightened oxidative damage as a result of cell proliferation and death. This is supported by the accumulation of a large number of foamy cells in tubular adenoma, a quickdeveloping tumor, and carcinoma, an aggressive tumor, but less of such cells in the slow growing sex-cord tumors, which are generally benign.
TPEF images from normal mouse ovaries in this study look similar to TPEF images of normal human ovaries seen in previous literature, featuring dim cellular fluorescence from NADH and bright punctate fluorescence throughout the interstitial tissue [13]. In addition to normal human ovaries, Kirkpatrick et al. imaged human ovarian carcinoma, but they were interested in NADH fluorescence and processed the images to remove bright punctate fluorescence in carcinoma images prior to publication. Therefore, it is unknown if patterns of bright fluorescence, similar to the patterns seen in our mouse model, occur in human ovarian cancer.
The similarity in morphology of TPEF of the normal mouse and human ovary suggest that discoveries in this animal model could translate to humans. The usefulness of the model is further supported by the trend of increasing lipofuscin with age and disease, seen in humans [22,31]. Furthermore, the rapid accumulation of lipofuscin with tumor development in this model suggests that lipofuscin content has potential as a diagnostic factor and may be a good early indicator of ovarian cancer in young patients, where age is less likely to confound findings. In such patients, single or two-photon fluorescence imaging or spectroscopy could be implemented in vivo using minimally invasive techniques to detect lipofuscin accumulation. Animals with a high metabolic rate accumulate lipofuscin faster than animals with slower metabolic rate, so the accumulation of lipofuscin seen in these tumors is likely accelerated as compared to what may be seen in humans [32]. Additional studies are required to determine if lipofuscin accumulation commonly occurs with disease in human ovary. In the future, we would like to perform two-photon fluorescence imaging in human tissue to determine if lipofuscin may be a good diagnostic indicator of disease in human ovary.
Acknowledgments
This work was supported by the National Institutes of Health, National Cancer Institute research grant R01 CA119200, and the University of Arizona Cancer Center Support Grant (CCSG; CA023074).
Contract grant sponsor: National Institutes of Health; Contract grant sponsor: National Cancer Institute Research Grant; Contract grant number: R01 CA119200; Contract grant sponsor: University of Arizona Cancer Center Support Grant (CCSG); Contract grant number: CA023074.
Footnotes
Conflict of Interest Disclosures: All authors have completed and submitted the ICMJE Form for Disclosure of Potential Conflicts of Interest and none were reported.
References
- 1.Jemal A, Bray F, Center MM, Ferlay J, Ward E, Forman D. Global Cancer Statistics. CA Cancer J Clin. 2011;61:69–90. doi: 10.3322/caac.20107. [DOI] [PubMed] [Google Scholar]
- 2.Brewer MA, Utzinger U, Barton JK, Hoying JB, Kirkpatrick ND, Brands WR, Davis JR, Hunt K, Stevens SJ, Gmitro AF. Imaging of the ovary. Technol Cancer Res Treat. 2004;3(6):617–627. doi: 10.1177/153303460400300612. [DOI] [PubMed] [Google Scholar]
- 3.Kanter EM, Walker RM, Marion SL, Brewer M, Hoyer PB, Barton JK. Dual modality imaging of a novel rat model of ovarian carcinogenesis. J Biomed Opt. 2006;11(4):041123. doi: 10.1117/1.2236298. [DOI] [PubMed] [Google Scholar]
- 4.Hariri LP, Liebmann ER, Marion SL, Hoyer PB, Davis JR, Brewer MA, Barton JK. Simultaneous optical coherence tomography and laser induced fluorescence imaging in a rat model of ovarian carcinogenesis. Cancer Biol Ther. 2010;5:438–447. doi: 10.4161/cbt.10.5.12531. [DOI] [PMC free article] [PubMed] [Google Scholar]
- 5.George R, Michaelides M, Brewer MA, Utzinger U. Parallel factor analysis of ovarian autofluorescence as a cancer diagnostic. Lasers Surg Med. 2012;44:282–295. doi: 10.1002/lsm.22014. [DOI] [PubMed] [Google Scholar]
- 6.Brewer M, Utzinger U, Yang L, Atkinson N, Satterfield W, Auersperg N, Richards-Kortum R, Follen M, Bast R. Fluorescence spectroscopy as a biomarker in a cell culture and in a nonhuman primate model for ovarian cancer chemopreventive agents. J Biomed Opt. 2002;7(1):20–26. doi: 10.1117/1.1427672. [DOI] [PubMed] [Google Scholar]
- 7.Zhong W, Celli JP, Rizvi I, Spring BQ, Yum SH, Hasan T. In vivo high-resolution fluorescence microendoscopy for ovarian cancer detection and treatment monitoring. Br J Cancer. 2009;101:2015–2022. doi: 10.1038/sj.bjc.6605436. [DOI] [PMC free article] [PubMed] [Google Scholar]
- 8.Chishima T, Miyagi Y, Wang X, Yamaoka H, Shimada H, Moossa AR, Hoffman RM. Cancer invasion and micrometastasis visualized in live tissue by green fluorescent protein expression. Cancer Res. 1997;57:2042. [PubMed] [Google Scholar]
- 9.Tanbakuchi AA, Udovich JA, Rouse AR, Hatch KD, Gmitro AF. In vivo imaging of ovarian tissue using a novel confocal microlaparoscope. Am J Obstet Gynecol. 2012;202(1):90.e1–90.e9. doi: 10.1016/j.ajog.2009.07.027. [DOI] [PMC free article] [PubMed] [Google Scholar]
- 10.Zucker RM, Jeffay SC. Confocal laser scanning microscopy of whole mouse ovaries: Excellent morphology, apoptosis detection and spectroscopy. Cytometry. 2006;69A(8):930–939. doi: 10.1002/cyto.a.20315. [DOI] [PubMed] [Google Scholar]
- 11.Provenzano PP, Eliceiri KW, Keely PJ. Multiphoton microscopy and fluorescence lifetime imaging microscopy (FLIM) to monitor metastasis and the tumor microenvironment. Clin Exp Metastasis. 2009;26:357–370. doi: 10.1007/s10585-008-9204-0. [DOI] [PubMed] [Google Scholar]
- 12.Adur J, Pelegati VB, Costa LFL, Pietro L, de Thomaz AA, Almeida DB, Bottcher-Luiz F, Andrade LALA, Cesar CL. Recognition of serous ovarian tumors in human samples by multimodal nonlinear optical microscopy. J Biomed Opt. 2011;16(9):096017. doi: 10.1117/1.3626575. [DOI] [PubMed] [Google Scholar]
- 13.Kirkpatrick ND, Brewer MA, Utzinger U. Endogenous optical biomarkers of ovarian cancer evaluated with multiphoton microscopy. Cancer Epidemiol Biomarkers Prev. 2007;16:2048–2057. doi: 10.1158/1055-9965.EPI-07-0009. [DOI] [PubMed] [Google Scholar]
- 14.Richards-Kortum R, Sevick-Muraca E. Quantitative optical spectroscopy for tissue diagnosis. Annu Rev Phys Chem. 1996;47:555–606. doi: 10.1146/annurev.physchem.47.1.555. [DOI] [PubMed] [Google Scholar]
- 15.Lakowicz JR. Principles of fluorescence spectroscopy. 3. New York: Springer Science; Business Media LLC; 2006. pp. 63–67. [Google Scholar]
- 16.Deane HW, Fawcett DW. Pigmented interstitial cells showing “brown degeneration” in the ovaries of old mice. Anat Rec. 1952;113:239–245. doi: 10.1002/ar.1091130208. [DOI] [PubMed] [Google Scholar]
- 17.Reagan JW. Ceroid pigment in the human ovary. Am J Obst Gynecol. 1950;59:433–436. [Google Scholar]
- 18.Endicott KM, Lillie RD. Ceroid, the pigment of dietary cirrhosis of rats its characteristics and its differentiation from hemofuscin. Am J Pathol. 1944;20:149–153. [PMC free article] [PubMed] [Google Scholar]
- 19.Sun Y, Yu H, Zheng D, Cao Q, Wang Y, Harris D, Wang Y. Sudan black B reduces autofluorescence in murine renal tissue. Arch Pathol Lab Med. 2011;130(10):1335–1342. doi: 10.5858/arpa.2010-0549-OA. [DOI] [PubMed] [Google Scholar]
- 20.Schnell SA, Staines WA, Wessendorf MW. Reduction of lipofuscin-like autofluorescence in fluorescently labeled tissue. J Histochem Cytochem. 1999;47:719–730. doi: 10.1177/002215549904700601. [DOI] [PubMed] [Google Scholar]
- 21.Marmorstein AD, Marmorstein LY, Sakaguchi H, Hollyfield JG. Spectral profiling of autofluorescence associated with lipofuscin, bruch’s membrane, and sub-RPE deposits in normal and AMD eyes. Invest Opthalmol Vis Sci. 2002;43(7):2435–2441. [PubMed] [Google Scholar]
- 22.Ooi K, Riley C, Billson V, Ostor AG. Ceroid granulomas in the female genital system. J Clin Pathol. 1995;48:1057–1059. doi: 10.1136/jcp.48.11.1057. [DOI] [PMC free article] [PubMed] [Google Scholar]
- 23.Sahoo PK, Soltani S, Wong AKC. A survey of thresholding techniques. Comput Vision Graph Image Process. 1988;41:233–260. [Google Scholar]
- 24.Marion SL, Watson J, Sen N, Brewer MA, Barton JK, Hoyer PB. 7,12-dimethylbenz[a]anthracene-induced malignancies in a mouse model of menopause. Comparative Medicine. 2012 in press. [PMC free article] [PubMed] [Google Scholar]
- 25.Zipfel WR, Williams RM, Christie R, Nikitin AY, Hyman BT. Live tissue intrinsic emission microscopy using multiphotonexcited native fluorescence and second harmonic generation. Proc Natl Acad Sci USA. 2003;100(12):7075–7080. doi: 10.1073/pnas.0832308100. [DOI] [PMC free article] [PubMed] [Google Scholar]
- 26.Huang S, Heikal AA, Webb WW. Two-photon fluorescence spectroscopy and microscopy of NAD(P)H and flavoprotein. Biophys J. 2002;82:2811–2825. doi: 10.1016/S0006-3495(02)75621-X. [DOI] [PMC free article] [PubMed] [Google Scholar]
- 27.Rice WL, Kaplan DL, Georgakoudi I. Two-photon microscopy for non-invasive, quantitative monitoring of stem cell differentiation. PLoS ONE. 2012;5(4):e10075. doi: 10.1371/journal.pone.0010075. [DOI] [PMC free article] [PubMed] [Google Scholar]
- 28.Breslin TM, Xu F, Palmer GM, Zhu C, Gilchrist KW, Ramaunjam N. Autofluorescence and diffuse reflectance properties of malignant and benign breast tissue. Ann Surg Oncol. 2003;11(1):65–70. doi: 10.1007/BF02524348. [DOI] [PubMed] [Google Scholar]
- 29.Rehms AA, Callis PR. Two-photon fluorescence excitation spectra of aromatic amino acids. Chem Phys Lett. 1993;208(34):276–282. [Google Scholar]
- 30.Birge RR. Two-photon spectroscopy of protein-bound chromophores. Acc Chem Res. 1986;19:138–146. [Google Scholar]
- 31.Reddy JK, Lalwani ND, Reddy MK, Qureshi SA. Excessive accumulation of autofluorescent lipofuscin in the liver during hepatocarcinogenesis by methyl clofenapate and other hypolipidemic peroxisome proliferators. Cancer res. 1982;42:259–266. [PubMed] [Google Scholar]
- 32.Sohal RS, Brunk UT. Lipofuscin as an indicator of oxidative stress and aging. Adv Exp Med Biol. 1989;266:17–29. doi: 10.1007/978-1-4899-5339-1_2. [DOI] [PubMed] [Google Scholar]


