

Abstract
Cutaneous T-cell lymohomas (CTCLs) are rare, but potentially devastating malignancies, with Mycosis fungoides and Sézary Syndrome being the most common. In our previous study, we identified and described regions of geographic clustering of CTCL cases in Texas by analyzing ∼1990 patients using two distinct cancer registries. In the current work, we describe in detail demographic patterns for this malignancy in our study population and apply logistic regression models to analyze the incidence of CTCL by sex, race, age, and clinical stage at the time of diagnosis. Furthermore, using Fisher's exact test, we analyze changes in incidence over time in the identified Houston communities with unusually high CTCL incidence. While CTCL primarily affects Caucasian individuals >55 years old, we confirm that it presents at a younger age and with more advanced disease stages in African-American and Hispanic individuals. Also, we demonstrate a significant increase in CTCL incidence over time in the identified communities. Spring, Katy, and Houston Memorial areas had high baseline rates. Furthermore, a statistically significant disease surge was observed in these areas after ∼2005. This report supplements our initial study documenting the existence of geographic clustering of CTCL cases in Texas and in greater detail describes demographic trends for our patient population. The observed surge in CTCL incidence in the three identified communities further argues that this malignancy may be triggered by one or more external etiologic agents.
Keywords: Cutaneous T-cell lymphoma (CTCL), demographic patterns, geographic clustering, mycosis fungoides, Sézary syndrome
Introduction
Cutaneous T-cell lymphomas (CTCLs) are rare, but potentially devastating malignancies that have distinct clinical and histological features. Mycosis fungoides (MF), primary cutaneous anaplastic large cell lymphoma and a leukemic form, Sézary Syndrome (SS), are the most common variants and account for ∼80% of all cutaneous lymphomas 1. Epidemiologic studies based on the Surveillance, Epidemiology, and End Results (SEER) databases established that until recently CTCLs were on the rise in the United States 2 and multiple reports have shown a ∼threefold increase in CTCL incidence during the last 25–30 years 3,4. Based on recent analyses, the incidence of this cancer during 2000–2010 years reached ∼10 cases per million individuals per year in the United States 2. Similarly, increase in CTCL incidence has been observed in other parts of the world 5–7. This malignancy often presents at an older age (i.e., >55 years old) in Caucasians, but in African-American, Hispanic, and Middle-Eastern individuals studies have shown an earlier age at presentation with a more aggressive clinical course 4,5,8.
The molecular pathogenesis of CTCL is only partially understood. MF is hypothesized to arise from antigen-stimulated helper/memory T cells, but the antigen remains unknown and would likely differ among patients. Many studies have attempted to elucidate the genetic basis of this cancer 9–14, whereas others strived to identify cancer-initiating cells for MF and SS 15. Previous studies have demonstrated that CTCL can occur in married couples 16–18 and may cluster in families 19,20. Recent investigations demonstrated geographic clustering of CTCL cases in the Västernorrland county of Sweden 21 and Pittsburgh, Pennsylvania 22 therefore implying possible existence of an environmental trigger for this cancer. Prior studies have looked for a viral, chemical, or an occupational disease trigger, but failed to yield any conclusive etiologic agents 23–25. Some cases of MF have been associated with hydrochlorothiazide and other medications 26. Some patients with smoldering HTLV-1 associated adult T-cell lymphoma present with MF-like skin lesions 27,28, but based on other studies, retroviruses have not been identified in the vast majority of MF cases 29,30.
In our recent study, based on two distinct cancer registries, we have, for the first time, documented geographic clustering of patients in several communities across Texas 31. This included the cities of Beaumont, Katy, Spring, and Memorial area of Houston, where CTCL incidence rates were 5–20 times higher than the expected population rate. Furthermore, our analysis demonstrated that two densely populated adjacent zip codes (79936 and 79928) near El Paso, Texas were completely spared by CTCL during 1995–2010 31. El Paso is located in a hot desert climate adjacent to the borders of New Mexico and Mexico. Hispanic individuals represent >80% of population in this area. Notably, El Paso, TX was documented to be one of the sunniest cities in the country 32. El Paso is the fourth sunniest city in the United States and first in Texas with 84% annual sunshine, which could be a protective or a therapeutic factor for MF 32.
In this work using the MD Anderson Cancer Center (MDACC) CTCL clinic patient database together with the statewide population-based Texas Cancer Registry (TCR), we expand on our initial observations and describe the patterns of demographic incidence for CTCL in our patient population. We also describe the changes in incidence rates over time in identified geographic clusters.
Materials and Methods
Patient demographics and chart review
This study was approved by the MDACC IRB (IRB protocols: PA12-0497, PA12-0267 and Lab97-256). All patients signed an IRB-approved consent 33. Patients in the MDACC CTCL clinic database were prospectively invited to participate in a research study on the pathogenesis of CTCL with a participation rate of >90%. Sex, race, date of diagnosis as well as age, clinical stage, and residential address at the time of diagnosis were analyzed for patients seen in the clinic between the years 2000 and 2012 (i.e., MDACC database).
The TCR is a population-based registry that collects data on all cancers, including CTCL, for the entire state of Texas. Hence, to confirm our results we obtained de-identified data from this public database. ICD-O codes 9700/3, 9709/3, 9701/3 and ICD-10 codes C84.0, C84.1, C84.8 were used to identify cases of CTCL diagnosed statewide from 1996 to 2010 (dates of data availability). Data were provided for the entire state and for each individual zip code. The TCR was not able to provide data by clinical stage at the time of diagnosis. In our previous study, we documented that MDACC has a catch rate of ∼52% for the entire state of Texas when compared with the TCR database, whereas for overlapping zipcodes, 87% correlation rate was observed between the two databases 31.
Statistical analyses
Unless otherwise specified, analysis of the complete data on all patients seen at the MDACC CTCL clinic from 2000 to 2012 is presented throughout the study. Incidence rates and 95% confidence intervals (CI) were calculated and reported. Unless otherwise specified, 2000 and 2010 US Census data were used for all population analyses, where results before 2005 were compared to the year 2000 US Census, whereas results after 2006 were compared to the 2010 US census. Confidence intervals were based on Poisson distributions. Graphs were used to visually report these rates. Incidence rates were compared to the expected rates using Chi Square or Fisher's exact tests as appropriate. Demographic characteristics including race (Caucasian, African-American, Hispanic, and other) and age groups (<40, 40–59, and ≥60 years old) were assessed and reported. To examine whether differences exist between men and women or different races, logistic regression models were conducted accounting for age, sex, race, and stage of the disease at the time of diagnosis. Standard model selection procedures were used to select the final models 34.
Results
The MDACC multidisciplinary CTCL clinic has been in existence since 1987 and has a high rate of referral from Texas and the surrounding states. During the study period (2000–2012), 1047 new CTCL patients were seen in our clinic with an average of ∼80 new cases evaluated and treated each year from Texas. In most cases, patients received their initial diagnosis elsewhere and were referred to our clinic for further evaluation and management. Each patient's slides were reviewed by an MDACC dermatopathologist to confirm their diagnosis.
The TCR collects data on all cancers, including CTCL, for the entire state of Texas. On the basis of data availability, we were able to obtain de-identified data from 1996 through 2010. During this time 1990 new cases of CTCL were recorded in the registry with ∼132 cases on average being documented each year. The overall annual incidence rate for the state of Texas for 1996 through 2010 was 5.77; 95% CI [5.52, 6.03] per million individuals per year.
Analysis of patient demographic characteristics
We examined the demographic characteristics of our patient population based on the MDACC database. Initial analysis of patient characteristics revealed that they came from various racial groups that were reflective of the demographic representation of the state (Table1). The mean age of diagnosis for all patients was 56.3 ± 16.6 years. Analysis by race demonstrated that the mean age of diagnosis was 60.0 ± 14.8 years for Caucasian, 49.3 ± 16.9 years for African-American and 47.4 ± 17.8 years for Hispanic patients. The observed age differences between ethnic groups support the findings of previous reports indicating that African-American and Hispanic patients have an earlier onset of the disease 4,8, and are further supported by a logistic regression analysis (Table2). Graphic analysis of age at the time of diagnosis by ethnicity is presented in Figure1A. The above findings are also supported by the analysis of the TCR database, which showed almost identical patient distribution according to gender and race (Table3). The overall average age of diagnosis according to the TCR database was 58.7 ± 17.2. Similar to the MDACC findings, the age of diagnosis for Caucasians was 62.0 ± 15.5, whereas for African-Americans, Hispanic, and Pacific-Islander nationalities the mean ages were 52.2 ± 18.6, 52.8 ± 17.9, and 45.9 ± 17.0, respectively. The observed age differences between ethnic groups, based on the TCR database, were also compared using logistic regression analysis (Table4).
Table 1.
Clinical characteristics of CTCL patients in the study based on MDACC databases. Tables adopted from 31
| MDACC database | State of Texas | |
|---|---|---|
| n | % | |
| Number of patients | 1047 | |
| Age at diagnosis | 56.3 ± 16.6 | |
| Sex | ||
| Female | 491 | 46.9 |
| Male | 556 | 53.1 |
| Race | ||
| Caucasian | 718 | 68.6 |
| African-American | 144 | 13.8 |
| Hispanic | 156 | 14.9 |
| Other | 29 | 2.8 |
| CTCL clinical stage | ||
| I | 794 | 75.8 |
| II | 112 | 10.7 |
| III | 32 | 3.1 |
| IV | 109 | 10.4 |
Table 2.
Logistic regression analysis of patient characteristics associated with African-American, Hispanic, and other races versus Caucasian ethnicity using MDACC databases
| Logistic regression analysis odds ratio [95% confidence interval] | |||
|---|---|---|---|
| Patient characteristics | African-American versus caucasian | Hispanic versus caucasian | Other ethnicities versus caucasian |
| Age | |||
| <40 | 5.71 [3.18, 10.25] | 7.17 [4.21, 12.22] | 12.04 [3.98, 36.41] |
| 40–59 | 2.69 [1.68, 4.30] | 2.74 [1.74, 4.31] | 3.07 [1.03, 9.16] |
| ≥60 | 1 (reference) | 1 (reference) | 1 (reference) |
| Clinical disease stage | |||
| >II | 2.83 [1.81, 4.42] | 1.25 [0.78, 2.01] | 0.64 [0.18, 2.20] |
| I | 1 (reference) | 1 (reference) | 1 (reference) |
| Sex | |||
| Male | 0.43 [0.29, 0.66] | 0.76 [0.52, 1.11] | 1.18 [0.53, 2.66] |
| Female | 1 (reference) | 1 (reference) | 1 (reference) |
Figure 1.
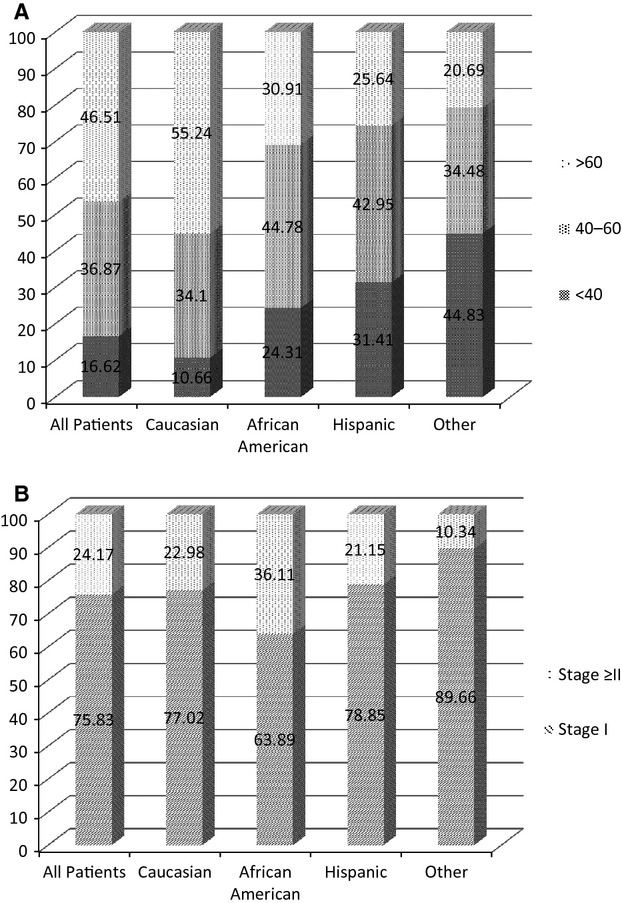
Graphic representation of patient characteristics by race (MDACC database results). (A) Patient age of diagnosis distribution by race. (B) Clinical disease stage at the time of diagnosis by race.
Table 3.
Clinical characteristics of CTCL patients in the study based on TCR databases. Tables adopted from 31
| TCR database | State of Texas | |
|---|---|---|
| n | % | |
| Number of patients | 1990 | |
| Age at diagnosis | 58.7 ± 17.2 | |
| Sex | ||
| Female | 892 | 44.8 |
| Male | 1098 | 55.2 |
| Race | ||
| Caucasian | 1308 | 65.7 |
| African-American | 318 | 16.0 |
| Hispanic | 303 | 15.2 |
| Asian pacific | 24 | 1.2 |
| Other | 37 | 1.9 |
Table 4.
Logistic regression analysis of patient characteristics associated with African-American, Hispanic, and other races versus Caucasian ethnicity using TCR databases
| Logistic regression analysis odds ratio [95% confidence interval] | |||
|---|---|---|---|
| Patient characteristics | African-American versus caucasian | Hispanic versus caucasian | Asian-pacific versus caucasian |
| Age | |||
| <40 | 3.99 [2.81, 5.65] | 4.30 [3.01, 6.14] | 12.15 [4.38, 33.70] |
| 40–59 | 1.79 [1.36, 2.37] | 1.97 [1.49, 2.62] | 2.24 [0.75, 6.7] |
| ≥60 | 1 (reference) | 1 (reference) | 1 (reference) |
| Sex | |||
| Male | 0.71 [0.55, 0.91] | 0.91 [0.70, 1.18] | 0.76 [0.33, 1.72] |
| Female | 1 (reference) | 1 (reference) | 1 (reference) |
Furthermore, consistent with previous reports 35, the MDACC database demonstrated that more African-American patients (36.1%) presented with advanced disease stages (i.e., stage ≥ II) compared to Caucasians (23.0%) or Hispanics (21.2%). These findings were further confirmed by a logistic regression analysis odds ratio (OR) of 2.83 [1.81, 4.42] (Tables2 and 5). Graphical analysis of the clinical disease stage at the time of diagnosis by race is presented in Figure1B. Also, males were 61% more likely than females to present with advanced disease OR 1.61 [1.17, 2.22] (Tables5 and 6).
Table 5.
Patient characteristics associated with clinical disease stage ≥ II versus stage = I at the time of diagnosis based on the MDACC database results (2000–2011)
| Logistic regression analysis | |
|---|---|
| Patient characteristics | Odds ratio [95% confidence interval] |
| Age | |
| <40 | 0.30 [0.17, 0.53] |
| 40–59 | 0.57 [0.40, 0.80] |
| ≥60 | 1 (reference) |
| Sex | |
| Male | 1.61 [1.17, 2.22] |
| Female | 1 (reference) |
| Race | |
| African-American | 2.83 [1.81, 4.42] |
| Hispanic | 1.25 [0.78, 2.01] |
| Other | 0.64 [0.19, 2.22] |
| Caucasian | 1 (reference) |
Table 6.
Patient characteristics associated with male versus female sex based on the MDACC database results (2000–2011)
| Logistic regression analysis | |
|---|---|
| Patient characteristics | Odds ratio [95% confidence interval] |
| Age | |
| <40 | 0.70 [0.46, 1.05] |
| 40–56 | 0.81 [0.60, 1.09] |
| ≥60 | 1 (reference) |
| Clinical disease stage | |
| ≥II | 1.61 [1.17, 2.22] |
| I | 1 (reference) |
| Race | |
| African-American | 0.43 [0.29, 0.66] |
| Hispanic | 0.76 [0.52, 1.11] |
| Other | 1.18 [0.53, 2.66] |
| Caucasian | 1 (reference) |
Change in rate of incidence over time
In our previous report, we documented three areas of geographic clustering of CTCL in Houston: Katy, Spring, and Memorial area. Based on the 2000–2010 MDACC database results, the overall incidence rates were 136 cases per million per year in Katy, 52 cases per million per year in Spring and 34 cases per million per year in Houston Memorial area (zip code 77024). In comparison, the overall incidence rate for Texas and Houston were 5.8 and 6.4 cases per million per year, respectively. Analysis of the incidence rate over time documented that while these communities had a high baseline rate of disease, there was a dramatic increase in the incidence of CTCL after ∼2005 (Fig.2A). The comparison of incidence rate before and after 2005 documented a significant jump in incidence rate. This was further supported by Fisher's exact test comparing the incidence of CTCL in these communities to the documented incidence rate in Houston (Fig.2B). Calculated P values signifying deviation from the norm were highly statistically significant and are presented in Figure2B for each community.
Figure 2.
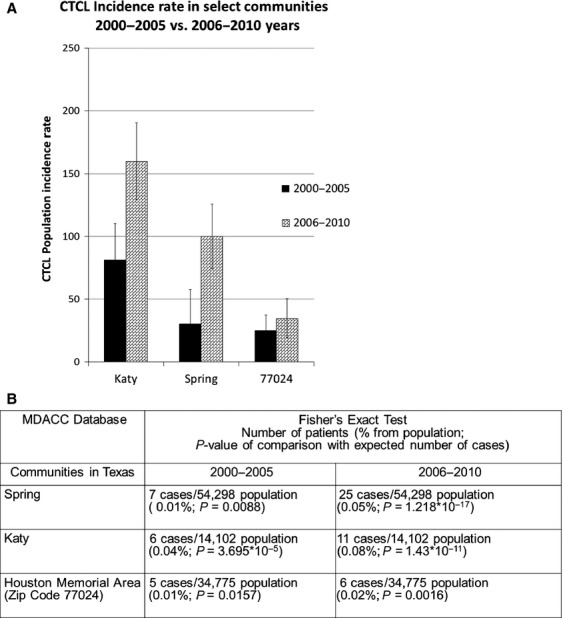
Incidence rates of CTCL in the identified communities over time. (A) Graphical comparison of CTCL incidence rate for communities with high CTCL incidence during 2000–2005 versus 2006–2010 years (MDACC database results). (B) Fisher's exact test comparison of CTCL incidence in Houston communities to population rate of 6.4 cases per million per year.
Discussion
The current report supplements our initial study documenting the existence of geographic clustering of CTCL cases in Texas and describes in greater detail demographic trends for our patient population. This study further highlights that while in Caucasian patients CTCL principally affects individuals ≥60 years old, in African-American and Hispanic individuals it presents at a much younger age (i.e., during 40s). Furthermore, in African-Americans and in men CTCL is often diagnosed at an advanced clinical stage (≥stage II). Also, we demonstrate a significant increase in CTCL incidence over time in the identified communities. While Spring, Katy, and Houston Memorial areas had a high baseline rate, a significant disease surge was observed after 2005. This finding lends further support to the notion that this malignancy may be triggered by an external etiologic agent.
Previous epidemiologic studies based on the Surveillance, Epidemiology and End Results (SEER) databases established that CTCL is on the rise in the United States and around the world 36. Similarly, a recent increase in these cancers has been identified in Saudi Arabia and Kuwait, where MF often affects children and adolescents 37,38. Our findings suggest that geographic mapping of patients by various CTCL centers will reveal additional areas of geographic clustering. Further analysis of these CTCL “endemic” areas will hopefully identify external causes and may help us prevent this cancer in the future.
Notably, parallels can be drawn with other rare malignancies, where increased incidence in certain populations and/or geographic areas made it possible to identify a definitive trigger. For example, studies assessing the prevalence of mesotheliomas in the mining regions of South Africa and Quebec, Canada, established asbestos as a critical factor responsible for this deadly disease 39,40. Similarly, a study of a small arsenic mining town in Prussia in 1898, where chronic poisoning of drinking water supply occurred, helped establish the link between arsenic and the occurrence of arsenical keratoses and skin squamous cell carcinomas 41. Thus, epidemiologic studies showing regional clustering of patients may help identify environmental triggers for CTCL and other rare cancers leading to earlier detection or even prevention.
Acknowledgments
We thank the TCR for providing de-identified data on patients in Texas diagnosed with CTCL. We thank Brendan Cordeiro and Gregory Cormack for their technical assistance. We also thank Texas dermatologists, oncologists, and general practitioners for referring their cutaneous lymphoma patients to our clinic.
Conflicts of Interest
None declared.
References
- Willemze R, Jaffe ES, Burg G, Cerroni L, Berti E, Swerdlow SH, et al. WHO-EORTC classification for cutaneous lymphomas. Blood. 2005;105:3768–3785. doi: 10.1182/blood-2004-09-3502. [DOI] [PubMed] [Google Scholar]
- Buzzell RA. Carcinogenesis of cutaneous malignancies. Dermatol. Surg. 1996;22:209–215. doi: 10.1111/j.1524-4725.1996.tb00311.x. [DOI] [PubMed] [Google Scholar]
- Criscione VD. Weinstock MA. Incidence of cutaneous T-cell lymphoma in the United States, 1973–2002. Arch. Dermatol. 2007;143:854–859. doi: 10.1001/archderm.143.7.854. [DOI] [PubMed] [Google Scholar]
- Wilson LD, Hinds GA. Yu JB. Age, race, sex, stage, and incidence of cutaneous lymphoma. Clin. Lymphoma Myeloma Leuk. 2012;12:291–296. doi: 10.1016/j.clml.2012.06.010. [DOI] [PMC free article] [PubMed] [Google Scholar]
- Alsaleh QA, Nanda A, Al-Ajmi H, et al. Clinicoepidemiological features of mycosis fungoides in Kuwait, 1991–2006. Int. J. Dermatol. 2010;49:1393–1398. doi: 10.1111/j.1365-4632.2010.04567.x. [DOI] [PubMed] [Google Scholar]
- Riou-Gotta MO, Fournier E, Mermet I, et al. Primary cutaneous lymphomas: a population-based descriptive study of 71 consecutive cases diagnosed between 1980 and 2003. Leuk. Lymphoma. 2008;49:1537–1544. doi: 10.1080/10428190802136368. [DOI] [PubMed] [Google Scholar]
- Saunes M, Nilsen TI. Johannesen TB. Incidence of primary cutaneous T-cell lymphoma in Norway. Br. J. Dermatol. 2009;160:376–379. doi: 10.1111/j.1365-2133.2008.08852.x. [DOI] [PubMed] [Google Scholar]
- Sun G, Berthelot C, Li Y, et al. Poor prognosis in non-Caucasian patients with early-onset mycosis fungoides. J. Am. Acad. Dermatol. 2009;60:231–235. doi: 10.1016/j.jaad.2008.09.063. [DOI] [PubMed] [Google Scholar]
- Litvinov IV, Cordeiro B, Fredholm S, et al. Analysis of STAT4 expression in cutaneous T-cell lymphoma (CTCL) patients and patient-derived cell lines. Cell Cycle. 2014;13:2975–2982. doi: 10.4161/15384101.2014.947759. [DOI] [PMC free article] [PubMed] [Google Scholar]
- Litvinov IV, Cordeiro B, Huang Y, et al. Ectopic expression of cancer-testis antigens in cutaneous T-cell lymphoma patients. Clin. Cancer Res. 2014;20:3799–3808. doi: 10.1158/1078-0432.CCR-14-0307. [DOI] [PMC free article] [PubMed] [Google Scholar]
- Litvinov IV, Jones DA, Sasseville D. Kupper TS. Transcriptional profiles predict disease outcome in patients with cutaneous T-cell lymphoma. Clin. Cancer Res. 2010;16:2106–2114. doi: 10.1158/1078-0432.CCR-09-2879. [DOI] [PMC free article] [PubMed] [Google Scholar]
- Litvinov IV, Kupper TS. Sasseville D. The role of AHI1 and CDKN1C in cutaneous T-cell lymphoma progression. Exp. Dermatol. 2012;21:964–966. doi: 10.1111/exd.12039. [DOI] [PMC free article] [PubMed] [Google Scholar]
- Litvinov IV, Zhou Y, Kupper TS. Sasseville D. Loss of BCL7A expression correlates with poor disease prognosis in patients with early-stage cutaneous T-cell lymphoma. Leuk. Lymphoma. 2012;54:653–4. doi: 10.3109/10428194.2012.717695. , and 2013 Mar;. doi: 10.3109/10428194.2012.717695. [DOI] [PubMed] [Google Scholar]
- Netchiporouk E, Litvinov IV, Moreau L, Gilbert M, Sasseville D. Duvic M. Deregulation in STAT signaling is important for cutaneous T-cell lymphoma (CTCL) pathogenesis and cancer progression. Cell Cycle. 2014;13:3331–3335. doi: 10.4161/15384101.2014.965061. [DOI] [PMC free article] [PubMed] [Google Scholar]
- Campbell JJ, Clark RA, Watanabe R. Kupper TS. Sezary syndrome and mycosis fungoides arise from distinct T-cell subsets: a biologic rationale for their distinct clinical behaviors. Blood. 2010;116:767–771. doi: 10.1182/blood-2009-11-251926. [DOI] [PMC free article] [PubMed] [Google Scholar]
- Schmidt AN, Robbins JB, Greer JP. Zic JA. Conjugal transformed mycosis fungoides: the unknown role of viral infection and environmental exposures in the development of cutaneous T-cell lymphoma. J. Am. Acad. Dermatol. 2006;54:S202–S205. doi: 10.1016/j.jaad.2005.09.013. [DOI] [PubMed] [Google Scholar]
- Wooldridge WE. Lorenc E. Mycosis fungoides in husband and wife. Mo. Med. 1985;82:201–202. [PubMed] [Google Scholar]
- Hazen PG. Michel B. Hodgkin's disease and mycosis fungoides in a married couple. Dermatologica. 1977;154:257–260. doi: 10.1159/000251078. [DOI] [PubMed] [Google Scholar]
- Hodak E, Klein T, Gabay B, et al. Familial mycosis fungoides: report of 6 kindreds and a study of the HLA system. J. Am. Acad. Dermatol. 2005;52:393–402. doi: 10.1016/j.jaad.2003.12.052. [DOI] [PubMed] [Google Scholar]
- Hodak E. Friedman E. Familial mycosis fungoides: model of genetic susceptibility. Clin. Lymphoma Myeloma Leuk. 2010;10(Suppl. 2):S67–S69. doi: 10.3816/CLML.2010.s.010. [DOI] [PubMed] [Google Scholar]
- Gip L. Nilsson E [Clustering of mycosis fungoides in the County of Vasternorrland] Läkartidningen. 1977;74:1174–1176. [PubMed] [Google Scholar]
- Moreau JF, Buchanich JM, Geskin JZ, Akilov OE. Geskin LJ. Non-random geographic distribution of patients with cutaneous T-cell lymphoma in the Greater Pittsburgh Area. Dermatol. Online J. 2014;20(7) , and ). doj_23128. Retrieved from: http://escholarship.org/uc/item/4nw7592w. [PubMed] [Google Scholar]
- Morales-Suarez-Varela MM, Olsen J, Johansen P, et al. Occupational risk factors for mycosis fungoides: a European multicenter case-control study. J. Occup. Environ. Med. 2004;46:205–211. doi: 10.1097/01.jom.0000116819.01813.8c. [DOI] [PubMed] [Google Scholar]
- Wohl Y. Tur E. Environmental risk factors for mycosis fungoides. Curr. Probl. Dermatol. 2007;35:52–64. doi: 10.1159/000106410. [DOI] [PubMed] [Google Scholar]
- Mirvish ED, Pomerantz RG. Geskin LJ. Infectious agents in cutaneous T-cell lymphoma. J. Am. Acad. Dermatol. 2011;64:423–431. doi: 10.1016/j.jaad.2009.11.692. [DOI] [PMC free article] [PubMed] [Google Scholar]
- Jahan-Tigh RR, Huen AO, Lee GL, Pozadzides JV, Liu P. Duvic M. Hydrochlorothiazide and cutaneous T cell lymphoma: prospective analysis and case series. Cancer. 2013;119:825–831. doi: 10.1002/cncr.27740. [DOI] [PubMed] [Google Scholar]
- Reitz MS, Jr, Poiesz BJ, Ruscetti FW. Gallo RC. Characterization and distribution of nucleic acid sequences of a novel type C retrovirus isolated from neoplastic human T lymphocytes. Proc. Natl. Acad. Sci. USA. 1981;78:1887–1891. doi: 10.1073/pnas.78.3.1887. [DOI] [PMC free article] [PubMed] [Google Scholar]
- Zucker-Franklin D. Pancake BA. The role of human T-cell lymphotropic viruses (HTLV-I and II) in cutaneous T-cell lymphomas. Semin. Dermatol. 1994;13:160–165. [PubMed] [Google Scholar]
- Detmar M, Pauli G, Anagnostopoulos I, et al. A case of classical mycosis fungoides associated with human T-cell lymphotropic virus type I. Br. J. Dermatol. 1991;124:198–202. doi: 10.1111/j.1365-2133.1991.tb00434.x. [DOI] [PubMed] [Google Scholar]
- Pawlaczyk M, Filas V, Sobieska M, Gozdzicka-Jozefiak A, Wiktorowicz K. Breborowicz J. No evidence of HTLV-I infection in patients with mycosis fungoides and Sezary syndrome. Neoplasma. 2005;52:52–55. [PubMed] [Google Scholar]
- Litvinov IV, Tetzlaff MT, Rahme E, et al. Identification of geographic clustering and regions spared by cutaneous T-cell lymphoma in Texas using 2 distinct cancer registries. Cancer. 2015 doi: 10.1002/cncr.29301. 2015 Feb 27. doi: 10.1002/cncr.29301. [Epub ahead of print] [DOI] [PMC free article] [PubMed] [Google Scholar]
- Center NCD. 2015. Rating of cities based on percentage annual sunshine. Available at http://www1.ncdc.noaa.gov/pub/data/ccd-data/pctposrank.txt (accessed January 10, 2015)
- Talpur R, Singh L, Daulat S, et al. Long-term outcomes of 1,263 patients with mycosis fungoides and Sezary syndrome from 1982 to 2009. Clin. Cancer Res. 2012;18:5051–5060. doi: 10.1158/1078-0432.CCR-12-0604. [DOI] [PMC free article] [PubMed] [Google Scholar]
- Hosmer DWL. Applied logistic regression. 2nd ed. New York, NY: John Wiley & Sons Inc; 2000. [Google Scholar]
- Nath SK, Yu JB. Wilson LD. Poorer prognosis of African-American Patients with mycosis fungoides: an analysis of the SEER dataset, 1988 to 2008. Clin. Lymphoma Myeloma Leuk. 2014;14:419–23. doi: 10.1016/j.clml.2013.12.018. , and 2014 Oct;. doi: 10.1016/j.clml.2013.12.018. [DOI] [PMC free article] [PubMed] [Google Scholar]
- Korgavkar K, Xiong M. Weinstock M. Changing incidence trends of cutaneous T-cell lymphoma. JAMA Dermatol. 2013;149:1295–1299. doi: 10.1001/jamadermatol.2013.5526. [DOI] [PubMed] [Google Scholar]
- AlGhamdi KM, Arafah MM, Al-Mubarak LA, Khachemoune A. Al-Saif FM. Profile of mycosis fungoides in 43 Saudi patients. Ann. Saudi Med. 2012;32:283–287. doi: 10.5144/0256-4947.2012.283. [DOI] [PMC free article] [PubMed] [Google Scholar]
- Nanda A, AlSaleh QA, Al-Ajmi H, et al. Mycosis fungoides in Arab children and adolescents: a report of 36 patients from Kuwait. Pediatr. Dermatol. 2010;27:607–613. doi: 10.1111/j.1525-1470.2010.01129.x. [DOI] [PubMed] [Google Scholar]
- van Kester MS, Borg MK, Zoutman WH, et al. A meta-analysis of gene expression data identifies a molecular signature characteristic for tumor-stage mycosis fungoides. J. Invest. Dermatol. 2012;132:2050–2059. doi: 10.1038/jid.2012.117. [DOI] [PubMed] [Google Scholar]
- Wagner JC, Sleggs CA. Marchand P. Diffuse pleural mesothelioma and asbestos exposure in the North Western Cape Province. Br. J. Ind. Med. 1960;17:260–271. doi: 10.1136/oem.17.4.260. [DOI] [PMC free article] [PubMed] [Google Scholar]
- Geyer L. Uber die chronischer Hautveranderungen beim Arsenicismus und Betrachtungen iiber die Massenerkrankungen in Reichenstein in Schlesien. Arch Derm. Syph. 1898;43:221–280. [Google Scholar]