Abstract
Dopamine neurons are thought to facilitate learning by comparing actual and expected reward1,2. Despite two decades of investigation, little is known about how this comparison is made. To determine how dopamine neurons calculate prediction error, we combined optogenetic manipulations with extracellular recordings in the ventral tegmental area (VTA) while mice engaged in classical conditioning. By manipulating the temporal expectation of reward, we demonstrate that dopamine neurons perform subtraction, a computation that is ideal for reinforcement learning but rarely observed in the brain. Furthermore, selectively exciting and inhibiting neighbouring GABA neurons in the VTA reveals that these neurons are a source of subtraction: they inhibit dopamine neurons when reward is expected, causally contributing to prediction error calculations. Finally, bilaterally stimulating VTA GABA neurons dramatically reduces anticipatory licking to conditioned odours, consistent with an important role for these neurons in reinforcement learning. Together, our results uncover the arithmetic and local circuitry underlying dopamine prediction errors.
Associative learning depends on comparing predictions with outcomes3,4. When outcomes match predictions, learning is not required. When outcomes violate predictions, animals must update their predictions to reflect experience. Dopamine neurons are thought to promote this process by encoding reward prediction error, or the difference between the reward an animal receives and the reward it expected to receive1,2 (see Supplementary Information).
Despite extensive study, how dopamine neurons calculate prediction error remains largely unknown. Reinforcement learning theories predict that dopamine neurons perform subtraction, simply calculating actual reward minus predicted reward (or, in temporal difference theories, the value of the current state minus the value of the previous state)1. However, dopamine neurons could also perform division, an equally fundamental and arguably more common neural computation5. The arithmetic underlying prediction errors has never been investigated.
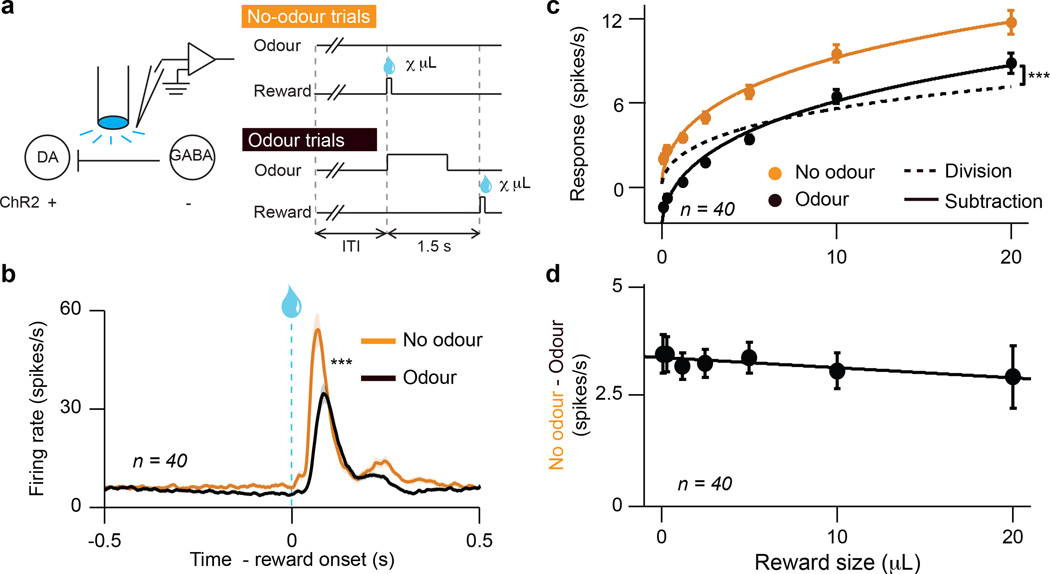
To probe how dopamine neurons calculate prediction error, we recorded from the VTA (Extended Data Figs. 1a, 2a–c) while mice (n = 5) performed a classical conditioning task with two interleaved trial types (Fig. 1a). On roughly half the trials, we delivered reward unexpectedly, in the absence of any cue. On these trials, both the timing and size of reward were unexpected. On the other half of trials, an odour cue predicted the timing of reward, but the size was still unexpected. By comparing responses to these two trial types, we could determine how temporal expectation modulates individual dopamine neurons across a range of firing rates. The light-gated ion channel, channelrhodopsin (ChR2), was expressed selectively in dopamine neurons, enabling us to identify neurons as dopaminergic based on their responses to light6 (Extended Data Fig. 3a–g).
Figure 1. Expectation triggers subtraction of dopamine neuron responses.
a, Dopamine identification recording paradigm (left) and task (right). b, Dopamine neuron firing rates (mean ± s.e.m across neurons) for unexpected (orange) or temporally expected (black) reward. ***, P < 0.001, t-test. c, Dopamine neuron responses (mean ± s.e.m.) to different reward sizes. Orange line, fit for unexpected reward. Dotted black line, divisive transformation. Solid black line, subtractive transformation. Subtraction was a better fit (***, P < 0.001, bootstrap; see Methods and Extended Data Fig. 6e). d, Difference between unexpected and expected reward responses (mean ± s.e.m.) as a function of reward size.
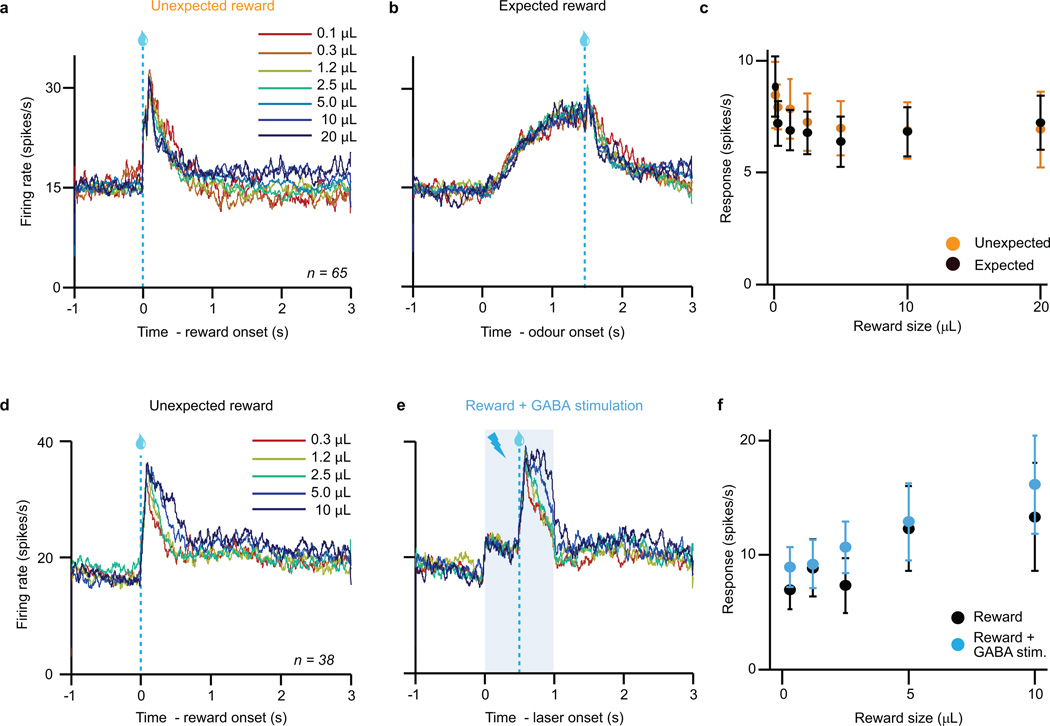
Consistent with previous results6,7, dopamine neurons increased their responses with increasing reward size (example neuron, Extended Data Fig. 4a). Much like sensory neurons in response to stimuli of increasing intensity, dopamine neurons showed a gradual, monotonic response, well-fit by a saturating Hill function (orange trace in Fig. 1c; note that VTA GABA neurons do not show the same monotonic response: Extended Data Fig. 5).
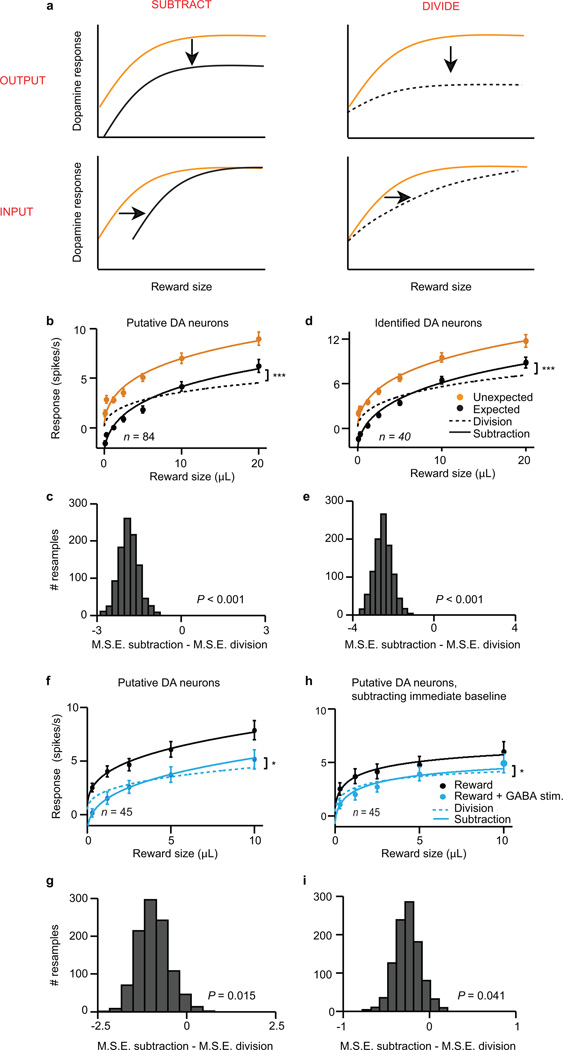
When reward was temporally expected, dopamine neurons’ responses were suppressed (P < 0.001, t-test; example neuron, Extended Data Fig. 4a; population, Fig. 1b). To determine the nature of the suppression, we performed two complementary analyses. First, we fit dopamine responses with both subtractive and divisive models (Extended Data Fig. 6a). We found that subtraction was a significantly better fit (P < 0.001, bootstrap; Fig. 1c and Extended Data Fig. 4b). Second, we plotted the effect of temporal expectation across reward sizes and measured the slope. A divisive process would produce a positive slope, as division should have a larger effect on larger dopamine responses. In contrast, subtraction would produce a slope near zero. We found the latter; regardless of reward size, the odour cue simply shifted the dose-response curve by a constant amount (P > 0.05, linear regression, Fig. 1d). This subtractive pattern held not just for the population, but also for 35/40 individual neurons (Extended Data Fig. 4c). Thus, consistent with classic reinforcement learning theories, dopamine neurons appear to be performing subtraction (specifically, output subtraction8; see Extended Data Fig. 6a).
Having established the computation, we next wished to determine the input that dopamine neurons subtract. A variety of biological models have been proposed to explain the neural circuit required to calculate prediction errors. Some of these models have situated the calculation at the level of the dopamine neurons9,10, while others have suggested that the calculation happens upstream, for instance in the lateral habenula11,12, and is then relayed to dopamine neurons. Recently, we demonstrated that GABAergic neurons in the VTA encode reward expectation, showing sustained responses that vary with the timing and size of expected reward6. Although these neurons are known to synapse onto nearby dopamine neurons13 and appear to play a role in conditioned behaviour14,15, there has been no direct evidence that dopamine neurons use the VTA GABA signal for prediction error calculations. Furthermore, although some models of prediction error calculations call for a ramping expectation function9,16,17, which resembles VTA GABA activity, others call for phasic, precisely-timed expectation signals18–20. Our study allows us to distinguish between these possibilities.
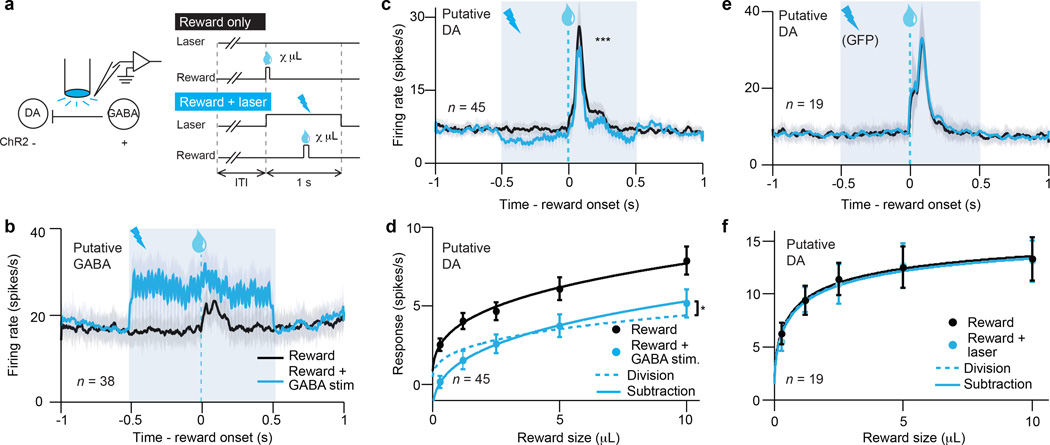
Since we know the normal firing patterns of VTA GABA neurons during classical conditioning6, our strategy was to mimic this firing and determine whether it induces subtraction of dopamine neuron responses. In a separate set of mice (n = 5), ChR2 was expressed selectively in VTA GABA neurons, enabling us to stimulate these neurons while recording from putative dopamine neurons (Extended Data Figs. 1b, 2d–f). Much like the previous task, we unexpectedly delivered rewards of various size (Fig. 2a). On half of the trials, reward was delivered alone; on the other half, reward was delivered during 40-Hz VTA GABA stimulation.
Figure 2. Selective excitation of VTA GABA neurons mimics the effect of expectation.
a, GABA stimulation recording paradigm (left) and task (right). b, Firing rate (mean ± s.e.m) of putative VTA GABA neurons with (blue) and without (black) ChR2 stimulation. Light blue box, laser delivery. c, Firing rate (mean ± s.e.m) of putative dopamine neurons. ***, P < 0.001, t-test. d, Dopamine neuron responses (mean ± s.e.m.) to different reward sizes. Black line, fit for unexpected reward. Dotted blue line, divisive transformation. Solid blue line, subtractive transformation. Subtraction was a better fit (*, P < 0.05, bootstrap; see Extended Data Fig. 6g). e, f, Same as c and d except in GFP-expressing control animals.
First we confirmed that ChR2 stimulation efficiently excited VTA GABA neurons (P < 0.001, paired t-test), adding about 10 spikes/s to the neurons’ baseline firing rate (example neuron, Extended Data Fig. 4d; population, Fig. 2b). This laser-evoked activity roughly resembled the normal activity of VTA GABA neurons during classical conditioning (Extended Data Fig. 2f).
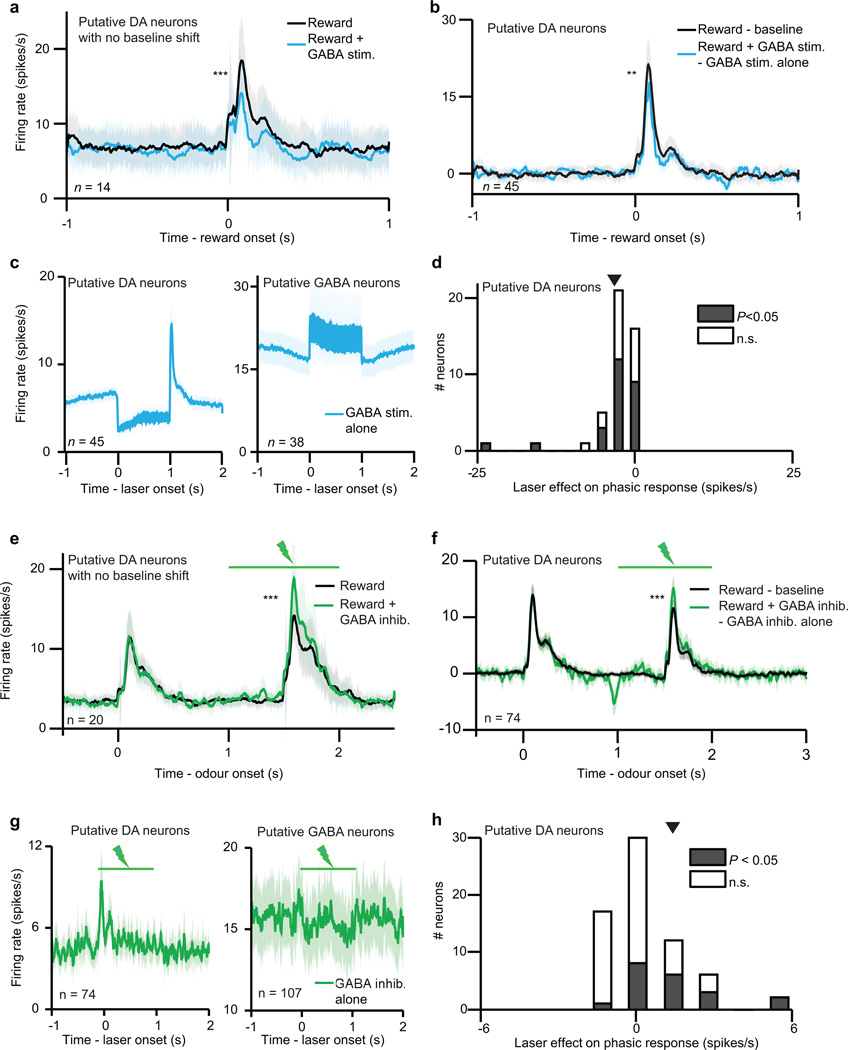
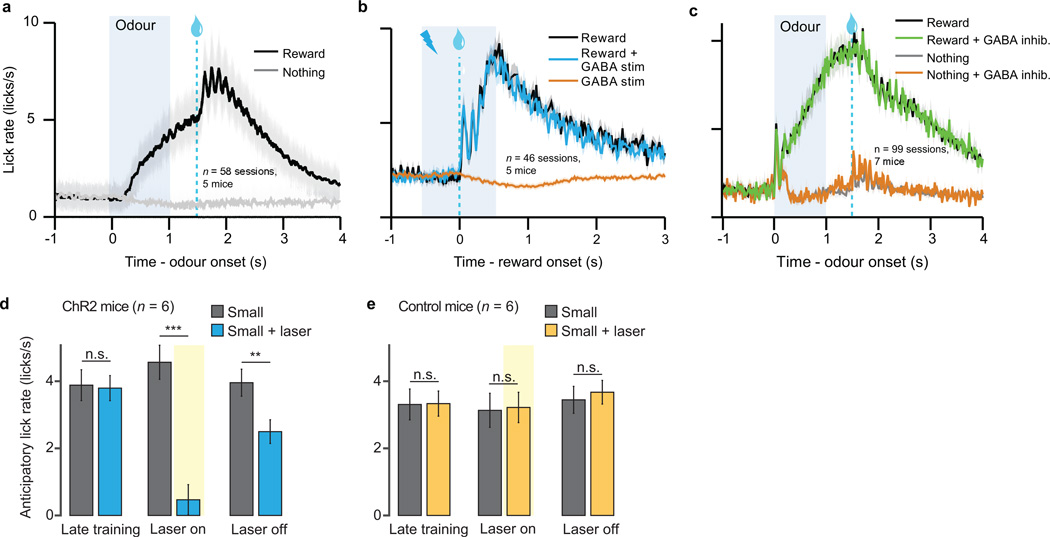
Next we assessed how VTA GABA stimulation affected putative dopamine neuron responses to reward. As expected, GABA stimulation significantly suppressed dopamine reward responses (P < 0.001, t-test; example neuron, Extended Data Fig. 4e; population, Fig. 2c). This suppression could not be fully explained by a shift in baseline activity (Extended Data Fig. 7a–d). Moreover, the dopamine suppression was not due to an association between blue light and reward, as laser delivery failed to elicit expectation-related licking behaviour (Extended Data Fig. 8b). Indeed, a separate group of control mice (n = 2) expressing GFP rather than ChR2 in GABA neurons (Extended Data Fig. 2g–i) showed no effect of laser stimulation (P = 0.78, Fig. 2e–f).
We confirmed that stimulating VTA GABA neurons suppresses phasic dopamine activity, but what is the shape of this suppression? As in our previous experiment, we determined a dopamine dose-response curve and fit both subtractive and divisive models. We found that the effect of VTA GABA stimulation was subtractive (P < 0.05, bootstrap; Fig. 2d and Extended Data Fig. 6f–g). This subtractive effect held even when correcting for the baseline-lowering effect of GABA stimulation (P < 0.05; see Methods and Extended Data Fig. 6h–i). We conclude that VTA GABA activation mimics the effect of temporal expectation on putative dopamine neurons.
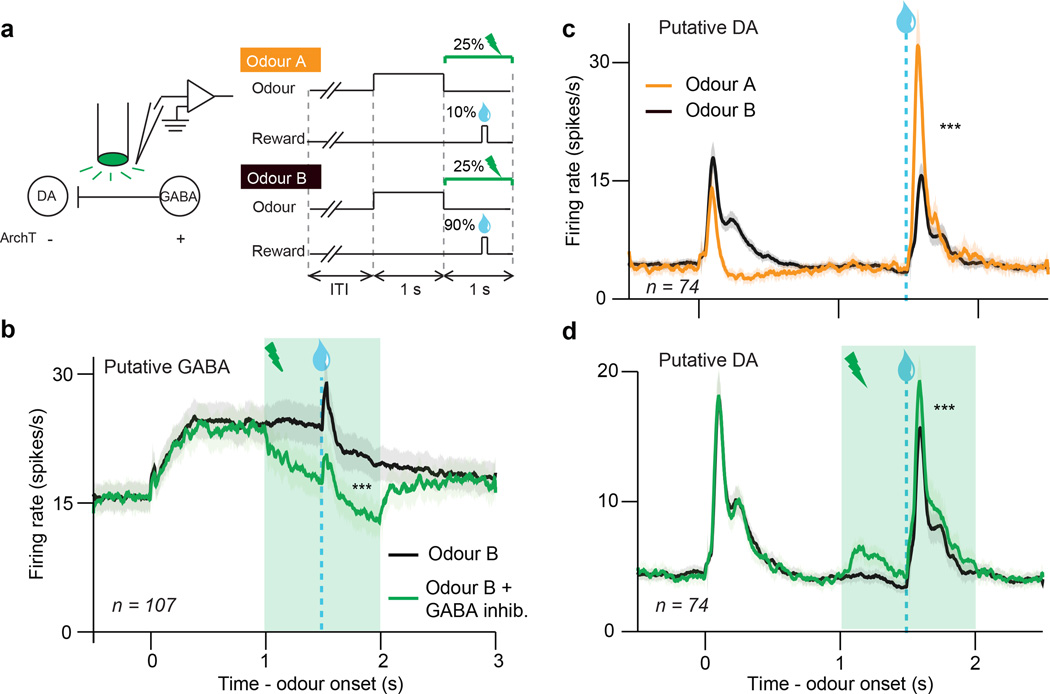
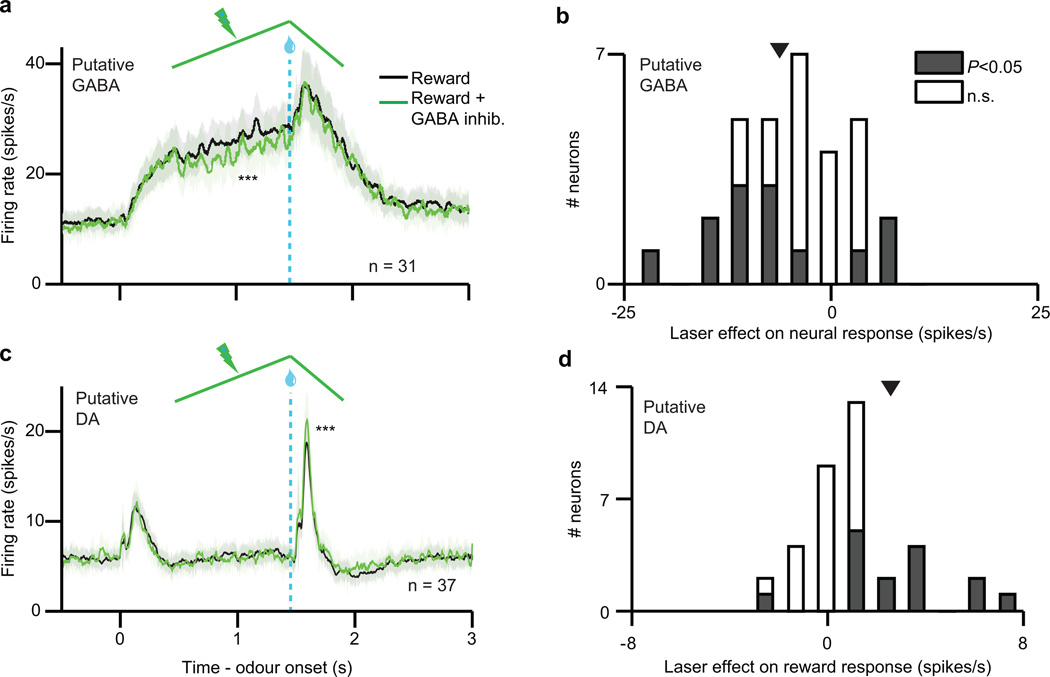
Although we show that VTA GABA activity can account for expectation-like changes in dopamine responses, this does not demonstrate that VTA GABA neurons normally play such a role. To strengthen the causal link between VTA GABA activity and dopamine prediction error coding, we inhibited VTA GABA neurons during their normal period of activity, and asked whether this disrupts dopamine prediction errors. In a separate group of mice (n = 7), the light-sensitive inhibitory proton pump archaerhodopsin (ArchT)21 was expressed selectively in VTA GABA neurons (Extended Data Figs. 1c, e–g, 9a–c). Mice were trained in a two-odour classical conditioning task, in which odour A predicted reward with 10 percent probability and odour B predicted reward with 90 percent probability (Fig. 3a). On 25 percent of the trials, we delivered green laser to activate ArchT and inhibit VTA GABA neurons for 1 s around reward outcome.
Figure 3. Selective inhibition of VTA GABA neurons modulates prediction errors.
a, GABA inhibition recording paradigm (left) and task (right). b, Firing rate (mean ± s.e.m) of putative VTA GABA neurons during odour B trials with (green) or without (black) laser delivery. ***, P < 0.001, paired t-test. c, Firing rate (mean ± s.e.m) of putative dopamine neurons when reward was delivered after odour A (orange) or odour B (black). ***, P < 0.001, paired t-test. d, Same as b except for putative dopamine neurons. ***, P < 0.001, paired t-test.
We first confirmed that laser stimulation significantly suppressed expectation-related activity in putative VTA GABA neurons (P = 0.001, t-test; individual neurons, Extended Data Fig. 4f, h; population, Fig. 3b). Next, we assessed how inhibiting VTA GABA neurons modified dopamine activity. Normally, putative dopamine neurons had reduced reward responses when a cue predicted reward delivery (P < 0.001, paired t-test; Fig. 3c). Inhibiting VTA GABA neurons partially reversed this expectation-dependent reduction (individual dopamine neurons, Extended Data Fig. 4g, i; population, Fig. 3d). Thus, when VTA GABA neurons are inhibited, dopamine neurons respond as if reward is less expected. This change was specific to phasic reward responses, and not due solely to a shift in baseline activity (Extended Data Figs. 7e–h, 10). Combined with our ChR2 experiment, these results suggest that VTA GABA neurons play a causal role in dopamine prediction error coding. In particular, they help provide the burst-canceling expectation signal long anticipated by models of reinforcement learning16,18,22.
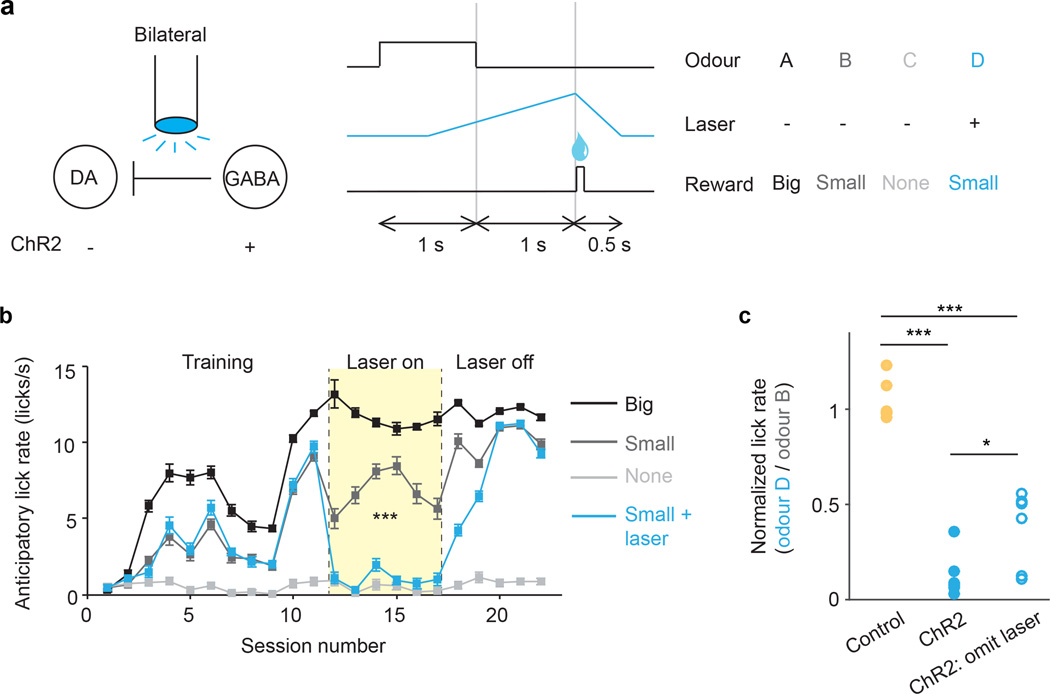
In Figs. 2–3, we report that VTA GABA manipulation modulates dopamine prediction error responses. However, our unilateral optogenetic paradigm did not modify mouse behaviour. To determine if the VTA GABA expectation signal is important for learning, we designed an additional experiment with bilateral manipulation. In a separate group of mice (n = 6), ChR2 was expressed selectively in VTA GABA neurons bilaterally. The mice performed a 4-odour classical conditioning task, in which odour A was associated with large reward, odours B and D were associated with small reward, and odour C was associated with no reward (Fig. 4a). After training, odour D trials were paired with VTA GABA stimulation. Importantly, the odour-reward associations always remained the same. Our hypothesis was that over time, laser stimulation would reduce dopamine prediction error responses for odour D. As a result, the expected value of odour D should decrease, and mice should lick less for odour D compared to odour B, even though the reward was the same. Indeed, this is what we found: after laser was introduced, mice licked significantly less for odour D than for odour B (P < 0.001, laser x odour interaction, mixed effects linear model, Fig. 4b and Extended Data Fig. 8d). This reduction did not occur in a separate group of control mice (n = 6) that did not express ChR2 (Extended Data Fig. 8e). Although there was likely a direct effect of GABA stimulation on licking behaviour, as previously discovered14, this cannot account for the entire difference, because the reduction remained significant on probe trials, where odour D was not paired with laser (Fig. 4c). In other words, previous laser trials caused the mice to learn a new, reduced value for odour D, which persisted even in the absence of laser. In the prediction-error framework, this new value may have been learned through GABA-induced dips in dopamine firing (see Supplementary Information). Consistent with our physiology results, our behavioural findings imply an important role for VTA GABA neurons in prediction-error learning.
Figure 4. Bilateral excitation of VTA GABA neurons disrupts learned association.
a, Schematic of optogenetic paradigm (left) and behavioural task (right). b, For a representative mouse (one of six mice injected with ChR2), anticipatory licks during each session (mean ± s.e.m. across trials) for odours A (black), B (dark grey), C (light grey), and D (blue). For sessions 12–17 (pale yellow), odour D was paired with laser. ***, P < 0.001, laser x odour interaction, mixed effects model. c, Ratio of anticipatory licks for odour D vs. odour B during laser sessions. Circles, mice injected with ChR2 (blue) or GFP (yellow). Open circles, probe trials, where laser was omitted after odour D. *, P < 0.05; ***, P < 0.001; Wilcoxon rank-sum.
Our study provides the first direct evidence for the arithmetic of dopamine prediction errors. Subtraction is an ideal process for prediction-error coding because it maintains a faithful separation between expected and unexpected rewards, even at the extremes of reward size (Extended Data Fig. 6a). Indeed, most, if not all, reinforcement learning models have used subtraction to compute prediction error. However, although cortical pyramidal neurons appear capable of subtracting GABA input23–25, and modeling studies have explored the biophysics of this process26–28, surprisingly few examples of subtraction have been observed in natural settings in vivo29,30. Our finding that reward expectation reduces dopamine reward responses in a purely subtractive manner sheds light on how such a computation can emerge from a network of neurons, and may provide a framework for other prediction-related processes in the brain.
METHODS
Animals
We used 33 adult male mice, backcrossed for >5 generations with C57/BL6J mice, that were heterozygous for Cre recombinase under the control of either the DAT gene (B6.SJL-Slc6a3tm1.1(cre)Bkmn/J, The Jackson Laboratory)31 or the Vgat gene (Vgat-ires-Cre)32. Five animals were used in the dopamine-identification task (Fig. 1), seven in the GABA stimulation task (Fig. 2), nine in the GABA inhibition task (Fig. 3), and 12 in the behavioural experiment (Fig. 4). Animals were housed on a 12 h dark/12 h light cycle (dark from 07:00 to 19:00) and performed the task at the same time each day. In the behavioural experiment, animals were randomly assigned to either the experimental or control group, and the experimenters were blinded to the assignment during all surgeries, behavioural sessions, and individual mouse analyses. All procedures were approved by the Harvard University Institutional Animal Care and Use Committee.
Surgery and viral injections
All surgeries were performed under aseptic conditions with animals under either ketamine/medetomidine (60 and 0.5 mg/kg, intraperitoneal, respectively) or isoflurane (1–2% at 0.5–1.0 L/min) anaesthesia. Analgesia (ketoprofen, 5 mg/kg intraperitoneal; buprenorphine, 0.1 mg/kg, intraperitoneal) was administered postoperatively. For the recording experiments, mice underwent two surgeries, both stereotactically targeting left VTA (from bregma: 3.0 mm posterior, 0.8 mm lateral, 4–5 mm ventral). In the first surgery, we injected 200–500 nl adeno-associated virus (AAV) to enable cell-type identification or manipulation (see below). After 2–4 weeks, we performed a second surgery to implant a head plate and microdrive containing 6–8 tetrodes and an optical fibre, as described6. Recording sites are displayed in Extended Data Fig. 1. For the behavioural experiment, mice underwent a single surgery in which we injected 500 nl AAV into VTA bilaterally, and then implanted a headplate and a dual-optic fibre cannula (300 µm diameter, Doric Lenses, Montreal, Canada) custom-designed to target bilateral VTA.
The viral injections differed between the four experiments. In the dopamine identification experiment (Fig. 1), we injected AAV (serotype 5) carrying an inverted ChR2 (H134R) fused to the fluorescent reporter eYFP and flanked by double loxP sites33,34. We previously showed that expression of this virus in dopamine neurons is highly selective and efficient6. In both the GABA stimulation experiment (Fig. 2) and the behavioural experiment (Fig. 4), we injected the same AAV-FLEX-ChR2-eYFP construct or, for control mice, we injected AAV5-GFP (University of North Carolina Vector Core). Finally, in the GABA inhibition experiment (Fig. 3), we injected AAV (serotype 1 or 8) carrying an inverted ArchT21 fused to the fluorescent reporter GFP and flanked by double loxP sites (University of North Carolina Vector Core). Expression of ArchT was almost 100 percent selective to GABA neurons and about 50 percent efficient, for both AAV1 and AAV8 (Extended Data Fig. 1e–g). In both the ChR2 and ArchT experiments, no virus-expressing cell bodies were observed distant from the injection site (e.g., in the striatum or the cortex), implying that the virus was not taken up by axons in the VTA and transported retrogradely to input areas.
Behavioural paradigms
After more than 1 week of recovery, mice were water-restricted in their cages. Weight was maintained above 90% of baseline body weight. Animals were head-restrained and habituated for 1–2 days before training. Odours were delivered with a custom-made olfactometer35. Each odour was dissolved in mineral oil at 1/10 or 1/100 dilution. Thirty microliters of diluted odour was placed inside a filter-paper housing, and then further diluted with filtered air by 1:20 to produce a 1,000 ml/min total flow rate. Odours included isoamyl acetate, (+)-carvone, 1-hexanol, p-cymene, ethyl butyrate, and 1-butanol, and differed for different animals. In the recording experiments, licks were detected by breaks of an infrared beam placed in front of the water tube. In the behavioural experiments, licks were detected by contact with a water tube connected to a capacitative sensing circuit (Teensy, PJRC, Sherwood, Oregon).
Each trial began with 1 s odour delivery, followed by a delay (either 0.5 s or 1 s), and a reward outcome. In the dopamine identification experiment (Fig. 1), the outcome ranged from 0.1 µL to 20 µL water; in the GABA stimulation experiment (Fig. 2), the outcome ranged from 0.3 µL to 10 µL water; in the GABA inhibition experiment (Fig. 3), the outcome was either 0 µl or 3.75 µl water; and in the behavioural experiment (Fig. 4), the outcome was 0, 2, or 5 µl water. Inter-trial intervals were drawn from an exponential distribution (mean: 7.6 s), resulting in a flat hazard function such that mice had constant expectation of when the next trial would begin. The tasks were purely classical conditioning: the behaviour of the mice had no effect on the outcomes. Animals performed between 300 and 700 trials per session.
The dopamine identification experiment (Fig. 1) included three trial types, randomly intermixed. In trial type 1 (45% of all trials), an odour was delivered for 1 s, followed by a 0.5 s delay and a reward chosen pseudorandomly from the following set: 0.1, 0.3, 1.2, 2.5, 5, 10, or 20 µl. The frequency of each reward size was chosen to make the average reward approximately 5 µl. Reward sizes were determined by the length of time the water valve remained open: 4, 12, 25, 45, 75, 140, or 250 ms, respectively. In trial type 2 (45% of all trials), rewards of various sizes were delivered without any preceding odour. The reward sizes were identical to trial type 1. In these trials, the reward itself was considered the start of the trial, to ensure a flat hazard function. Comparing trial types 1 and 2 allowed us to determine how a constant level of expectation modulated responses to different sizes of reward. In trial type 3 (10% of all trials), a different odour was delivered, which was followed by no outcome. This trial type was included to ensure that the animals learned the task: they began to lick after the odour in trial type 1 but not after the odour in trial type 3 (Extended Data Fig. 8a).
The GABA stimulation experiment (Fig. 2) mimicked the dopamine identification experiment, but instead of delivering a reward-predicting odour, we used a blue laser to directly activate VTA GABA neurons. The experiment included three randomly interleaved trial types. In trial type 1 (5% of trials), rewards were delivered unexpectedly, in the absence of laser stimulation. Reward sizes were chosen pseudorandomly from the following set: 0.3, 1.2, 2.5, 5, or 10 µl. Each reward size was equally frequent. In trial type 2 (5% of trials), rewards were also delivered unexpectedly, but now in the presence of laser stimulation. The laser was delivered at 40 Hz for a total of 1 s, and reward was delivered in the middle of this period. In trial type 3 (90% of trials), laser was delivered at 40 Hz for a total of 1 s, but no reward was delivered. The reason for the prevalence of this trial type was to ensure that mice did not associate the laser (which they might have seen, despite attempts to mask the light by painting the fibre black) with reward delivery.
In the GABA inhibition experiment (Fig. 3), each trial began with one of two odours, selected pseudorandomly. One odour predicted water reward with 10% probability and the other odour predicted water reward with 90% probability. On 25% of these trials, 1 s of continuous green laser was administered, beginning at odour onset and lasting until 0.5 s after reward was delivered. This encompassed both the delay between odour and reward (1 – 1.5 s) and the reward response period (1.5 – 2 s), which are the times in which VTA GABA neurons normally fire6. Laser stimulation did not affect licking behaviour (Extended Data Fig. 8c). At the beginning and end of each recording session, we delivered 1-s periods of green laser without any odours or rewards, to assess how GABA inhibition modulated dopamine baseline activity.
The behavioural experiment (Fig. 4) included four trial types, each associated with a different odour. The four trial types were pseudo-randomly interleaved and equally likely. Odour A was associated with big reward (5 µl), odours B and D were associated with small reward (2 µl), and odour C was associated with no reward. After training, when the mice consistently associated the odours with reward (as demonstrated by their anticipatory licking behaviour), blue laser was paired with odour D trials. Laser was delivered for 2.5 s, beginning 0.5 s after odour onset and ending 0.5 s after reward onset. The intensity of light was modulated in a ramping fashion (see below). After 6–8 sessions using the laser, the laser was turned off for the remaining 4–5 sessions, allowing us to examine whether the effect of laser stimulation would persist even in the absence of laser. Additionally, to clarify whether behaviour changes reflected learning or a direct effect of VTA GABA stimulation on licking, we included probe trials in the final 2–3 laser sessions. During these probe sessions, 10 percent of odour B trials randomly received laser stimulation, and 10 percent of odour D trials randomly omitted the laser.
Electrophysiology
Recording techniques were based on a previous study6. Briefly, we recorded extracellularly from VTA using a custom-built, screw-driven microdrive containing six or eight tetrodes (Sandvik, Palm Coast, Florida) glued to a 200 µm optic fibre (ThorLabs). Tetrodes were affixed to the fibre so that their tips extended 300–600 µm from the end of the fibre. Neural and behavioural signals were recorded with a DigiLynx recording system (Neuralynx) or a custom-built system using a multi-channel amplifier chip (RHA2116, Intan Technologies LLC) and data acquisition device (PCIe-6351, National Instruments). Broadband signals from each wire were filtered between 0.1 and 9000 Hz and recorded continuously at 32 kHz. To extract spike timing, signals were band-pass-filtered between 300 and 6000 Hz and sorted offline using SpikeSort3D (Neuralynx) or MClust-3.5 (A. D. Redish). At the end of each session, the fibre and tetrodes were lowered by 40–80 µm to record new units the next day.
To be included in the dataset, a neuron had to be well-isolated (L-ratio36 < 0.05) and recorded within 0.5 mm of a light-identified or putative dopamine neuron, to ensure that it was recorded in VTA. Recording sites were also verified histologically with electrolytic lesions using 10–15 s of 30 µA direct current.
Laser delivery
To identify neurons as dopaminergic or GABAergic, we used ChR2 to observe laser-triggered spikes6,37,38. The optical fibre was coupled with a diode-pumped solid-state laser with analogue amplitude modulation (Laserglow Technologies). At the beginning and end of each recording session, we delivered trains of 10 blue (473 nm) light pulses, each 5 ms long, at 1, 10, 20 and 50 Hz, with an intensity of 5–20 mW/mm2 at the tip of the fibre. Spike shape was measured using a broadband signal (0.1 – 9,000 Hz) sampled at 32 kHz.
In the GABA stimulation experiment (Fig. 2), we used the same blue laser to deliver 40 pulses (5 ms duration, 40 Hz) during selected trials. In the GABA inhibition experiment (Fig. 3), we used one of two methods of laser delivery. For seven mice (Extended Data Fig. 9a–c), we used an electronic shutter (Vincent Associates) to deliver 1 s intervals of continuous green laser (532 nm, Laserglow Technologies), with an intensity of ~50 mW/ mm2 at the tip of the fibre. For a separate group of two mice (Extended Data Figs. 9d–f, 10), we instead modulated laser intensity in an analog fashion, beginning at 0 intensity 0.5 s after odour onset, smoothly increasing intensity to a peak of 50 mW/ mm2 at reward delivery, and then gradually decreasing off over the next 0.5 s. This ramping protocol was also used for the behavioural experiment (Fig. 4), using a 473 nm laser (OptoEngine) and beam splitter (Doric Lenses) to deliver blue light bilaterally. The ramping intensity profile was chosen to approximate the response pattern of VTA GABA neurons6.
Data analysis
Peristimulus time histograms (PSTHs) were constructed using 1 ms bins and then convolved with a function resembling a postsynaptic potential, (1-exp(−t))*(exp(−t/20), for time t in ms. Average firing rates in response to reward were calculated using a 600 ms window after reward onset for the dopamine identification and GABA stimulation experiments, and a 500 ms window after reward onset for the GABA inhibition experiment. These windows were chosen to reflect the full duration of the neural response to reward. Window sizes ranging from 300–1000 ms were attempted and gave qualitatively similar results. To calculate reward response, we subtracted baseline firing (averaged over 1 second before trial onset). Calculating the baseline using different windows (e.g., 600 ms before reward onset) did not change the results. To ensure reliability, analyses of particular trial types only included neurons that were recorded during at least five presentations of that trial type.
To identify neurons as dopaminergic or GABAergic, we used the Stimulus-Associated spike Latency Test (SALT38) to determine whether light pulses significantly changed a neuron’s spike timing (Extended Data Fig. 3). We used a significance value of P < 0.001. To ensure that spike sorting was not contaminated by light artifacts, we also calculated waveform correlations between spontaneous and light-evoked spikes, as described6. All light-identified neurons had Pearson’s correlation coefficients > 0.9.
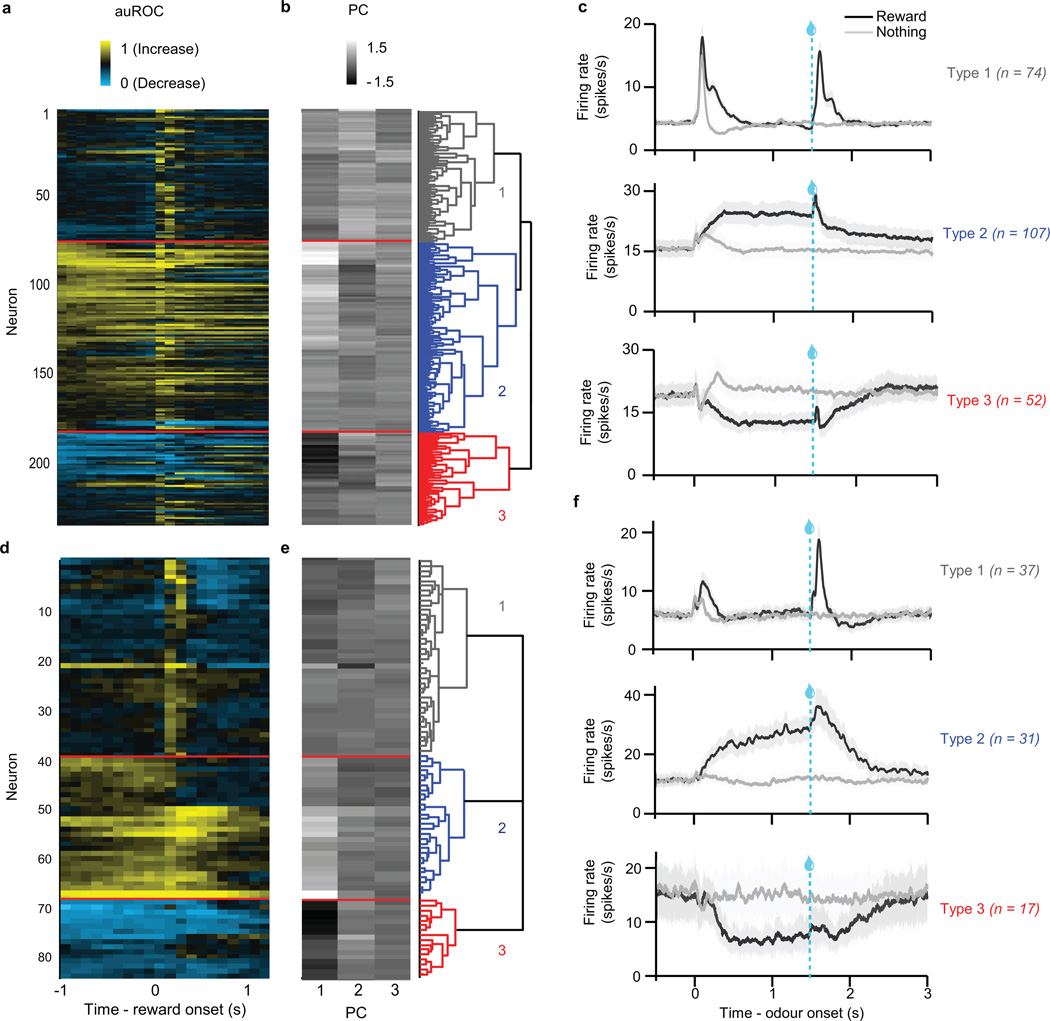
In all three recording experiments, we identified putative dopamine and GABA neurons based on their firing patterns through an unsupervised clustering approach (Extended Data Figs. 2, 9), similar to a previous study6. Briefly, receiver-operating characteristic (ROC) curves for each neuron were calculated by comparing the distribution of firing rates across trials in 100 ms bins (starting 1 s before expected reward and ending 1 s after expected reward) to the distribution of baseline firing rates (1 s before trial onset). PCA was calculated using the singular value decomposition of the area under the ROC. Hierarchical clustering was then done using the first three principal components of the auROC using a Euclidean distance metric and complete agglomeration method.
As described6, this method produced three clusters: one with phasic excitation to reward (Type 1), one with sustained excitation to reward expectation (Type 2), and one with sustained suppression to reward expectation (Type 3). Type 1 neurons were classified as putatively dopaminergic. Forty out of 43 light-identified dopamine neurons fell into this cluster; the other three light-identified dopamine neurons showed phasic suppression to reward and were clustered as Type 3. Since these three dopamine neurons showed qualitatively different responses than the others, they were not included in the dataset. Note that although we focus on identified dopamine neruons, our main findings are identical if we include all putative dopamine neurons (Extended Data Fig. 6b–c).
Type 2 neurons were classified as putatively GABAergic. Eleven of 14 identified GABA neurons were clustered as Type 2; the other three were inhibited by reward and were clustered as Type 3. Again, these three GABA neurons were not included in the dataset. Unlike Type 1 neurons, Type 2 neurons did not respond to either expected or unexpected reward in a consistently size-dependent fashion (Extended Data Fig. 5). This contrasts with their delay activity, which increases with increasing reward expectation6.
The distribution of neurons across mice for all recording experiments is provided in Supplementary Table 1.
To determine the dose-response of dopamine neurons and see whether expectation caused a subtractive or divisive effect (Fig. 1c), we based our analysis on a previous study39. We first fit a hyperbolic ratio function (Hill function) to the unexpected reward data:
| (1) |
The function had two free parameters: fmax, the saturating firing rate; and σ, the reward size that elicits half-maximum firing rate. We chose an exponent of 0.5 after fitting the data with exponents ranging from 0.1 to 2.0 (in steps of 0.1), and finding the exponent with the lowest mean squared error. Note that the Hill function is not the only possible function that could fit our data. For example, the power function f(r) = ark, where a = 3.73 and k = 0.39, also did an excellent job. However, this function does not saturate, so we thought it was less likely to represent neuronal responses. The conclusions of this manuscript do not depend on the exact function chosen to fit the data.
After fitting the unexpected reward data, we explored what simple transformation could best mimic the effect of expectation. We tested four options: input subtraction, input division, output subtraction, and output division (Extended Data Fig. 6a). Specifically, we evaluated the following four models39:
| (2) |
| (3) |
| (4) |
| (5) |
In each case, we used the fmax and σ values determined by the unexpected reward data. The only new parameter was the expectation factor E, which we fit separately for each of the four models. Output subtraction consistently gave the best fit (lowest mean squared error), for the population and most individual neurons. The next best model was generally output division. We statistically compared model-fits using a bootstrapping analysis: we resampled the data 1000 times and determined for each resample the mean squared error for both output subtraction and output division. We calculated the P value by counting the number of resamples when the mean squared error was better for output division than for output subtraction (e.g., if 1 resample out of 1,000 preferred output division over output subtraction, P = 0.001; Extended Data Fig. 6c). These steps were repeated for putative dopamine neurons in the GABA stimulation experiment (Fig. 2d).
As a complementary analysis to determine whether expectation had a subtractive or divisive effect on dopamine reward responses, we calculated the difference between unexpected and expected reward responses for different reward sizes (Fig. 1d). We then ran a linear regression to determine if the slope of this difference was significantly different from zero. A slope of zero would be consistent with output subtraction, as expectation would have the same effect on all responses. A slope greater than zero would be consistent with output division, as expectation would have a larger effect on larger responses. All but five of the light-identified dopamine neurons had a slope no different than zero (Extended Data Fig. 4c).
In our GABA stimulation and inhibition experiments, we wanted to ensure that laser delivery affected phasic dopamine responses in addition to shifting baseline dopamine activity. First, we identified putative dopamine neurons that did not significantly change their baseline firing upon laser delivery. To do so, we calculated firing rates in the 0.5 s before reward delivery on both laser trials and no-laser trials. Neurons with P > 0.05 (Wilcoxon rank-sum) were identified as unaffected by laser delivery. In both the GABA stimulation and GABA inhibition experiments, these neurons continued to be affected at the time of reward (Extended Data Fig. 7a, e). Second, we recorded from putative dopamine neurons while manipulating VTA GABA activity outside the task (Extended Data Fig. 7c, g). This gave us an unbiased sense of how VTA GABA stimulation or inhibition affected dopamine baseline responses. We then subtracted these laser-alone trials from trials where laser was delivered during reward (Extended Data Fig. 7b, f). Any remaining change at the time of reward should not be due to a baseline shift.
Interestingly, the baseline shift may have been an artifact of the type of laser stimulation we applied. In a separate experiment (n = 2 mice, Extended Data Fig. 9d–f), we applied the laser so that light intensity would ramp up rather than remain constant over the course of a trial, more closely mimicking the physiological responses of VTA GABA neurons. We found that this ramping stimulation successfully inhibited putative VTA GABA neurons (P = 0.001, t-test, Extended Data Fig. 10a–b) and increased reward responses in putative dopamine neurons (P < 0.001, t-test, Extended Data Fig. 10c–d) without causing a baseline shift.
To assess how well VTA GABA stimulation mimics odour expectation, we also directly compared the magnitude of change in dopamine responses in both experiments. In the odour-based experiment (Fig. 1), the average suppression of dopamine reward responses was 52.7 percent, compared to 43.5 percent for the VTA GABA stimulation experiment (Fig. 2; P < 0.05, t-test). This difference may be accounted for by variation among putative dopamine neurons in their response to laser. Although 40/45 putative dopamine neurons were suppressed by GABA stimulation, 5 were activated, perhaps through disynaptic disinhibition, as VTA GABA neurons are known to synapse onto each other as well as onto dopamine neurons13. In addition, there may be other neurons, besides VTA GABA neurons, that help suppress dopamine responses when reward is expected.
Although we focus on changes in dopamine neuron response magnitude, this was not the only effect of reward expectation. Notably, the latency to peak response was also extended, from an average of 67.6 ms to 95.4 ms (P = 0.001, t-test). The latency increased in 37/40 dopamine neurons that we recorded. The downstream consequences of this change in latency remain to be elucidated.
Comparisons were performed with t-tests (for population data) or Wilcoxon rank-sum tests (for individual neuron data), with corrections for multiple comparisons (Bonferroni or Tukey). Correlations were done with Pearson’s rho. P values less than 0.05 were considered significant, unless otherwise noted. Given pilot data showing effects of optogenetic manipulation of ~2 spikes/s, with variability of ~3 spikes/s, 36 neurons were required for 80% power to detect the effect. Given about 10 neurons of each type per mouse, we aimed for at least four mice per experiment. Analyses were done with Matlab (Mathworks).
In the behavioural experiment (Fig. 4), the strength of the learned association between each odour and reward was estimated by counting the number of anticipatory licks over the 2 s from odour onset to reward delivery. For the analysis in Fig. 4b and Extended Data Fig. 8d–e, we excluded data from probe trials. Population results were examined using a mixed-effects linear model. The fixed effects included trial type and a binary variable indicating whether the session included laser delivery. The random effect was mouse identity. The outcome of interest was an interaction between trial type and laser. Results were robust to different choices of window for counting anticipatory licks.
Immunohistochemistry
After recording for 4–8 weeks, mice were given an overdose of ketamine/medetomidine, exsanguinated with saline, and perfused with 4% paraformaldehyde. Brains were cut in 100 µm coronal sections on a vibrotome and immunostained with antibodies to tyrosine hydroxylase (AB152, 1:1000, Millipore) to visualize dopamine neurons and 49,6-diamidino-2-phenylindole (DAPI, Vectashield) to visualize nuclei. Virus expression was determined through eYFP fluorescence. Slides were examined to verify that the optic fibre track was among VTA dopamine neurons and in a region expressing the virus. For the GABA inhibition experiment, two Vgat-tdTomato mice were injected with AAV-FLEX-ArchT-GFP in order to determine the selectivity and efficiency of ArchT expression in VTA GABA neurons (Extended Data Fig. 1e–g). One mouse was injected with AAV serotype 1 and the other with AAV serotype 8. For the figure, brightness and contrast were adjusted in Photoshop (Adobe).
Extended Data
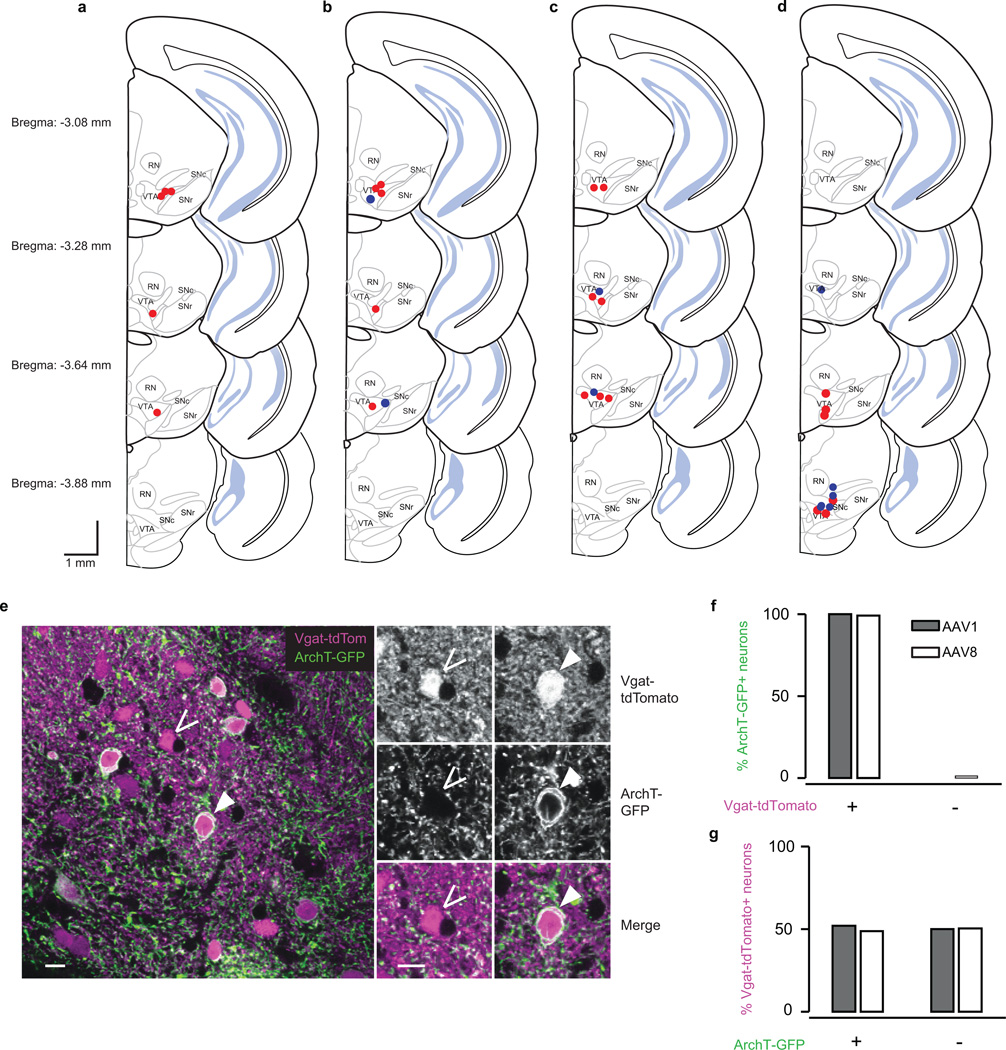
Extended Data Fig. 1. Recording sites and ArchT expression.
a–d, Schematic of recording locations for mice used in the dopamine identification task (a, n = 5), the GABA stimulation task (b, n = 7), the GABA inhibition task (c, n = 9), and the behavioural task (d, n = 12). b, Red, experimental mice expressing ChR2 in VTA GABA neurons (n = 5). Blue, control mice expressing GFP in VTA GABA neurons (n = 2). c, Red, mice in which laser was delivered at continuous intensity (n = 7). Blue, mice in which laser was delivered with ramping intensity (n = 2). d, Red, experimental mice expressing ChR2 in VTA GABA neurons (n = 6). Blue, control mice expressing GFP in VTA GABA neurons (n = 6). e–g, Selectivity and efficiency of ArchT expression. e, Representative merged image (one of 30 Z-stacks). Magenta, Vgat-tdTomato; green, ArchT-GFP. Open arrow, neuron expressing Vgat-tdTomato but not ArchT-GFP. Closed arrow, neuron expressing both Vgat-tdTomato and ArchT-GFP. Scale bar is 10 µm. f, Selectivity of infection to GABA neurons: percentage of ArchT-GFP-expressing neurons (n = 131 neurons for AAV1 and 165 neurons for AAV8) that were positive for Vgat-tdTomato. Filled bars, Vgat-tdTomato mouse injected with AAV1-FLEX-ArchT-GFP. Empty bars, Vgat-tdTomato mouse injected with AAV8-FLEX-ArchT-GFP. g, Efficiency of infection: percentage of Vgat-tdTomato-expressing neurons (n = 278 neurons for AAV1 and 283 neurons for AAV8) that were positive for ArchT-GFP.
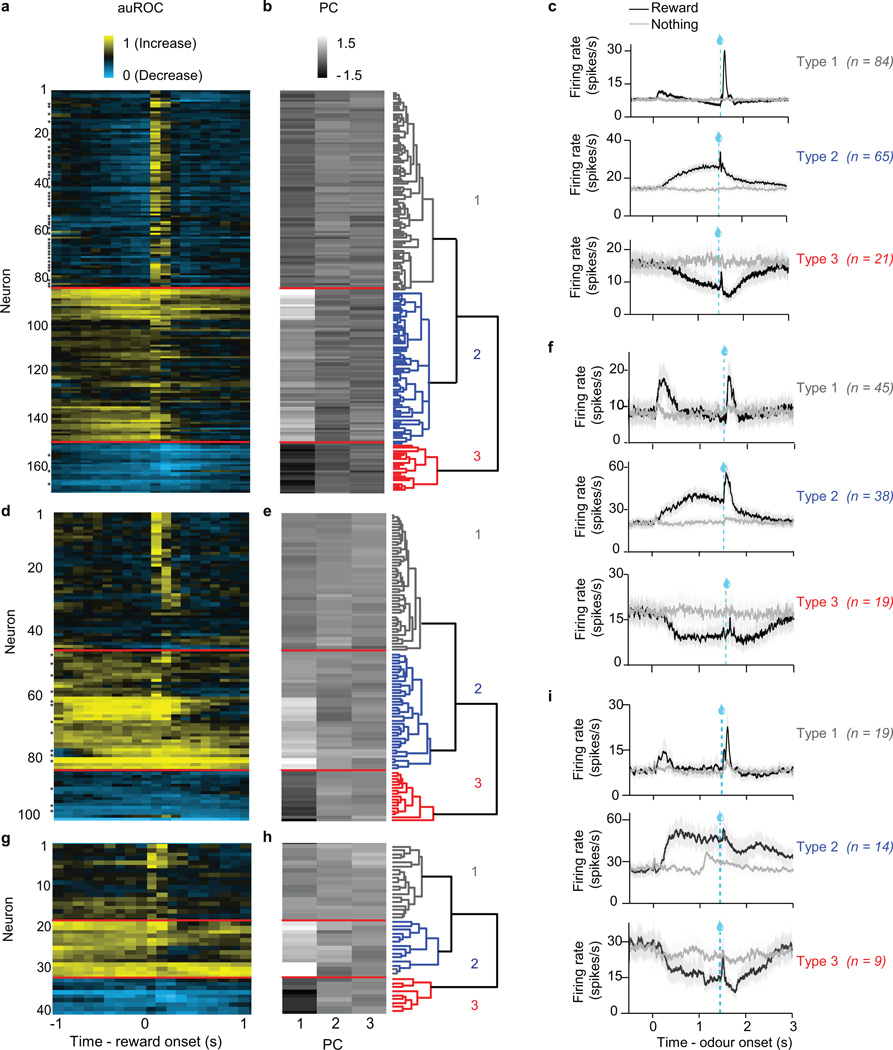
Extended Data Fig. 2. Neuron classification for dopamine identification and GABA stimulation experiments.
a–c, Dopamine identification experiment. d–f, ChR2-expressing animals in GABA stimulation experiment. g–i, GFP-expressing control animals in GABA stimulation experiment. a, d, g, Responses of all VTA neurons recorded in the tasks. Each row reflects the auROC values for a single neuron in the second before and after delivery of expected reward. Baseline is taken as one second before odour onset. Yellow, increase from baseline; cyan, decrease from baseline. Light-identified neurons are denoted by an * to the left of each column. b, e, h, The first three principal components of the auROC curves. These values were used for unsupervised hierarchical clustering, as shown in the dendrogram on the right. c, f, i, Average firing rates for the three clusters of neurons in each task. Odour was delivered for 1 s, followed by a 0.5 s delay and then reward delivery.
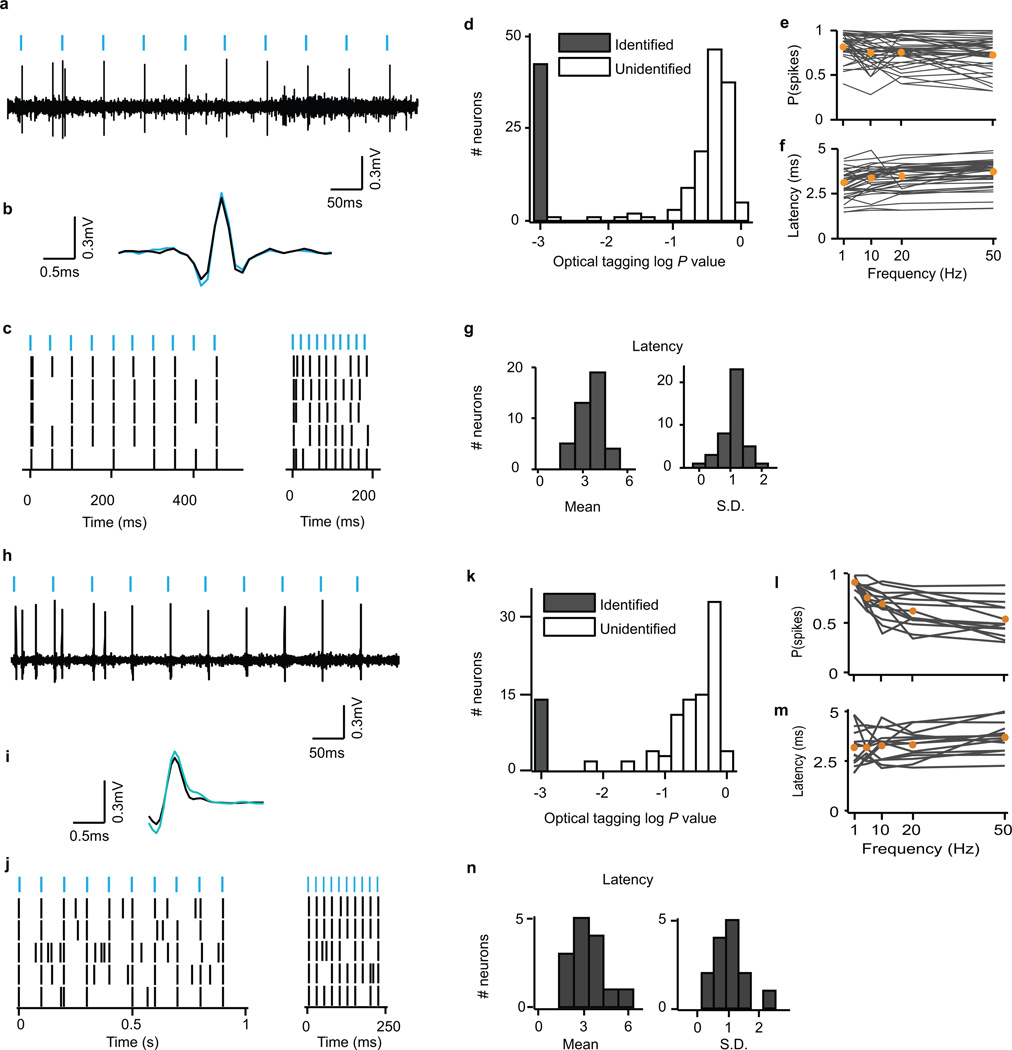
Extended Data Fig. 3. Light identification of dopamine and GABA neurons.
a, Raw signal from one example light-identified dopamine neuron. Blue bars, light pulses. b, For the same neuron, mean waveforms for spontaneous (black) and light-evoked (blue) action potentials. c, For the same neuron, raster plots for 20 Hz (left) and 50 Hz (right) laser stimulation. Each row is one trial of laser stimulation. d, Histogram of log P values for each neuron recorded in the dopamine identification experiment (n = 170). The P values were derived from SALT (see Methods). Neurons with P < 0.001 and waveform correlations > 0.9 were considered identified (filled bars). e, f, For light-identified neurons, probability of spiking (e) and latency to first spike (f) after laser pulses at different frequencies. Orange circles, mean across neurons. g, Histogram of mean latencies (left) and latency standard deviations (right) in response to laser stimulation for all light-identified dopamine neurons in the variable-reward task. h–n, Same conventions as a–g, but for neurons recorded in the GABA stimulation task (n = 102).
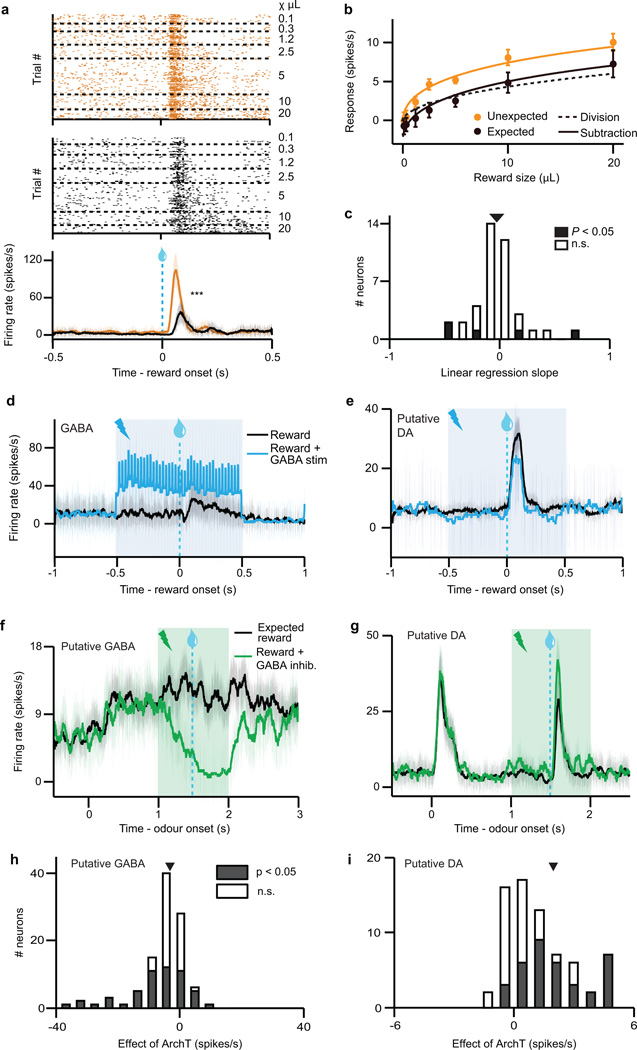
Extended Data Fig. 4. Individual neuron analysis from all recording experiments.
a–c, Results from dopamine identification experiment (Fig. 1). d, e, Results from GABA stimulation experiment (Fig. 2). f–i, Results from GABA inhibition experiment (Fig. 3). a, Raster plots (top and middle) and firing rate (bottom) of representative dopamine neuron in response to unexpected (orange) or expected (black) reward. ***, P < 0.001, t-test. b, For the same neuron, responses (mean ± s.e.m. across trials) to each reward size. Orange line, fit for unexpected reward. Dotted black line, divisive transformation. Solid black line, subtractive transformation. c, Individual neuron regression slopes for the analysis in Fig. 1d. Empty bars, slope not different from zero (P > 0.05). Filled bars, P < 0.05. Triangle, mean slope. d, e, Firing rate of example VTA GABA (d) and putative dopamine (e) neuron with (blue) and without (black) ChR2 stimulation. Light blue box, laser delivery. f, g, Firing rate of example VTA GABA (f) and putative dopamine (g) neuron during odour B trials with (green) or without (black) laser delivery. h, i, Histogram of putative GABA (h) and dopamine (i) neuron responses to laser delivery. Filled bars, significant effect of laser (P < 0.05, Wilcoxon rank-sum); empty bars, P > 0.05. Triangle, mean.
Extended Data Fig. 5. VTA GABA activity does not vary consistently with reward size.
a–c, Putative GABA neurons in the dopamine identification experiment (Fig. 1). d–f, Putative GABA neurons in the GABA stimulation experiment (Fig. 2). a, b, Average firing rate of putative GABA neurons to unexpected (a) or expected (b) rewards of various sizes. c, Population responses (mean ± s.e.m. across putative GABA neurons) for different reward sizes. Orange, unexpected reward. Black, expected reward. Responses were averaged over a 600 ms window after reward delivery. d, e, Average firing rate of putative GABA neurons to rewards of various sizes, delivered with (e) or without (d) optogenetic GABA stimulation. f, Population responses (mean ± s.e.m. across putative GABA neurons) for different reward sizes. Blue, reward with laser stimulation. Black, reward without laser stimulation. Responses were averaged over a 600 ms window after reward delivery.
Extended Data Fig. 6. Statistical test for subtraction versus division.
a, To understand how dopamine neurons compute reward prediction error, we first determined how dopamine neurons respond to various sizes of unexpected reward (schematized as orange curves). We then taught the mice to expect reward and observed how expectation shifted this dose-response (black curves). We modelled four types of shift: output subtraction (top left), input subtraction (bottom left), output division (top right), and input division (bottom right). Output subtraction was consistently the best fit. For equations, see Methods. Analysis adapted from a previous study39. b–e, Results from dopamine identification experiment. f-i, Results from GABA stimulation experiment. b, c, Results from all putative dopamine neurons (n = 84). ***, P < 0.001, bootstrap. d, e, Results from light-identified dopamine neurons (n = 40). ***, P < 0.001, bootstrap. f, g, Results from putative dopamine neurons in the GABA stimulation experiment (n = 45). *, P < 0.05, bootstrap. h, i, Results from putative dopamine neurons in the GABA stimulation experiment, subtracting the 500 ms period immediately prior to reward delivery. This takes into account the laser-induced baseline shift in dopamine responses. *, P < 0.05, bootstrap. b, d, f, h, Average responses (mean ± s.e.m. across neurons) to different sizes of reward, with fits for output subtraction (solid line) and output division (dotted line). c, e, g, i, Results of bootstrapping analysis. For each resample, we compared the mean squared error for the subtractive fit with the mean squared error for the divisive fit. Negative numbers favor subtraction. P values were calculated as the proportion of resamples in which division was a better fit than subtraction.
Extended Data Fig. 7. Laser effect is more than a baseline shift.
a–d, Results from GABA stimulation experiment. e-h, Results from GABA inhibition experiment. a, Firing rate (mean ± s.e.m.) of putative dopamine neurons that did not show a significant baseline shift. ***, P < 0.001, t-test. b, To visualize whether GABA stimulation preferentially affected phasic dopamine responses in addition to baseline firing rates, we took the activity in Fig. 2c and subtracted the trials when laser was delivered alone. Any remaining change at the time of reward could not be due to a baseline shift. **, P = 0.01, t-test. c, Firing rate (mean ± s.e.m.) of putative dopamine (left) and GABA (right) neurons on trials where laser was delivered in the absence of reward. This dopamine response was subtracted to calculate the firing rates in b. d, Histogram of the phasic effect of GABA stimulation. The values were calculated by subtracting the black line from the blue line in b. Empty bars, slope not different from zero (P > 0.05, Wilcoxon rank-sum). Filled bars, slope different from zero (P < 0.05). Triangle, mean (P < 0.001, t-test). e-h, Same conventions as a–d, but for the GABA inhibition experiment. ***, P < 0.001, t-test.
Extended Data Fig. 8. Behavioural performance on all four experiments.
a, In the dopamine identification task (Fig. 1), lick rates (mean ± s.e.m. across sessions) for odours predicting reward (black) or nothing (gray). b, In the GABA stimulation task (Fig. 2), lick rates (mean ± s.e.m. across sessions) for reward alone (black), reward + GABA stimulation (blue), and GABA stimulation alone (orange). c, In the GABA inhibition task (Fig. 3), lick rates (mean ± s.e.m. across sessions) for the odours predicting reward with 90% probability (black) and 10% probability (gray). Green laser was delivered to inhibit VTA GABA neurons on 25% of reward (green) and nothing (orange) trials. d, e, In the bilateral stimulation experiment (Fig. 4), anticipatory licks (mean ± s.e.m. across mice) for mice injected with ChR2 (d) and GFP (e). Gray bars, odour B; blue or yellow bars, odour D. Left, last three training sessions before odour D was paired with laser; Middle, last three sessions with laser delivery (excluding probe trials); Right, last three sessions after laser was turned off. **, P < 0.01; ***, P < 0.001; paired t-test.
Extended Data Fig. 9. Neuron classification for GABA inhibition experiment.
a–c, Mice in which laser was delivered with continuous intensity. d–f, Mice in which laser was delivered with ramping intensity. a, d, Responses of all VTA neurons recorded in the tasks. Each row reflects the auROC values for a single neuron in the second before and after delivery of expected reward. Baseline is taken as one second before odour onset. Yellow, increase from baseline; cyan, decrease from baseline. b, e, The first three principal components of the auROC curves. These values were used for unsupervised hierarchical clustering, as shown in the dendrogram on the right. c, f, Average firing rates for the three clusters of neurons in each task. Odour was delivered for 1 s, followed by a 0.5 s delay and then reward delivery.
Extended Data Fig. 10. Ramping laser stimulation eliminates baseline shift.
a, Firing rate (mean ± s.e.m.) of putative VTA GABA neurons during odour B trials with (green) or without (black) ramping laser delivery. ***, P < 0.001, t-test. b, Histogram of putative GABA neuron responses to laser delivery. Responses were averaged over the entire duration of the laser. Filled bars, significant effect of laser (P < 0.05, Wilcoxon rank-sum); empty bars, P > 0.05. Triangle, mean (P < 0.001, t-test). c, Firing rate (mean ± s.e.m.) of putative dopamine neurons with (green) or without (black) ramping GABA inhibition. ***, P < 0.001, t-test. d, Histogram of putative dopamine neuron responses to laser delivery. Responses were averaged over the 0.5 s window after reward delivery. Filled bars, significant effect of laser (P < 0.05, Wilcoxon rank-sum); empty bars, P > 0.05. Triangle, mean (P < 0.001, t-test).
Supplementary Material
Acknowledgments
We thank J. Assad, R. Born, J. Maunsell, R. Wilson, and members of the Uchida lab for comments on the manuscript; C. Dulac for sharing resources; K. Deisseroth for the AAV-FLEX-ChR2 construct; and E. Boyden for the AAV-FLEX-ArchT construct. This work was supported by a Sackler Fellowship in Psychobiology (N.E.) and NIH grants T32GM007753 (N.E.), F30MH100729 (N.E.), R01MH095953 (N.U.), and R01MH101207 (N.U.).
Footnotes
Supplementary information is linked to the online version of the paper at www.nature.com/nature.
Author contributions. N.E and N.U. designed the recording experiments. N.E., V.R., and N.U. designed the behaviour experiment. N.E., M.B., V.R., V.H., and J.T. collected data. N.E., M.B., and V.R. analysed data. N.E. wrote the manuscript with comments from N.U.
The authors declare no competing financial interests.
References
- 1.Schultz W, Dayan P, Montague PR. A neural substrate of prediction and reward. Science. 1997;275:1593–1599. doi: 10.1126/science.275.5306.1593. [DOI] [PubMed] [Google Scholar]
- 2.Bayer HM, Glimcher PW. Midbrain dopamine neurons encode a quantitative reward prediction error signal. Neuron. 2005;47:129–141. doi: 10.1016/j.neuron.2005.05.020. [DOI] [PMC free article] [PubMed] [Google Scholar]
- 3.Bush RR, Mosteller F. A mathematical model for simple learning. Psychol Rev. 1951;58:313–323. doi: 10.1037/h0054388. [DOI] [PubMed] [Google Scholar]
- 4.Rescorla RA, Wagner AR. In: Classical conditioning II: current research and theory. Black A, Prokasy W, editors. 1972. pp. 64–99. [Google Scholar]
- 5.Carandini M, Heeger DJ. Normalization as a canonical neural computation. Nat. Rev. Neurosci. 2012;13:51–62. doi: 10.1038/nrn3136. [DOI] [PMC free article] [PubMed] [Google Scholar]
- 6.Cohen JY, Haesler S, Vong L, Lowell BB, Uchida N. Neuron-type-specific signals for reward and punishment in the ventral tegmental area. Nature. 2012;482:85–88. doi: 10.1038/nature10754. [DOI] [PMC free article] [PubMed] [Google Scholar]
- 7.Tobler PN, Fiorillo CD, Schultz W. Adaptive coding of reward value by dopamine neurons. Science. 2005;307:1642–1645. doi: 10.1126/science.1105370. [DOI] [PubMed] [Google Scholar]
- 8.Silver RA. Neuronal arithmetic. Nat. Rev. Neurosci. 2010;11:474–489. doi: 10.1038/nrn2864. [DOI] [PMC free article] [PubMed] [Google Scholar]
- 9.Houk JC, Davis JL. Models Of Information Processing In The Basal Ganglia. MIT Press; 1995. [Google Scholar]
- 10.Kawato M, Samejima K. Efficient reinforcement learning: computational theories, neuroscience and robotics. Curr. Opin. Neurobiol. 2007;17:205–212. doi: 10.1016/j.conb.2007.03.004. [DOI] [PubMed] [Google Scholar]
- 11.Matsumoto M, Hikosaka O. Lateral habenula as a source of negative reward signals in dopamine neurons. Nature. 2007;447:1111–1115. doi: 10.1038/nature05860. [DOI] [PubMed] [Google Scholar]
- 12.Hong S, Jhou TC, Smith M, Saleem KS, Hikosaka O. Negative reward signals from the lateral habenula to dopamine neurons are mediated by rostromedial tegmental nucleus in primates. J. Neurosci. 2011;31:11457–11471. doi: 10.1523/JNEUROSCI.1384-11.2011. [DOI] [PMC free article] [PubMed] [Google Scholar]
- 13.Omelchenko N, Sesack SR. Ultrastructural analysis of local collaterals of rat ventral tegmental area neurons: GABA phenotype and synapses onto dopamine and GABA cells. Synapse. 2009;63:895–906. doi: 10.1002/syn.20668. [DOI] [PMC free article] [PubMed] [Google Scholar]
- 14.Van Zessen R, Phillips JL, Budygin EA, Stuber GD. Activation of VTA GABA Neurons Disrupts Reward Consumption. Neuron. 2012;73:1184–1194. doi: 10.1016/j.neuron.2012.02.016. [DOI] [PMC free article] [PubMed] [Google Scholar]
- 15.Tan KR, et al. GABA Neurons of the VTA Drive Conditioned Place Aversion. Neuron. 2012;73:1173–1183. doi: 10.1016/j.neuron.2012.02.015. [DOI] [PMC free article] [PubMed] [Google Scholar]
- 16.Hazy TE, Frank MJ, O’Reilly RC. Neural mechanisms of acquired phasic dopamine responses in learning. Neurosci Biobehav Rev. 2010;34:701–720. doi: 10.1016/j.neubiorev.2009.11.019. [DOI] [PMC free article] [PubMed] [Google Scholar]
- 17.Rivest F, Kalaska JF, Bengio Y. Conditioning and time representation in long short-term memory networks. Biol Cybern. 2014;108:23–48. doi: 10.1007/s00422-013-0575-1. [DOI] [PubMed] [Google Scholar]
- 18.Vitay J, Hamker FH. Timing and expectation of reward: a neuro-computational model of the afferents to the ventral tegmental area. Front Neurorobot. 2014;8:4. doi: 10.3389/fnbot.2014.00004. [DOI] [PMC free article] [PubMed] [Google Scholar]
- 19.Ludvig EA, Sutton RS, Kehoe EJ. Stimulus representation and the timing of reward-prediction errors in models of the dopamine system. Neural Comput. 2008;20:3034–3054. doi: 10.1162/neco.2008.11-07-654. [DOI] [PubMed] [Google Scholar]
- 20.Tan CO, Bullock D. A local circuit model of learned striatal and dopamine cell responses under probabilistic schedules of reward. J. Neurosci. 2008;28:10062–10074. doi: 10.1523/JNEUROSCI.0259-08.2008. [DOI] [PMC free article] [PubMed] [Google Scholar]
- 21.Han X, et al. A high-light sensitivity optical neural silencer: development and application to optogenetic control of non-human primate cortex. Front Syst Neurosci. 2011;5:18. doi: 10.3389/fnsys.2011.00018. [DOI] [PMC free article] [PubMed] [Google Scholar]
- 22.Fiorillo CD, Song MR, Yun SR. Multiphasic Temporal Dynamics in Responses of Midbrain Dopamine Neurons to Appetitive and Aversive Stimuli. J. Neurosci. 2013;33:4710–4725. doi: 10.1523/JNEUROSCI.3883-12.2013. [DOI] [PMC free article] [PubMed] [Google Scholar]
- 23.Pi H-J, et al. Cortical interneurons that specialize in disinhibitory control. Nature. 2013;503:521–524. doi: 10.1038/nature12676. [DOI] [PMC free article] [PubMed] [Google Scholar]
- 24.Wilson NR, Runyan CA, Wang FL, Sur M. Division and subtraction by distinct cortical inhibitory networks in vivo. Nature. 2012;488:343–348. doi: 10.1038/nature11347. [DOI] [PMC free article] [PubMed] [Google Scholar]
- 25.Atallah BV, Bruns W, Carandini M, Scanziani M. Parvalbumin-expressing interneurons linearly transform cortical responses to visual stimuli. Neuron. 2012;73:159–170. doi: 10.1016/j.neuron.2011.12.013. [DOI] [PMC free article] [PubMed] [Google Scholar]
- 26.Murphy BK, Miller KD. Multiplicative gain changes are induced by excitation or inhibition alone. J. Neurosci. 2003;23:10040–10051. doi: 10.1523/JNEUROSCI.23-31-10040.2003. [DOI] [PMC free article] [PubMed] [Google Scholar]
- 27.Ayaz A, Chance FS. Gain Modulation of Neuronal Responses by Subtractive and Divisive Mechanisms of Inhibition. J Neurophysiol. 2009;101:958–968. doi: 10.1152/jn.90547.2008. [DOI] [PubMed] [Google Scholar]
- 28.Holt GR, Koch C. Shunting inhibition does not have a divisive effect on firing rates. Neural Comput. 1997;9:1001–1013. doi: 10.1162/neco.1997.9.5.1001. [DOI] [PubMed] [Google Scholar]
- 29.Roy JE, Cullen KE. Dissociating self-generated from passively applied head motion: neural mechanisms in the vestibular nuclei. J. Neurosci. 2004;24:2102–2111. doi: 10.1523/JNEUROSCI.3988-03.2004. [DOI] [PMC free article] [PubMed] [Google Scholar]
- 30.Rust NC, Schwartz O, Movshon JA, Simoncelli EP. Spatiotemporal Elements of Macaque V1 Receptive Fields. Neuron. 2005;46:945–956. doi: 10.1016/j.neuron.2005.05.021. [DOI] [PubMed] [Google Scholar]
Additional references
- 31.Bäckman CM, et al. Characterization of a mouse strain expressing Cre recombinase from the 3’ untranslated region of the dopamine transporter locus. Genesis. 2006;44:383–390. doi: 10.1002/dvg.20228. [DOI] [PubMed] [Google Scholar]
- 32.Vong L, et al. Leptin action on GABAergic neurons prevents obesity and reduces inhibitory tone to POMC neurons. Neuron. 2011;71:142–154. doi: 10.1016/j.neuron.2011.05.028. [DOI] [PMC free article] [PubMed] [Google Scholar]
- 33.Boyden ES, Zhang F, Bamberg E, Nagel G, Deisseroth K. Millisecond-timescale, genetically targeted optical control of neural activity. Nature Neuroscience. 2005;8:1263–1268. doi: 10.1038/nn1525. [DOI] [PubMed] [Google Scholar]
- 34.Atasoy D, Aponte Y, Su HH, Sternson SM. A FLEX switch targets Channelrhodopsin-2 to multiple cell types for imaging and long-range circuit mapping. J. Neurosci. 2008;28:7025–7030. doi: 10.1523/JNEUROSCI.1954-08.2008. [DOI] [PMC free article] [PubMed] [Google Scholar]
- 35.Uchida N, Mainen ZF. Speed and accuracy of olfactory discrimination in the rat. Nat Neurosci. 2003;6:1224–1229. doi: 10.1038/nn1142. [DOI] [PubMed] [Google Scholar]
- 36.Schmitzer-Torbert N, Redish AD. Neuronal activity in the rodent dorsal striatum in sequential navigation: separation of spatial and reward responses on the multiple T task. J. Neurophysiol. 2004;91:2259–2272. doi: 10.1152/jn.00687.2003. [DOI] [PubMed] [Google Scholar]
- 37.Lima SQ, Hromádka T, Znamenskiy P, Zador AM. PINP: a new method of tagging neuronal populations for identification during in vivo electrophysiological recording. PLoS ONE. 2009;4:e6099. doi: 10.1371/journal.pone.0006099. [DOI] [PMC free article] [PubMed] [Google Scholar]
- 38.Kvitsiani D, et al. Distinct behavioural and network correlates of two interneuron types in prefrontal cortex. Nature. 2013;498:363–366. doi: 10.1038/nature12176. [DOI] [PMC free article] [PubMed] [Google Scholar]
- 39.Olsen SR, Bhandawat V, Wilson RI. Divisive normalization in olfactory population codes. Neuron. 2010;66:287–299. doi: 10.1016/j.neuron.2010.04.009. [DOI] [PMC free article] [PubMed] [Google Scholar]
Associated Data
This section collects any data citations, data availability statements, or supplementary materials included in this article.


