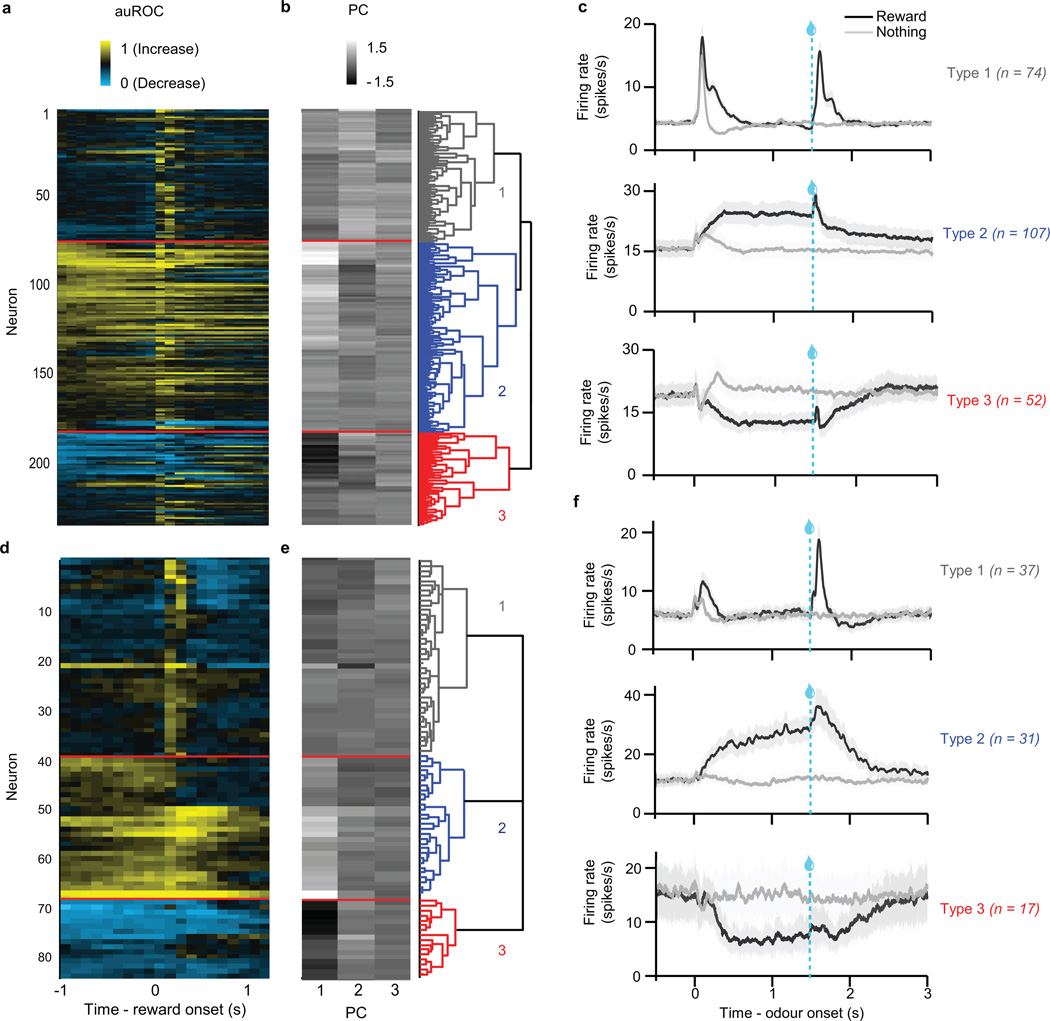
Extended Data Fig. 9. Neuron classification for GABA inhibition experiment.
a–c, Mice in which laser was delivered with continuous intensity. d–f, Mice in which laser was delivered with ramping intensity. a, d, Responses of all VTA neurons recorded in the tasks. Each row reflects the auROC values for a single neuron in the second before and after delivery of expected reward. Baseline is taken as one second before odour onset. Yellow, increase from baseline; cyan, decrease from baseline. b, e, The first three principal components of the auROC curves. These values were used for unsupervised hierarchical clustering, as shown in the dendrogram on the right. c, f, Average firing rates for the three clusters of neurons in each task. Odour was delivered for 1 s, followed by a 0.5 s delay and then reward delivery.

