Photoacoustic (PA) imaging is a hybrid and nonionizing imaging technology that integrates optical excitation with ultrasonic detection based on the PA effect.[1] It provides deeper tissue imaging penetration with higher spatial resolution when compared with traditional optical imaging techniques (e.g. fluorescence).[2] In biology, naturally occurring light absorbers, such as hemoglobin and melanin, can serve as endogenous contrast agents for PA imaging to monitor anatomic and physiological changes in diseases including skin cancer and atherosclerosis.[3] For most biological and pathological processes, there are no or small detectable variations in intrinsic PA contrast, thus small-molecule organic dyes,[4] fluorescent proteins,[5] metallic nanoparticles,[6] carbon nanotubes,[7] two-dimensional graphene analogues[8] and porphysomes[9] have been studied as exogenous contrast agents. However, organic dyes, fluorescent proteins and metallic nanoparticles usually encounter the issue of poor photostability; carbon nanotubes and graphenes have broad PA spectra, and porphysomes have phototoxicity due to the capability to generate single oxygen upon light irradiation (which however turns to advantage in photodynamic therapy).[10] Thereby, new contrast agents with improved properties are highly demanded in order to fully explore the potential of PA imaging.
Semiconducting polymer nanoparticles (SPNs) are primarily made from optically and electronically active semiconducting polymers (SPs) and their nanoparticle formation results from collapse of hydrophobic polymer chains owing to substantial decrease in solvent hydrophobicity upon transforming from organic solvent to water.[11] SPNs have emerged as a new class of optical nanomaterials with high absorption coefficients and controllable dimensions.[12] With completely organic and biologically inert components, SPNs intrinsically circumvent the issue of heavy metal ion-induced toxicity to living organisms and thus possess good biocompatibility. Fluorescent SPNs have been utilized for in vitro cell imaging,[13] in vivo cell tracking[14] and targeted tumor imaging,[15] but their imaging capability in small animals is constrained by the general limitations of whole-body optical imaging techniques such as low spatial resolution and poor tissue penetration. Recently, we have improved the SPN-based imaging by taking advantage of their efficient light harvesting capability to construct bioluminescent and chemiluminescent probes for in vivo imaging of lymph nodes and drug-induced toxicity, respectively.[16] We have also revealed that SPNs can efficiently convert photon energy into acoustic waves, permitting the development of smart probes for ratiometric PA imaging of reactive oxygen species (ROS) in edema mouse model.[17] In addition to high tolerance towards ROS, SPNs have found to be much more photostable than gold nanorods and photoacoustically brighter than carbon nanotubes upon pulsed laser irradiation.[17-18] However, few PA SPNs have been reported to date and few studies have investigated their underlying mechanisms and the polymer structure-property relationship. [19]
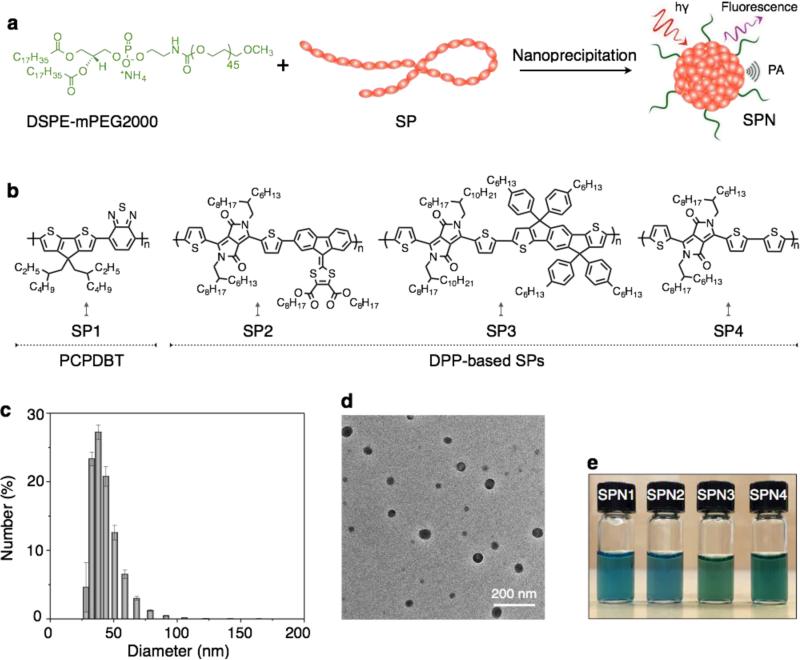
We herein report a new series of SPNs composed of low band-gap diketopyrrolopyrrole (DPP) based SPs for in vivo PA imaging. We first designed and synthesized three DPP-based copolymers and formulated them into PEGylated SPNs through nanoprecipitation (Figure 1). In order to reveal the relationship between polymer structures and PA properties, we systematically investigated and compared these SPNs (SPN2-4) with our previously reported poly(cyclopentadithiophene-alt-benzothiadiazole)-based SPN (SPN1) in terms of absorption, PA, fluorescence and photothermal properties.[17] At last, we demonstrated the proof-of-concept application of SPNs for in vivo PA imaging of tumor using the brightest nanoparticle among these SPNs: SPN4.
Figure 1. SPNs synthesis and nanocharacterization.
(a) Scheme illustration of preparation of SPNs via nanoprecipitation and (b) chemical structures of SP1 and DPP-based SPs (SP2-4). Representative DLS (c) and TEM (d) of SPN4. (e) Photograph of SPNs in aqueous solutions (20 μg/mL). Error bars represent standard deviations of three separate measurements.
DPP possesses a planar structure with electron deficiency and thus has been widely used as the electron acceptor in the design of SPs for optoelectronic applications, particularly in organic field-effect transistors and photovoltaic.[20] DPP-based SPs are found to show excellent light and thermal stability,[21] which makes them suitable for laser intensive tasks such as PA imaging. To fine-tune the band gaps of SPs, DDP was respectively copolymerized with three different electron-donating monomers through Stille or Suzuki cross coupling reaction. The resultant alternating copolymers (SPs: SP2-SP4) have different electron donor-acceptor backbone structures (Figure 1), which are expected to impact their fluorescence and PA properties.
The molecular weights of SPs were controlled during the polymerization so as to ensure their good solubility in tetrahydrofuran (THF); this is important for the subsequent nanoprecipitation process because a well-dissolved THF solution of SP is a prerequisite to form homogenous nanoparticles with a narrow dispersity after addition into the poor solvent (water) under sonication. To endow SPNs with good biodistribution in living animals, 1,2-distearoyl-sn-glycero-3-phosphoethanolamine-N-[methoxy(poly(ethyl eneglycol))-2000] (DSPE-mPEG2000) was used to co-precipitate with SPs, affording water-soluble SPNs presenting PEG on their surface (Figure 1a). Poly(cyclopentadithiophene-altbenzothiadiazole)-based SPN1 was formulated in the same way for comparison. Dynamic light scattering (DLS) showed the average diameter of the SPNs at 46±3 nm (Figure 1c), and transmission electron microscopy (TEM) revealed their spherical morphology (Figure 1d). No precipitation was observed for the SPNs after storage at 4 °C for three months (Figure 1e), and their sizes remained nearly the same (Supporting Figure S1). Besides, the physiological stability of SPNs was tested in cell culture medium (10 μg/mL, DMEM with 10% FBS). No obvious changes in their size and absorption were observed after incubation for 24 h. These data indicate good chemical and physiological stability of SPNs for in vivo imaging applications.
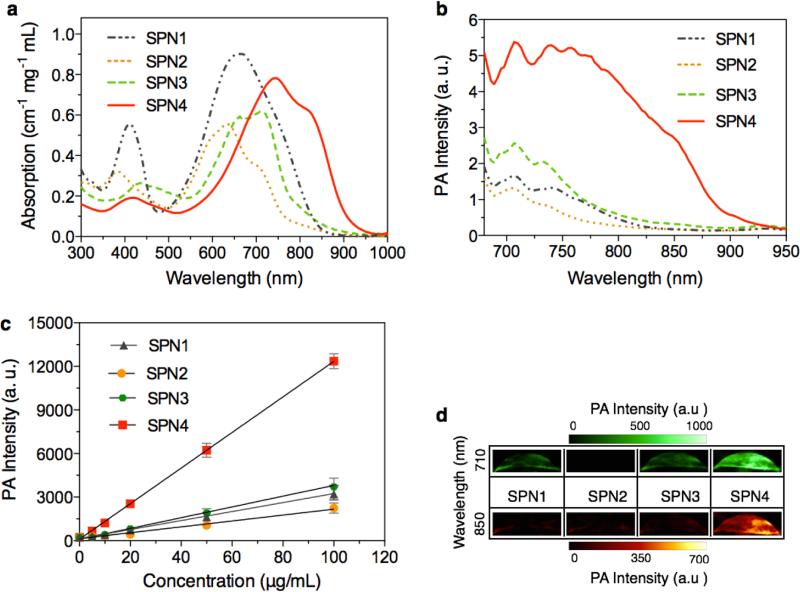
The absorption spectra of SPN1-4 are shown in Figure 2a with their absorption maxima at 660, 635, 712, and 748 nm, respectively. Their corresponding peak mass extinction coefficients are 0.90, 0.55, 0.60, and 0.76 cm−1 mg−1 mL, respectively. SPN4 exhibits the highest PA signal among these SPNs (Figure 2b), followed by SPN3, SPN1 and SPN2. The PA amplitudes of SPN1-4 at 710 nm were determined at a series of concentrations from 5 to 100 μg/mL (Figure 2c), and all SPNs displayed a linear relationship between PA signal and concentration. At each concentration, the PA signal of SPN4 is ~3.70, 5.40, and 3.20 times brighter than that of SPN1, SPN2 and SPN3, respectively. Because of the relatively red-shifted absorption spectrum and higher PA brightness of SPN4 as compared with other SPNs, only SPN4 can be detected at 850 nm at the low concentration of 2 μg/mL (Figure 2d).
Figure 2. In vitro absorption and PA properties of SPNs.
UV-Vis absorption (a) and PA (b) spectra of SPNs in 1× PBS at pH = 7.4. (c) PA intensities of SPNs as a function of nanoparticle concentration in PBS. R2 = 0.997, 0.996, 0.997, 0.993 for SPN1, SPN2, SPN3 and SPN4, respectively. (d) Representative PA images of SPNs solution at the concentration of 2 μg/mL each excited by pulsed laser at 710 and 850 nm, respectively. Error bars represent standard deviations of three separate measurements.
To study the effect of surface structures on PA properties, we also prepared SPNs by co-precipitating SPs with different lipids including dipalmitoylphosphatidylcholine (DPPC), 1,2-distearoyl-sn-glycero-3-phosphoethanolamine-N-[methoxy(polyethylene glycol)-350] (DSPE-mPEG350) and DSPE-mPEG2000. Using SP3 as an example, there is no obvious difference in the PA intensities for the synthesized SPN nanoparticle solutions at the same mass concentration of SP3 (Supporting Figure S2). This reflects that the organic surface coating has minimal influence on the transfer of heat from SP core to surrounding aqueous solution.[22] Also, it suggests that the PA intensities of SPNs are mainly determined by the molecular structures of SPs.
The excitation energy absorbed by the chromophore is generally dissipated through the following pathways: (i) fluorescence emission, (ii) generation of heat through vibrational relaxation (thermal deactivation), and (iii) intersystem conversion to long-lived species (e.g. phosphorescence).[23] PA property is based on the PA effect that measures the thermal deactivation (Pathway ii) of the excited chromophore by means of acoustic detection. As these SPNs are not phosphorescent, the pathways i and ii can play a role in determining their PA brightness in addition to the light absorption capability related to their mass extinction coefficients. Because the PA brightness of SPNs doesn't follow the order of their peak mass extinction coefficients, competition between the pathways i and ii should be considered for this deviation.
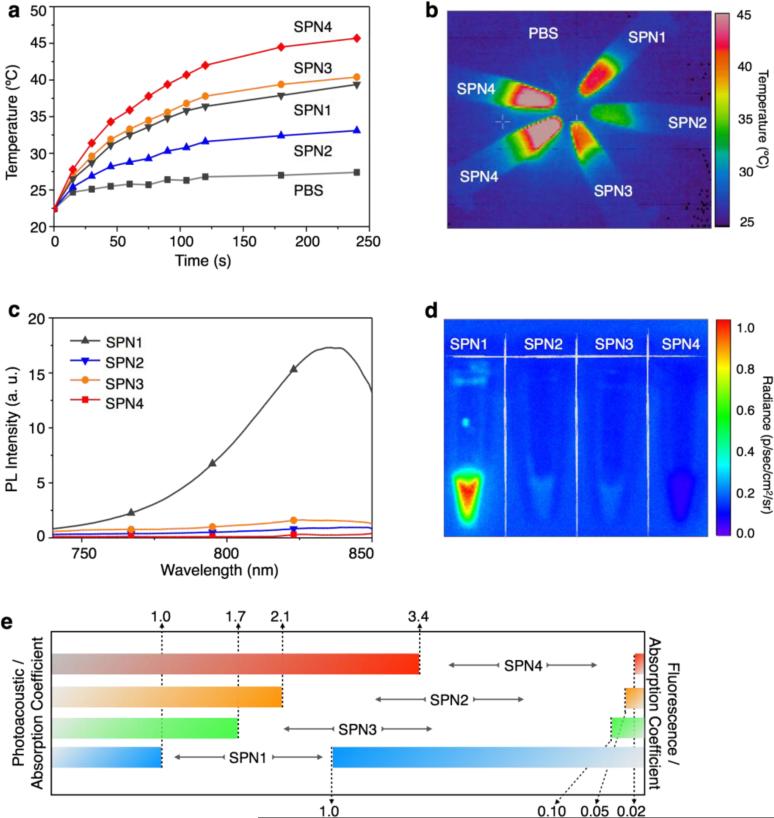
In order to find out the relationship between the PA intensities of these SPNs and their energy dissipation pathways (i and ii), we examined their photothermal and fluorescent properties upon light excitation. At the concentration of 20 μg/mL in 1×PBS (pH = 7.4), SPNs were continuously irradiated with an 808 nm laser for 4 min at 0.24 W/cm2, and the temperature of the SPNs solution was measured, which follows the same order of their PA intensities: SPN4 > SPN3 > SPN1 > SPN2 (Figure 3a). At 4 min, SPN4 was heated to 45, 39, 37, and 32 °C for SPN3, SPN1 and SPN2, respectively (Figures 3a). The temperature difference among these SPNs can be easily distinguished by their thermal images (Figure 3b). These data suggest that the PA signals of SPNs are closely associated with their photothermal properties.
Figure 3. Fluorescence and photothermal properties of SPNs.
(a) The solution temperature of SPNs (1× PBS at pH = 7.4) as a function of laser irradiating time. [SPN] = 20 μg/mL in 1× PBS at pH = 7.4. (b) Thermal image of the SPNs solutions after 808 nm laser irradiation for 4 min at the power intensity of 0.24 W/cm2. Fluorescence spectra (c) and image (d) of SPNs in PBS at pH = 7.4. (e) Normalized PA and fluorescence intensities based on the same mass extinction coefficients at 710 nm of SPNs solutions (1× PBS at pH = 7.4).
The fluorescence spectra of SPNs upon excitation at 710 nm are shown in Figure 3c. SPN1 emits substantially stronger fluorescence as compared to other SPNs, which is 20, 10 and 54 times as strong as SPN2, SPN3 and SPN4, respectively. Additionally, the IVIS fluorescence images of SPN solutions show that the fluorescence intensity of SPN4 is close to that of the background (Figure 3d). These results indicate that after light excitation the DPP-based SPNs (SPN2-4) favors the pathway of thermal deactivation much more than SPN1 does.
The optical, PA and photothermal properties of SPNs at the same mass concentration are summarized in Table 1. The fluorescence and PA intensities of SPNs at 710 nm are normalized to their mass excitation coefficients at this wavelength so the effect of pathways i and ii on each SPN can be compared at the same amount of light absorption and shown in Figure 3e. Compared at the same mass extinction coefficients, SPN4 has the highest normalized PA brightness, followed by SPN2, SPN3 and SPN1. In contrast, the normalized PA intensities of SPNs are in the reverse order of their fluorescence intensities (SPN4 < SPN2 < SPN3 < SPN1). This is consistent with the PA mechanism that thermal deactivation competes with light emission in determining acoustic generation upon light excitation. Among these SPNs, SPN4 has the strongest electron donor-acceptor backbone structure and narrowest band gap and thus favors non-radiative deactivation more. This distinct characteristic of SPN4 leads to the highest ability of transforming photon energy into heat, ultimately affording the brightest PA signals among these SPNs.
Table 1.
Summary of optical, PA and photothermal properties of SPNs measured at the same mass concentration.
| Entry | SPN1 | SPN2 | SPN3 | SPN4 |
|---|---|---|---|---|
| PA Intensity (norm.)a | 1.00 | 0.86 | 1.46 | 3.70 |
| Mass extinction coefficient (cm−1 mg−1 mL)b | 0.90 | 0.55 | 0.60 | 0.76 |
| Fluorescence quantum yield (%)c | 0.100 | 0.005 | 0.010 | 0.001 |
| Photothermal temperature (°C)d | 37 | 32 | 39 | 45 |
PA intensities are normalized to SPN1 at 710 nm, which is defined as 1
mass extinction coefficients are determined at the absorption maximum in 1× PBS at pH = 7.4 based on the effective absorption components in SPNs at their individual absorption maxima
fluorescence quantum yields were measured using indocyanine green (ICG) (0.1 μM) as the standard with a known quantum yield of 1% in H2O
The photothermal temperatures of SPNs solutions were measured after 808 nm laser irradiation for 4 min at the power intensity of 0.24 W/cm2.
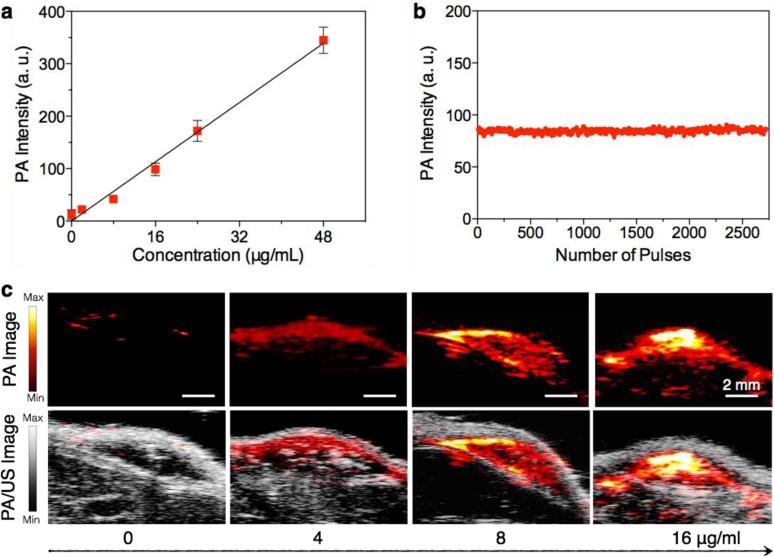
The potential of SPNs for in vivo PA imaging was first tested with subcutaneous injections of matrigel-containing solutions of SPN4, the brightest PA agent among these SPNs, into the dorsal area of mice. A linear correlation between mass concentration and PA signal of SPN4 was observed (Figure 4a and 4c). As the tissue background signal is 25±6 a.u. under the experimental conditions, the detection of limit of SPN4 for in vivo PA imaging is 0.60 μg/mL, which is 3.3-times lower than SPN1 (2 μg/mL) and 14.9-times lower than GNRs (15 × 40 nm) and carbon nanotubes (1.2 × 150 nm).[17] In addition, no obvious intensity loss was observed for the subcutaneously implanted SPN4 (16 μg/mL) after exposure to 2,700 laser pulses (Figure 4b). This result is similar to SPN1, suggesting that SPNs may generally possess excellent photostability.
Figure 4. In vivo PA properties of SPN4.
(a) PA intensities of SPN4–matrigel inclusions (30 μL) in the subcutaneous dorsal space of living mice as a function of nanoparticle mass concentration. The tissue background signal, calculated as the average PA signal in areas where no nanoparticles were injected, was 25±6 a.u. R2 = 0.991. (b) PA amplitudes of SPN4–matrigel inclusion (16 μg/mL, 30 μL) in the subcutaneous dorsal space of living mice versus number of laser pulses. (c) PA (upper) and PA/ultrasound co-registered (lower) images of the nanoparticle–matrigel inclusions in mice at indicated concentrations. The images represent transverse slices through the subcutaneous inclusions. A single laser pulse at 750 nm with a laser fluence of 9 mJ/cm2 and a pulse repetition rate of 20 Hz was used for all experiments. Error bars represent standard deviations of three separate measurements.
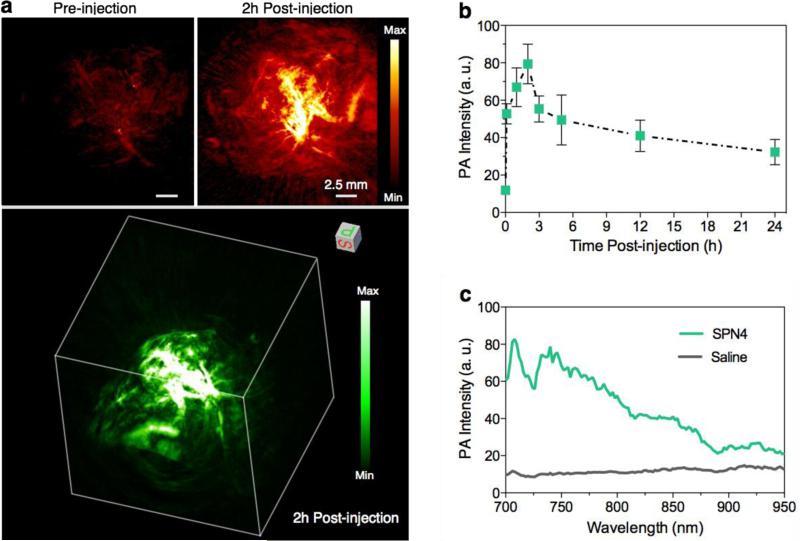
PA imaging has been demonstrated to permit visualization of microscopic biological structures within tissues in living animals.[1] To validate the capability of SPNs for tumor imaging, in vivo PA imaging was performed on the HeLa xenograft tumor model using SPN4. Before intravenous injection of SPN4 into nude mice through tail vein, the tumor shows weak PA signal due to the relatively low intrinsic absorption of oxyhemoglobin and deoxyhemoglobin in the NIR region under the experimental conditions (Figure 5a). After systemic administration of SPN4, the PA signal in the tumor area gradually increases and reaches maximum at 2 h (Figure 5b). At 2 h post-injection, the PA signal is 5.3-fold of the background signal. The real-time in vivo PA spectrum extracted from the tumor of SPN4-injected mice completely differs from that of saline-treated mice (Figure 5c), but closely resembles the spectrum of SPN4 in solution (Figure 2b). This confirms that the enhanced PA signal in tumor is attributed to SPN4. Furthermore, the 2D maximum intensity projection (MIP) and 3D PA images at 2h post-injection clearly delineate that PA signals come from the areas within and outside the blood vessels in the tumor, indicating that SPN4 is able to extravasate the blood vessels of tumor probably because of their relatively small size (~45 nm in diameter). The biodistribution of SPN4 in tumor-bearing nude mice at 24 h was studied by ex vivo PA quantification of different major organs (Supporting Figure S4). High accumulation of SPN4 is observed in skin, tumor, liver and kidney, which is similar to our previously reported PEG-coated SPNs.[17] The high accumulation of SPN4 in tumor in conjunction with its efficient extravasation validates its utility in tumor imaging in living small animals.
Figure 5. In vivo PA imaging of tumor.
(a) Representative PA maximum intensity projection (MIP) (upper) and 3D (lower) images of subcutaneous tumors of a living mouse pre-injection and 2h post-injection of SPN4 (30 μg/mouse). PA images were acquired at 750 nm. (b) PA signals at 750 nm in tumor as a function of time post-injection of SPN4. (c) In vivo real-time PA spectra extracted from the tumors in living mice after systemic administration of SPN4 or saline for 2 h. Error bars represent standard deviations of three separate measurements.
We have synthesized a new series of low-band-gap organic PA nanoparticles using DPP-based SPs as the optically active components. These PA nanoagents possess small size (~45 nm in diameter), high aqueous stability and excellent photostability. Systematic study on the structure and property relationship reveals the electron donor-acceptor backbones of SPs play an important role in determining both PA spectral profile and brightness of SPNs. By increasing the electron donating capability of the counterpart structure unit of DPP, SPNs show increased photothermal conversion along with deceased fluorescence. The molecular engineering of SPNs consequently leads to a substantially improved PA imaging agents (SPN4) that is 3.3-times brighter than our previously reported SPN1 when compared in living mice. Moreover, variation of particle surface using different lipids has little effect on the PA properties of SPNs, indicating the dominant role of molecular structures of SPs in defining their PA properties. Using SPN4 as a passive tumor targeting nanoagent, the PA signal from tumor area can be enhanced by 5.3-fold after intravenous injection into mice. Such a high PA signal enhancement in conjunction with the good biodistribution and low cytotoxicity of SPN4 suggests its great promise for in vivo tumor imaging.
In conclusion, this study not only provides the first molecular insights into the design of efficient PA organic nanoparticles based on optically active SPs, but also highlights the flexibility and potential of SPNs in PA imaging. The high thermal conversion of these SPNs also foreshows their effectiveness in photothermal therapy, which in fact has been demonstrated with other SPNs such as poly-(3,4-ethylenedioxythiophene):poly(4-styrenesulfonate) (PEDOT:PSS) and polypyrrole nanoparticles.[24] With the incorporation of other therapeutic and imaging agents into SPNs, multimodality theranostic systems should be readily achieved. Thus, SPNs can act as a versatile nanoplatform for the development of novel light intensive imaging and therapeutic approaches.
Supplementary Material
Acknowledgements
We acknowledge the use of the SCi3 Core Facility. This work was supported by the NIH National Cancer Institute (NCI) grants 2R01DK099800, CCNE-T (U54CA119367) and ICMIC (P50CA114747). AJS also thanks the Susan G. Komen For The Cure for fellowship support. JVJ acknowledges the NIH grant K99 HL117048.
Footnotes
Supporting Information Available. Synthetic scheme of SPs and supporting figures for aqueous stability, PA images, cytotoxicity studies and ex vivo quantification of SPN4.
Contributor Information
Prof. Kanyi Pu, Molecular Imaging Program at Stanford Department of Radiology, School of Medicine, Stanford University, California 94305, USA
Prof. Jianguo Mei, Department of Chemical Engineering, Stanford University, Stanford, California 94305, USA Department of Chemistry, Purdue University, West Lafayette, IN 47907, USA.
Dr. Jesse V. Jokerst, Molecular Imaging Program at Stanford Department of Radiology, School of Medicine, Stanford University, California 94305, USA
Dr. Guosong Hong, Department of Chemistry, Stanford University, Stanford, California 94305, USA
Dr. Alexander L. Antaris, Department of Chemistry, Stanford University, Stanford, California 94305, USA
Dr. Niladri Chattopadhyay, Molecular Imaging Program at Stanford Department of Radiology, School of Medicine, Stanford University, California 94305, USA
Dr. Adam J. Shuhendler, Molecular Imaging Program at Stanford Department of Radiology, School of Medicine, Stanford University, California 94305, USA
Dr. Tadanori Kurosawa, Department of Chemical Engineering, Stanford University, Stanford, California 94305, USA
Dr. Yan Zhou, Department of Chemical Engineering, Stanford University, Stanford, California 94305, USA
Prof. Sanjiv S. Gambhir, Molecular Imaging Program at Stanford Department of Radiology, School of Medicine, Stanford University, California 94305, USA Department of Bioengineering, Stanford California 94305, USA.
Prof. Zhenan Bao, Department of Chemical Engineering, Stanford University, Stanford, California 94305, USA
Prof. Jianghong Rao, Molecular Imaging Program at Stanford Department of Radiology, School of Medicine, Stanford University, California 94305, USA.
Reference
- 1.Kim C, Favazza C, Wang LHV. Chem. Rev. 2010;110:2756–2782. doi: 10.1021/cr900266s. [DOI] [PMC free article] [PubMed] [Google Scholar]
- 2.Wang LV, Hu S. Science. 2012;335:1458–1462. doi: 10.1126/science.1216210. [DOI] [PMC free article] [PubMed] [Google Scholar]
- 3.Ntziachristos V, Razansky D. Chem. Rev. 2010;110:2783–2794. doi: 10.1021/cr9002566. [DOI] [PubMed] [Google Scholar]
- 4.a Levi J, Kothapalli SR, Ma TJ, Hartman K, Khuri-Yakub BT, Gambhir SS. J. Am. Chem. Soc. 2010;132:11264–11269. doi: 10.1021/ja104000a. [DOI] [PMC free article] [PubMed] [Google Scholar]; b Zhang Y, Cai X, Wang Y, Zhang C, Li L, Choi SW, Wang LHV, Xia YN. Angew. Chem. Int. Ed. Engl. 2011;50:7359–7363. doi: 10.1002/anie.201101659. [DOI] [PMC free article] [PubMed] [Google Scholar]
- 5.a Filonov GS, Krumholz A, Xia J, Yao J, Wang LV, Verkhusha VV. Angew. Chem. Int. Ed. Engl. 2012;51:1448–1451. doi: 10.1002/anie.201107026. [DOI] [PMC free article] [PubMed] [Google Scholar]; b Hoffman RM. Nat. Rev. Cancer. 2005;5:796–806. doi: 10.1038/nrc1717. [DOI] [PubMed] [Google Scholar]
- 6.a Song KH, Kim CH, Cobley CM, Xia YN, Wang LV. Nano Letters. 2009;9:183–188. doi: 10.1021/nl802746w. [DOI] [PMC free article] [PubMed] [Google Scholar]; b Xia YN, Li WY, Cobley CM, Chen JY, Xia XH, Zhang Q, Yang MX, Cho EC, Brown PK. Acc. Chem. Res. 2011;44:914–924. doi: 10.1021/ar200061q. [DOI] [PMC free article] [PubMed] [Google Scholar]; c Jin YD, Jia CX, Huang SW, O'Donnell M, Gao XH. Nat. Commun. 2010;1:41. doi: 10.1038/ncomms1042. [DOI] [PMC free article] [PubMed] [Google Scholar]; d Ku G, Zhou M, Song S, Huang Q, Hazle J, Li C. ACS Nano. 2012;6:7489–7496. doi: 10.1021/nn302782y. [DOI] [PMC free article] [PubMed] [Google Scholar]; e Zhou M, Ku G, Pageon L, Li C. Nanoscale. 2014;6:15228–15235. doi: 10.1039/c4nr05386a. [DOI] [PMC free article] [PubMed] [Google Scholar]; f Liu J, Zheng X, Yan L, Zhou L, Tian G, Yin W, Wang L, Liu Y, Hu Z, Gu Z, Chen C, Zhao Y. ACS Nano. 2015;9:696–707. doi: 10.1021/nn506137n. [DOI] [PubMed] [Google Scholar]; g Chen M, Tang SH, Guo ZD, Wang XY, Mo SG, Huang XQ, Liu G, Zheng NF. Adv. Mater. 2014;26:8210–8216. doi: 10.1002/adma.201404013. [DOI] [PubMed] [Google Scholar]
- 7.a De Zerda A, Zavaleta C, Keren S, Vaithilingam S, Bodapati S, Liu Z, Levi J, Smith BR, Ma TJ, Oralkan O, Cheng Z, Chen X, Dai H, Khuri-Yakub BT, Gambhir SS. Nat. Nanotechnol. 2008;3:557–562. doi: 10.1038/nnano.2008.231. [DOI] [PMC free article] [PubMed] [Google Scholar]; b Kim JW, Galanzha EI, Shashkov EV, Moon HM, Zharov VP. Nat. Nanotechnol. 2009;4:688–694. doi: 10.1038/nnano.2009.231. [DOI] [PMC free article] [PubMed] [Google Scholar]
- 8.a Cheng L, Liu J, Gu X, Gong H, Shi X, Liu T, Wang C, Wang X, Liu G, Xing H, Bu W, Sun B, Liu Z. Adv. Mater. 2014;26:1886–1893. doi: 10.1002/adma.201304497. [DOI] [PubMed] [Google Scholar]; b Nie L, Huang P, Li W, Yan X, Jin A, Wang Z, Tang Y, Wang S, Zhang X, Niu G, Chen X. ACS Nano. 2014;8:12141–12150. doi: 10.1021/nn505989e. [DOI] [PMC free article] [PubMed] [Google Scholar]; c Yang K, Hu L, Ma X, Ye S, Cheng L, Shi X, Li C, Li Y, Liu Z. Adv. Mater. 2012;24:1868–1872. doi: 10.1002/adma.201104964. [DOI] [PubMed] [Google Scholar]; d Song X-R, Wang X, Yu S-X, Cao J, Li S-H, Li J, Liu G, Yang H-H, Chen X. Adv. Mater. 2015 doi: 10.1002/adma.201405634. DOI: 10.1002/adma.201405634. [DOI] [PMC free article] [PubMed] [Google Scholar]
- 9.a Lovell JF, Jin CS, Huynh E, Jin HL, Kim C, Rubinstein JL, Chan WCW, Cao WG, Wang LV, Zheng G. Nat. Mater. 2011;10:324–332. doi: 10.1038/nmat2986. [DOI] [PubMed] [Google Scholar]; b Huynh E, LeungBen YC, Helfield BL, Shakiba M, Gandier J-A, Jin CS, Master ER, Wilson BC, Goertz DE, Zheng G. Nat. Nanotechol. 2015;10:325–332. doi: 10.1038/nnano.2015.25. [DOI] [PubMed] [Google Scholar]; c Zhang Y, Jeon M, Rich LJ, Hong H, Geng J, Zhang Y, Shi S, Barnhart TE, Alexandridis P, Huizinga JD, Seshadri M, Cai W, Kim C, Lovell JF. Nat. Nanotechnol. 2014;9:631–638. doi: 10.1038/nnano.2014.130. [DOI] [PMC free article] [PubMed] [Google Scholar]
- 10.a Lovell JF, Liu TWB, Chen J, Zheng G. Chem. Rev. 2010;110:2839–2857. doi: 10.1021/cr900236h. [DOI] [PubMed] [Google Scholar]; b Jin CS, Lovell JF, Chen J, Zheng G. ACS Nano. 2013;7:2541–2550. doi: 10.1021/nn3058642. [DOI] [PMC free article] [PubMed] [Google Scholar]
- 11.a Wu C, Chiu DT. Angew. Chem. Int. Ed. Engl. 2013;52:3086–3109. doi: 10.1002/anie.201205133. [DOI] [PMC free article] [PubMed] [Google Scholar]; b Zhu C, Liu L, Yang Q, Lv F, Wang S. Chem. Rev. 2012;112:4687–4735. doi: 10.1021/cr200263w. [DOI] [PubMed] [Google Scholar]; c Howes P, Green M, Levitt J, Suhling K, Hughes M. J. Am. Chem. Soc. 2010;132:3989–3996. doi: 10.1021/ja1002179. [DOI] [PubMed] [Google Scholar]; d Pecher J, Mecking S. Chem. Rev. 2010;110:6260–6279. doi: 10.1021/cr100132y. [DOI] [PubMed] [Google Scholar]
- 12.a Pu KY, Liu B. Adv. Funct. Mater. 2011;21:3408–3423. [Google Scholar]; b Wu C, Szymanski C, McNeill J. Langmuir. 2006;22:2956–2960. doi: 10.1021/la060188l. [DOI] [PubMed] [Google Scholar]; c Feng L, Zhu C, Yuan H, Liu L, Lv F, Wang S. Chem. Soc. Rev. 2013;42:6620–6633. doi: 10.1039/c3cs60036j. [DOI] [PubMed] [Google Scholar]
- 13.a Wu C, Schneider T, Zeigler M, Yu J, Schiro PG, Burnham DR, McNeill JD, Chiu DT. J. Am. Chem. Soc. 2010;132:15410–15417. doi: 10.1021/ja107196s. [DOI] [PMC free article] [PubMed] [Google Scholar]; b Wu P-J, Kuo S-Y, Huang Y-C, Chen C-P, Chan Y-H. Anal. Chem. 2014;86:4831–4839. doi: 10.1021/ac404237q. [DOI] [PubMed] [Google Scholar]; c Sun K, Chen H, Wang L, Yin S, Wang H, Xu G, Chen D, Zhang X, Wu C, Qin W. ACS Appl. Mater. Inter. 2014;6:10802–10812. doi: 10.1021/am502733n. [DOI] [PubMed] [Google Scholar]; d Feng X, Yang G, Liu L, Lv F, Yang Q, Wang S, Zhu D. Adv. Mater. 2012;24:637–641. doi: 10.1002/adma.201102026. [DOI] [PubMed] [Google Scholar]
- 14.Pu K, Shuhendler AJ, Valta MP, Cui L, Saar M, Peehl DM, Rao J. Adv. Healthcare Mater. 2014;3:1292–1298. doi: 10.1002/adhm.201300534. [DOI] [PMC free article] [PubMed] [Google Scholar]
- 15.a Wu C, Hansen SJ, Hou Q, Yu J, Zeigler M, Jin Y, Burnham DR, McNeill JD, Olson JM, Chiu DT. Angew. Chem. Int. Ed. Engl. 2011;50:3430–3434. doi: 10.1002/anie.201007461. [DOI] [PMC free article] [PubMed] [Google Scholar]; b Li K, Ding D, Huo D, Pu K-Y, Thao NNP, Hu Y, Li Z, Liu B. Adv. Funct. Mater. 2012;22:3107–3115. [Google Scholar]
- 16.a Xiong L, Shuhendler AJ, Rao J. Nat. Commun. 2012;3:1193. doi: 10.1038/ncomms2197. [DOI] [PMC free article] [PubMed] [Google Scholar]; b Shuhendler AJ, Pu K, Cui L, Uetrecht JP, Rao J. Nat. Biotechnol. 2014;32:373–380. doi: 10.1038/nbt.2838. [DOI] [PMC free article] [PubMed] [Google Scholar]
- 17.Pu K, Shuhendler AJ, Jokerst JV, Mei J, Gambhir SS, Bao Z, Rao J. Nat. Nanotechol. 2014;9:233–239. doi: 10.1038/nnano.2013.302. [DOI] [PMC free article] [PubMed] [Google Scholar]
- 18.Pu K, Shuhendler AJ, Rao J. Angew. Chem. Int. Ed. Engl. 2013;52:10325–10329. doi: 10.1002/anie.201303420. [DOI] [PMC free article] [PubMed] [Google Scholar]
- 19.a Liu J, Geng J, Liao L-D, Thakor N, Gao X, Liu B. Poly. Chem. 2014;5:2854–2862. [Google Scholar]; b Song X, Gong H, Yin S, Cheng L, Wang C, Li Z, Li Y, Wang X, Liu G, Liu Z. Adv. Fun. Mater. 2014;24:1194–1201. [Google Scholar]; c Zha Z, Deng Z, Li Y, Li C, Wang J, Wang S, Qu E, Dai Z. Nanoscale. 2013;5:4462–4467. doi: 10.1039/c3nr00627a. [DOI] [PubMed] [Google Scholar]
- 20.a Zhang X, Richter LJ, DeLongchamp DM, Kline RJ, Hammond MR, McCulloch I, Heeney M, Ashraf RS, Smith JN, Anthopoulos TD, Schroeder B, Geerts YH, Fischer DA, Toney MF. J. Am. Chem. Soc. 2011;133:15073–15084. doi: 10.1021/ja204515s. [DOI] [PubMed] [Google Scholar]; b Bijleveld JC, Zoombelt AP, Mathijssen SGJ, Wienk MM, Turbiez M, de Leeuw DM, Janssen RAJ. J. Am. Chem. Soc. 2009;131:16616–16617. doi: 10.1021/ja907506r. [DOI] [PubMed] [Google Scholar]; c Matthews JR, Niu W, Tandia A, Wallace AL, Hu J, Lee W-Y, Giri G, Mannsfeld SCB, Xie Y, Cai S, Fong HH, Bao Z, He M. Chem. Mater. 2013;25:782–789. [Google Scholar]; d Xie Y, Ouyang S, Wang D, Lee W-Y, Bao Z, Matthews JR, Niu W, Bellman RA, He M, Fong HH. Organic Electronics. 2015;20:55–62. [Google Scholar]
- 21.Beyerlein T, Tieke B, Forero-Lenger S, Brutting W. Synth. Met. 2002;130:115–119. [Google Scholar]
- 22.Chen Y-S, Frey W, Kim S, Kruizinga P, Homan K, Emelianov S. Nano Letters. 2011;11:348–354. doi: 10.1021/nl1042006. [DOI] [PMC free article] [PubMed] [Google Scholar]
- 23.Braslavsky SE, Heibel GE. Chem. Rev. 1992;92:1381–1410. [Google Scholar]
- 24.a Cheng L, Yang K, Chen Q, Liu Z. ACS Nano. 2012;6:5605–5613. doi: 10.1021/nn301539m. [DOI] [PubMed] [Google Scholar]; b Yang K, Xu H, Cheng L, Sun C, Wang J, Liu Z. Adv. Mater. 2012;24:5586–5592. doi: 10.1002/adma.201202625. [DOI] [PubMed] [Google Scholar]
Associated Data
This section collects any data citations, data availability statements, or supplementary materials included in this article.


