Abstract
We recently demonstrated that adipocyte deficiency of angiotensinogen ablated high fat diet-induced elevations in plasma angiotensin II concentrations and obesity-hypertension in male mice. Hepatocytes are the predominant source of systemic angiotensinogen. Therefore, in this study, we defined the contribution of hepatocyte-derived angiotensinogen to obesity-induced elevations in plasma angiotensinogen concentrations and hypertension. Male Agtfl/fl mice expressing albumin-driven Cre recombinase were bred to female Agtfl/fl mice to generate Agtfl/fl or hepatocyte-angiotensinogen deficient male mice (AgtAlb). Mice were fed a low fat or high fat diet for 16 weeks. Hepatocyte angiotensinogen deficiency had no significant effect on body weight. Plasma angiotensinogen concentrations were increased in obese Agtfl/fl mice. Hepatocyte angiotensinogen deficiency markedly reduced plasma angiotensinogen and angiotensin II concentrations in lean and obese mice. Moreover, hepatocyte angiotensinogen deficiency reduced the content and release of angiotensinogen from adipose explants. Systolic blood pressure was markedly decreased in lean (by 18 mmHg) and obese AgtAlb mice (by 54 mmHg) compared to Agtfl/fl controls. To define mechanisms, we quantified effects of angiotensin II on mRNA abundance of megalin, an angiotensinogen uptake transporter, in 3T3-L1 adipocytes. Angiotensin II stimulated adipocyte megalin mRNA abundance and decreased media angiotensinogen concentrations. These results demonstrate that hepatocytes are the predominant source of systemic angiotensinogen in both lean and obese mice. Moreover, reductions in plasma angiotensin concentrations in obese hepatocyte angiotensinogen deficient mice may have limited megalin-dependent uptake of angiotensinogen into adipocytes for the production of angiotensin II in the development of obesity-hypertension.
Keywords: angiotensinogen, obesity, liver, blood pressure, angiotensin
Introduction
Obesity is an important risk factor for hypertension.1 In normal physiology, the renin angiotensin system (RAS) plays crucial roles in maintaining basal blood pressure, sodium and water homeostasis. Obesity is associated with an activated RAS, with elevations in systemic concentrations of the vasoactive peptide, angiotensin II (AngII), and an increase in systolic blood pressure (SBP),2-7 As might be expected given these findings, the use of ACE inhibitors8-13 or AT1R antagonists8,14 to inhibit the RAS is an effective therapy for obesity-hypertension.
Angiotensinogen (AGT) is the only known precursor to AngII. Whole body deficiency of AGT markedly reduces plasma AGT and angiotensin peptide concentrations in mice.15,16 While several cell types produce AGT, recent studies in mice with hepatocyte-deficiency of AGT demonstrate robust reductions in plasma AGT concentrations.17 The intrarenal RAS has been proposed as a self-contained RAS, where proximal tubule cells synthesize and secrete AGT into tubule fluid18, as well as take up AGT through a megalin-dependent mechanism.19 In mice with hepatocyte AGT deficiency, renal AGT and AngII were reduced, potentially related to reduced uptake of liver-derived AGT by megalin.17 These results demonstrate an intrarenal RAS that is influenced by liver-derived AGT. An additional source of AGT is adipocytes, where adipocyte-specific deficiency of AGT reduces plasma AGT concentrations (by 15-20%) and systolic blood pressure (by 10-15 mmHg) in normal mice.20 Conversely, transgenic over-expression of AGT in adipocytes increases systemic AGT concentrations and systolic blood pressure.21-23 However, previous studies from our laboratory demonstrate that in mice with diet-induced obesity, adipocyte-specific deficiency of AGT did not prevent obesity-induced elevations in plasma AGT concentrations.24 Notably, despite continued elevations in plasma AGT concentrations in adipocyte AGT deficient obese mice, elevations in plasma AngII concentrations and systolic blood pressure were totally abolished.24 These results suggest dissociations between the systemic and local RAS in the development of obesity-induced hypertension. Namely, obese mice with adipocyte AGT deficiency maintained high plasma AGT concentrations while experiencing reductions in plasma AngII concentrations and blood pressure. Mechanisms for dissociation of local versus systemic RAS in development of obesity-induced hypertension are unclear.
Since adipocytes were recently demonstrated to be an important source of systemic AngII concentrations in obesity-induced hypertension24, in this study we defined the contribution of hepatocyte-derived AGT to obesity-induced elevations in systemic AGT and AngII concentrations. We also examined the role of hepatocyte-derived AGT in the regulation of adipose production of AGT and AngII in the development of obesity-induced hypertension.
Methods
Animals
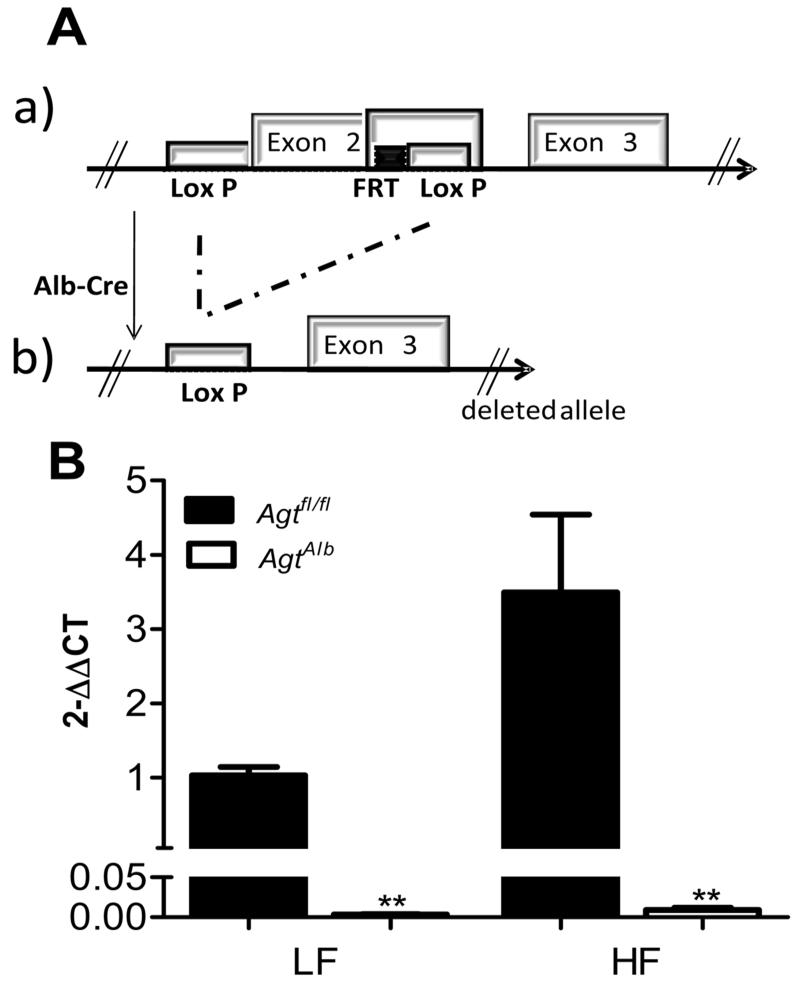
All procedures involving animals were performed in accordance with the National Institutes of Health Guide for the Care and Use of Laboratory Animals and were approved by the institutional Animal Care and Use Committee at the University of Kentucky. Male C57BL/6 mice with loxP sites flanking exon 2 of the AGT gene20,24 (Agtfl/fl; Figure 1A) were bred to transgenic male mice expressing Cre recombinase under the control of the albumin promoter (Strain Name: B6.Cg-Tg(Alb-cre)21Mgn/J, Stock Number: 003574).20,24 Mice (Agtfl/fl) were compared to hepatocyte-AGT deficient mice (AgtAlb) in all studies. Diets, radiotelemetry monitoring of blood pressure, measurement of plasma and adipose parameters, gene expression, studies in 3T3-L1 adipocytes and statistical analyses are described in the online-only Data Supplement and in previous publications.20,24
Figure 1.
A, Schematic representation of the loxP-flanked AGT allele before (a) and after recombination with Albumin-driven Cre expression (b). B, AGT mRNA abundance in liver of LF and HF-fed Agtfl/fl and AgtAlb mice. Data are mean ± SEM from N = 6 mice/group. *, P<0.05 compared to LF within genotype, **, P<0.05 compared to Agtfl/fl within diet group.
Results
Hepatocyte-specific deficiency of AGT had no effect on development of HF diet-induced body weight gain
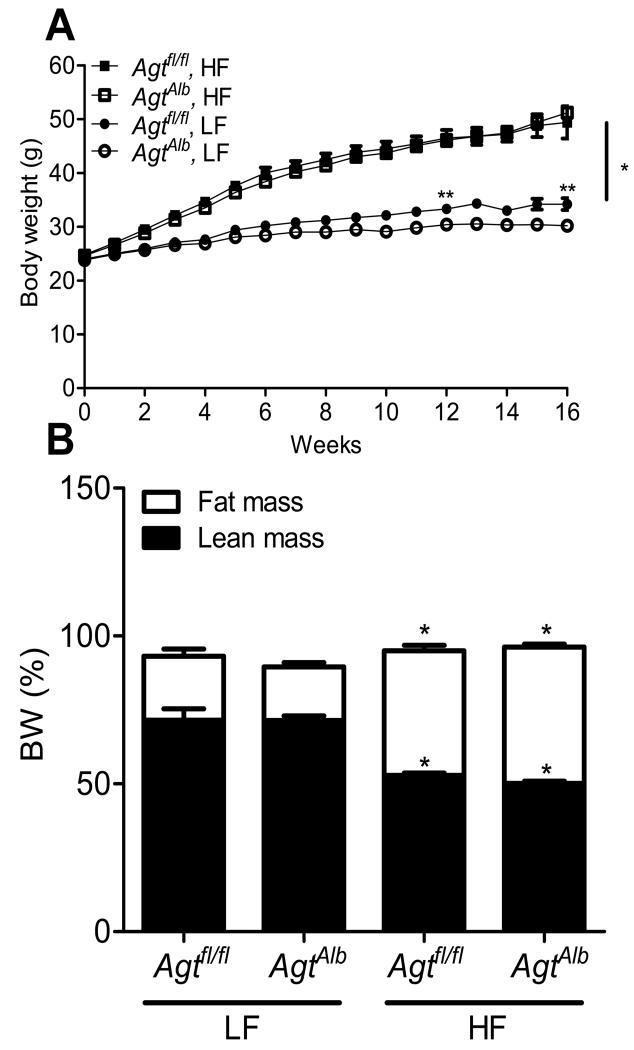
Mice with hepatocyte AGT deficiency exhibited pronounced reductions in liver AGT mRNA abundance compared to mice not expressing Cre (Figure 1B; P<0.05). Interestingly, body weights of LF-fed AgtAlb mice were decreased significantly on week 12 and 16 compared to LF-fed Agtfl/fl mice (Figure 2A; P<0.05). However, there was no significant difference in body weights of HF-fed Agtfl/fl versus AgtAlb mice (Figure 2A; P>0.05). Fat mass (expressed as % body weight) was increased significantly in HF-fed mice of each genotype compared to LF-fed controls, with no significant differences between genotypes (Figure 2B; P>0.05). HF feeding increased adipocyte size in tissue sections from mice of each genotype, with no significant differences between genotypes (Supplemental Figure S1A-C). Similarly, livers from HF-fed mice exhibited significant Oil Red O staining as an index of lipid accumulation, with no overt differences between genotypes (Supplemental Figure S1D). Total body water (Supplemental Figure S2) was increased significantly in HF-fed mice of each genotype compared to LF-fed controls. Moreover, total body water was decreased significantly in AgtAlb mice compared to Agtfl/fl controls in both diet groups. The mass of liver, visceral and brown adipose tissue were increased significantly in HF-fed mice of each genotype compared to LF-fed controls, with no significant differences between genotypes (Table 1; P<0.05). The mass of kidney was increased significantly in HF-fed Agtfl/fl but not AgtAlb mice compared to LF-fed mice (Table 1). Heart mass was increased significantly by HF feeding in both genotypes; however, heart weights of HF-fed AgtAlb mice were significantly decreased compared to HF-fed Agtfl/fl controls. Glucose tolerance was significantly impaired in HF-fed mice of each genotype compared to LF-fed controls, with no significant differences between genotypes (Supplemental Figure S3A, B).
Figure 2.
Hepatocyte AGT deficiency had no effect on body weight gain in mice fed a HF diet. A, Body weight of LF and HF-fed Agtfl/fl and AgtAlb mice. Data are mean ± SEM from N = 17-25 mice/group. *, P<0.05 compared to LF within genotype. **, P<0.05 compared to Agtfl/fl within diet group. B, Fat and lean mass (expressed as a percentage of body weight) for mice in each group. Data are mean ± SEM from N = 11-22 mice/group. *, P<0.05 compared to LF within genotype.
Table 1. Characteristics of LF and HF-fed Agtfl/fl and AgtAlb male mice after 16 weeks of diet.
| Characteristics | LF Diet | HF Diet | ||
|---|---|---|---|---|
|
| ||||
| Agtfl/fl | AgtAlb | Agtfl/fl | AgtAlb | |
| Body Weight | 32.0±0.8 | 31.5±1.0 | 45.5±1.9* | 42.8±2.3* |
| Liver | 1.25±0.04 | 1.28±0.07 | 2.30±0.25* | 1.92±0.28* |
| Kidney | 0.35±0.01 | 0.32±0.01 | 0.42±0.01* | 0.34±0.01† |
| Heart | 0.141±0.007 | 0.118±0.004† | 0.159±0.005* | 0.139±0.010*,† |
| Visceral adipose | 1.25±0.15 | 1.23±0.14 | 2.46±0.14* | 2.34±0.19* |
| Subcutaneous | 0.49±0.06 | 0.46±0.05 | 1.78±0.20* | 1.61±0.21* |
| BAT | 0.14±0.01 | 0.14±0.01 | 0.23±0.02* | 0.23±0.02* |
|
Plasma
Aldosterone (pg/ml) |
1.17 ± 0.30 | 0.71 ± 0.19† | 1.18 ± 0.04 | 0.42 ± 0.02† |
Body and tissue weights are in grams. Data are mean ± SEM.
P<0.05 compared to LF within genotype.
P<0.05 compared to Agtfl/fl within diet group, N=14-21/group. BAT, Brown Adipose Tissue. For plasma aldosterone, N=6/group.
Hepatocyte-specific deficiency of AGT markedly reduced systemic RAS in mice fed a HF diet
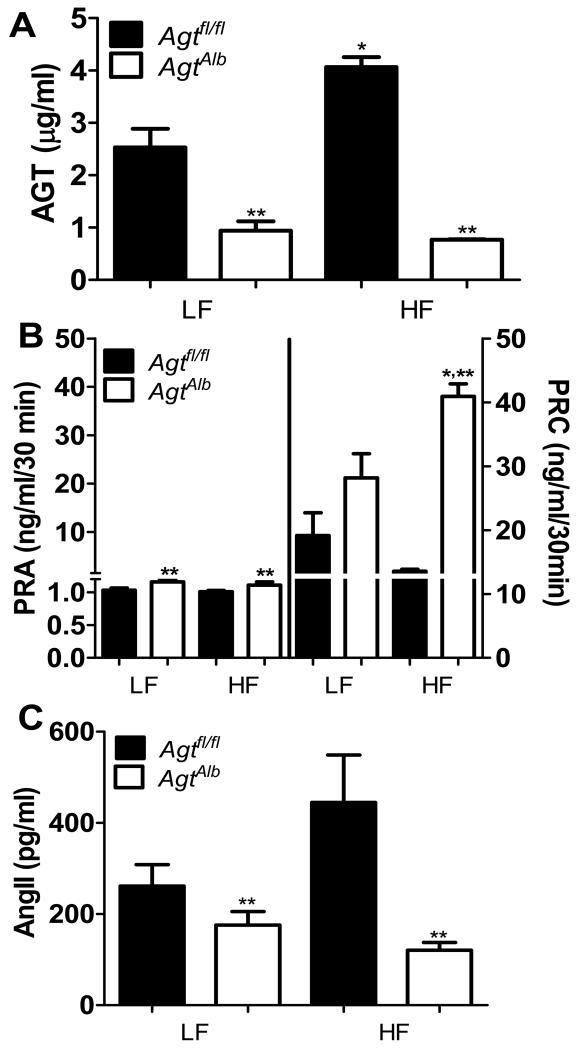
In LF-fed mice, plasma AGT concentrations were markedly decreased (by 65%) in AgtAlb compared to Agtfl/fl mice (Figure 3A; P<0.05). HF-fed Agtfl/fl mice exhibited significant elevations (by 60%) in plasma AGT concentrations compared to LF-fed controls (Figure 3A; P<0.05). In contrast, HF-fed mice with hepatocyte-specific AGT deficiency exhibited very low plasma AGT concentrations, similar to levels of LF-fed AgtAlb mice (Figure 3A). Plasma renin activity (PRA) was increased significantly in both LF and HF-fed AgtAlb mice compared to Agtfl/fl controls (Figure 3B; P<0.05). In Agtfl/fl controls, plasma renin concentrations (PRC) were not significantly different between HF- and LF-fed mice (Figure 3B). In contrast, PRC was significantly increased in HF-fed AgtAlb mice compared to Agtfl/fl mice (Figure 3B; P<0.05). In Agtfl/fl mice, plasma AngII concentrations were not significantly different between HF-fed and LF-fed mice (Figure 3C, P>0.05). However, plasma AngII concentrations were reduced significantly in both LF and HF-fed AgtAlb mice compared to Agtfl/fl controls (Figure 3C; P<0.05). Similarly, plasma aldosterone concentrations were significantly reduced in both LF and HF-fed AgtAlb mice compared to Agtfl/fl mice (Table 1; P<0.05).
Figure 3.
Hepatocyte AGT deficiency markedly alters the systemic RAS in LF and HF-fed mice. A, Plasma AGT concentrations in LF and HF-fed Agtfl/fl and AgtAlb mice. B, Plasma renin activity (PRA; left y-axis) and concentration (PRC; right y-axis) in LF and HF-fed Agtfl/fl and AgtAlb mice. C, Plasma AngII concentrations in LF and HF-fed Agtfl/fl and AgtAlb mice. Data are mean ± SEM from N = 6-15 mice/group. *, P<0.05 compared to LF within genotype, **, P<0.05 compared to Agtfl/fl within diet group.
Hepatocyte AGT deficiency upregulated the intrarenal RAS
Recent studies demonstrated that liver AGT deficiency reduced kidney AGT concentrations, AngII content, and promoted an abnormal kidney morphologic phenotype.17 Therefore, we quantified mRNA abundance of RAS components in kidneys from mice of each genotype and diet group. Renin and PRR mRNA abundance were increased significantly in kidneys from AgtAlb mice compared to Agtfl/fl controls, regardless of diet group (Supplemental Figure S4A,B; P<0.05). However, mRNA abundance of AGT, ACE, and AT1R were not significantly altered by diet or genotype (Supplemental Figure S4C-E; P>0.05). Since megalin was reported to mediate uptake of liver-derived AGT by kidney17, we quantified megalin mRNA abundance in kidney, which was not significantly influenced by either diet or genotype (Supplemental Figure S4F; P>0.05). We examined renal morphology using Masson Trichrome and Periodic Acid-Schiff staining of kidney tissue sections from mice of each diet and genotype. There was no significant effect of either diet or genotype on kidney morphology (Supplemental Figure S5A-D).
Hepatocyte-specific deficiency of AGT decreases adipose AGT content and release in mice fed a HF diet
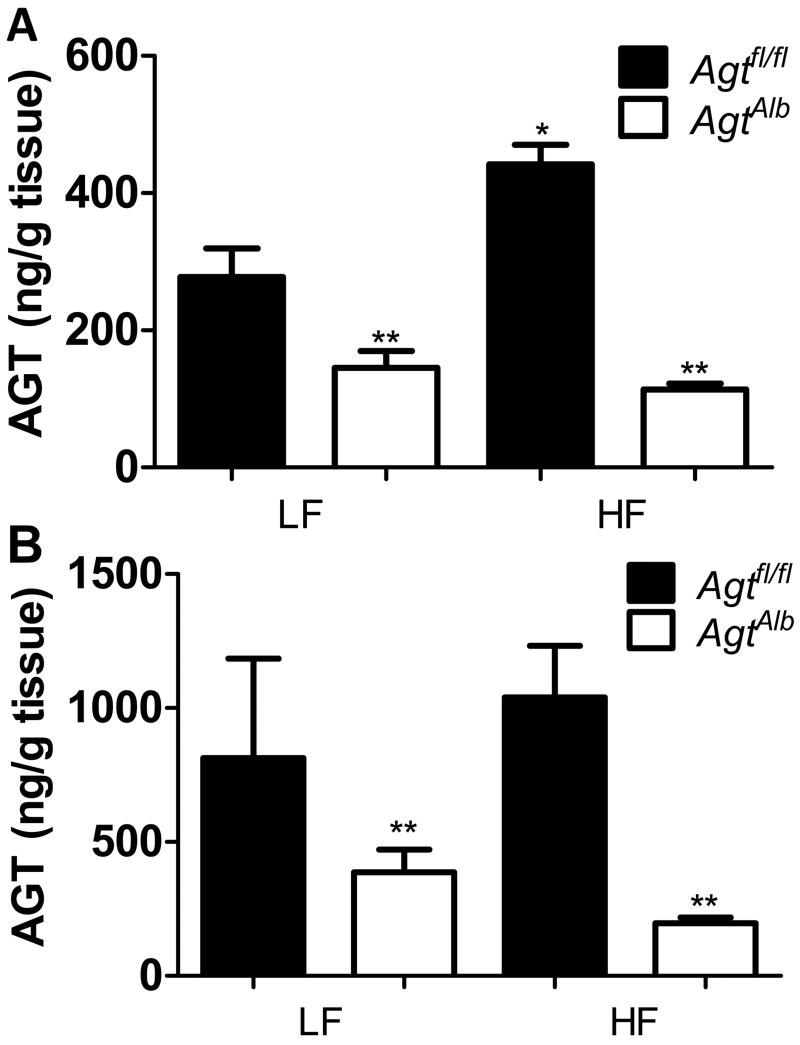
To determine the effect of hepatocyte AGT deficiency on the adipose RAS, we quantified AGT content in adipose tissue from mice of each group. Adipose tissue from HF-fed Agtfl/fl mice, but not AgtAlb mice, exhibited a significant increase in AGT content compared to LF-fed controls (Figure 4A; P<0.05). Moreover, AGT content in AgtAlb mice of each diet group was significantly decreased compared to Agtfl/fl controls. We also quantified release of AGT from adipose tissue explants from LF- and HF-fed mice of each genotype. The release of AGT from adipose explants from LF-and HF-fed Agtfl/fl mice was not significantly different (Figure 4B; P>0.05). In addition, there was no increase in AGT release from adipose tissue explants of HF-fed AgtAlb mice compared to LF-fed AgtAlb mice (Figure 4B). However, AGT release decreased significantly in adipose tissue explants from LF- and HF-fed AgtAlb mice compared to Agtfl/fl mice (Figure 4B; P<0.05).
Figure 4.
Hepatocyte deficiency of AGT reduced adipose AGT content and release. A, Adipose AGT content from mice of each group. B, Release of AGT (ng/g tissue) from epididymal adipose tissue explants from mice of each group. Data are mean ± SEM from n = 5-9 mice/group. *, compared to LF within genotype. **, P<0.05 compared to Agtfl/fl within diet group.
AngII stimulated megalin mRNA abundance and decreased AGT concentrations in media of 3T3-L1 adipocytes
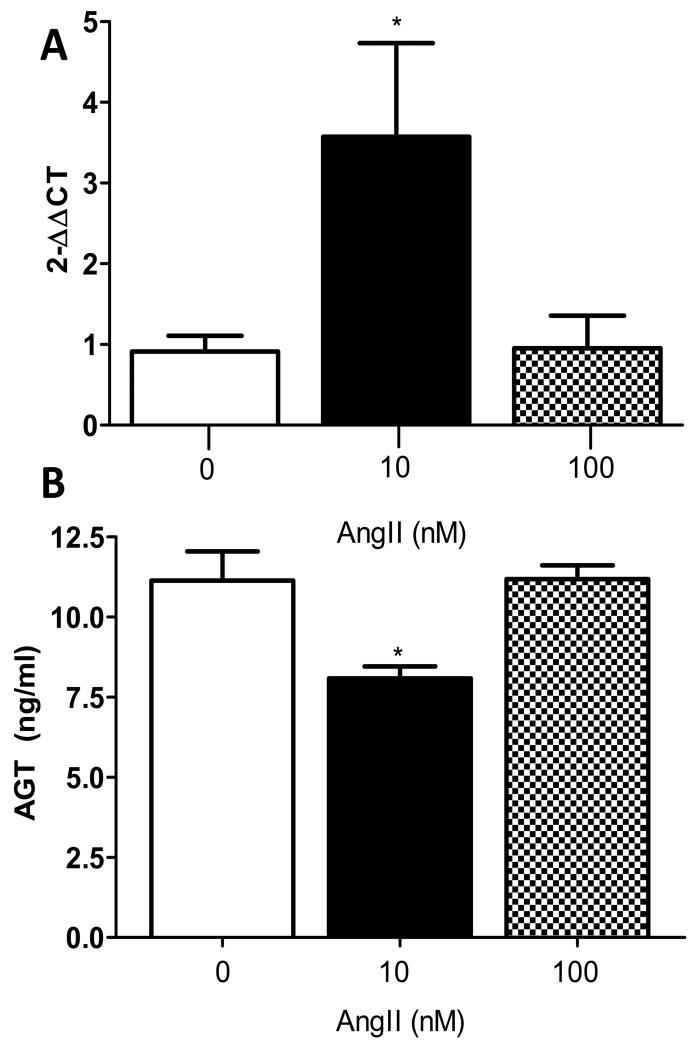
We hypothesized that AngII regulates megalin expression in adipocytes to influence local uptake of AGT in the feedback control of adipocyte AngII synthesis. At low concentrations (10 nM), AngII increased significantly megalin mRNA abundance in 3T3-L1 adipocytes (Figure 5A; P<0.05). However, at higher AngII concentrations (100 nM) there was no significant effect on megalin mRNA abundance. Concentrations of AGT in media from adipocytes incubated with AngII (10 nM) were decreased significantly compared to vehicle (0) (Figure 5B; P<0.05), but these effects were not apparent at higher AngII concentrations.
Figure 5.
AngII stimulates megalin mRNA abundance and reduces AGT concentrations in media of 3T3-L1 adipocytes. A, Adipocytes incubated with AngII (10 nM) exhibit increased mRNA abundance of megalin. B, AGT concentrations in media of adipocytes is decreased by AngII (10 nM). Data are mean ± SEM from n=6 replicates. *, P<0.05 compared to vehicle (0).
Hepatocyte-specific deficiency of AGT resulted in marked hypotension of HF- fed mice
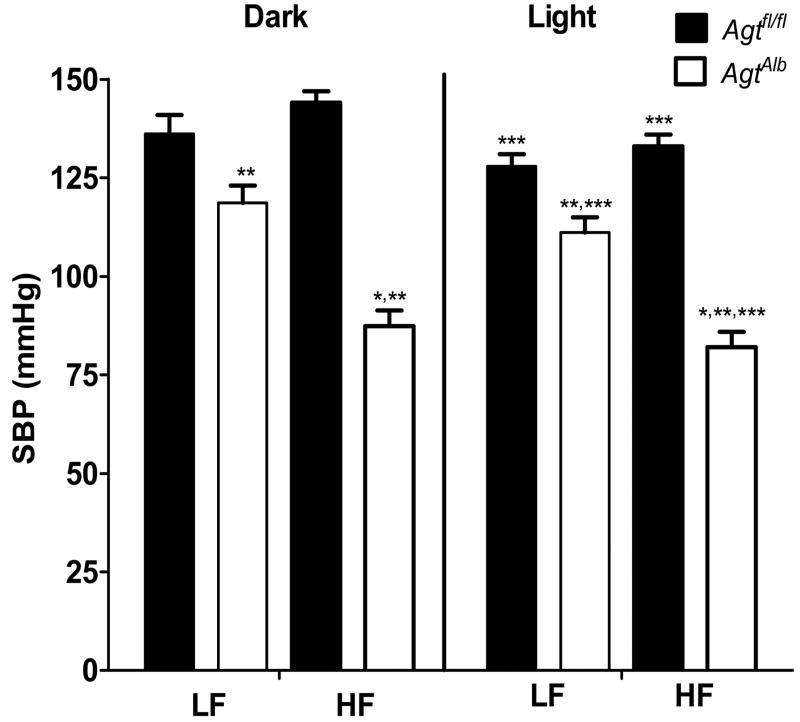
There was no significant difference in systolic blood pressure (SBP) during the dark and light cycle in HF-fed compared to LF-fed Agtfl/fl mice (Figure 6A). There was a significant increase in SBP during the dark compared to light cycle of Agtfl/fl and AgtAlb mice in both diet groups (P<0.05). In both LF- and HF-fed groups, hepatocyte AGT deficiency resulted in a significant reduction in SBP during the dark and light cycle compared to Agtfl/fl mice (Figure 6; P<0.05). The magnitude of reduction in SBP of AgtAlb mice was greater in HF-fed (40%, dark cycle) versus LF-fed mice (13%, dark cycle). Diastolic blood pressure (DBP; 24 hrs) was decreased significantly in AgtAlb mice compared to Agtfl/fl controls in both diet groups, with more pronounced reductions in HF-fed mice (Table 2; P<0.05). Reductions in DBP were evident during both the light and dark cycle in AgtAlb mice compared to Agtfl/fl controls (Table S2; P<0.05). Heart rate (24 hrs) was increased significantly in HF-fed mice of both genotypes compared to LF-fed groups (Table 2; P<0.05). Moreover, heart rate was higher in AgtAlb mice compared to Agtfl/fl controls, regardless of diet group (Table 2; P<0.05). Changes in heart rate according to diet and genotype were evident during the dark cycle (Table S2; P<0.05). Pulse pressure (24 hrs and light/dark cycle) was decreased significantly in HF-fed AgtAlb mice compared to Agtfl/fl mice (Table 2 and S2; P<0.05).
Figure 6.
Hepatocyte AGT deficiency results in marked hypotension in obese mice. Systolic blood pressure (SBP; dark and light cycle) of LF- and HF-fed Agtfl/fl and AgtAlb mice. Data are mean ± SEM from N = 5-10 mice/group. *, P<0.05 compared to LF within genotype and cycle. **, P<0.05 compared to Agtfl/fl within diet group and cycle. ***, P<0.05 compared to light cycle within group.
Table 2. Blood pressure parameters during 24 hours in LF- and HF-fed Agtfl/fl and AgtAlb male mice after 16 weeks of diet.
| Telemetry Parameters | LF Diet | HF Diet | ||
|---|---|---|---|---|
|
| ||||
| Agtfl/fl | AgtAlb | Agtfl/fl | AgtAlb | |
| MAP (mmHg) | 115±3 | 100±3† | 120±2 | 75±5*,† |
| DBP (mmHg) | 97±3 | 84±3† | 100±2 | 62±4*,† |
| PP (mmHg) | 34±2 | 30±2 | 39±01 | 25±1* |
| Heart Rate (beats/min) | 563±7 | 579±11† | 574±10* | 624±9*,† |
Data are mean ± SEM.
P<0.05 compared to LF within genotype.
P<0.05 compared to Agtfl/fl within diet group, N=5-10 mice/group.
Discussion
This study investigated the role of hepatocyte-derived AGT in blood pressure control during diet-induced obesity. As anticipated in LF-fed mice, hepatocyte deficiency of AGT reduced plasma AGT and AngII concentrations, reducing systolic and diastolic blood pressures. Results demonstrate that obesity-induced elevations in plasma AGT concentrations are hepatocyte-derived, since HF-fed mice with hepatocyte AGT deficiency exhibited marked reductions in plasma AGT concentrations. In addition, obese hepatocyte AGT deficient mice exhibited pronounced reductions in systemic AngII concentrations, and became hypotensive despite robust obesity. Surprisingly, as adipocytes express a high level of AGT that was demonstrated to contribute to the development of obesity-hypertension24, AGT content and release from adipose tissue explants were reduced in mice with hepatocyte AGT deficiency. mRNA abundance of megalin, a transporter reported to mediate AGT uptake by kidney17, was stimulated by low concentrations of AngII that decreased AGT concentrations in media. These results suggest that AngII stimulates megalin to increase adipocyte AGT uptake. Taken together, results suggest that reductions in plasma AngII concentrations of obese mice with hepatocyte AGT deficiency may contribute to reduced megalin-mediated uptake of hepatocyte-derived AGT by adipocytes. As a result, despite the presence of robust obesity, HF-fed mice with hepatocyte AGT deficiency become markedly hypotensive due to reductions in both adipose and systemic AngII production.
We demonstrated previously that adipocyte production of AGT accounted for approximately 25% of circulating AGT concentrations in mice (2 or 12 months of age, male and female) fed standard mouse diet.20 In the present study, hepatocyte AGT deficiency in LF-fed mice reduced plasma AGT concentrations (by 63%), suggesting that the remainder of circulating AGT is derived from other sources, including adipocytes.20 While these data from hepatocyte versus adipocyte AGT deficient knockout mouse models are consistent in their effects on plasma AGT concentrations, the magnitude of reductions in systemic AGT concentrations in hepatocyte AGT deficient mice in this study are less than previously observed.17 Previous results demonstrated that in male mice with diet-induced obesity, elevations in plasma AGT concentrations were not adipocyte-derived, as adipocyte AGT deficiency had no effect on obesity-induced increases in plasma AGT concentrations.24 In the present study, obesity-induced elevations in plasma AGT concentrations were totally abolished in male mice with hepatocyte AGT deficiency, supporting hepatocytes as the source of increased circulating AGT concentrations.
We demonstrated previously that adipocyte AGT is pivotal in obesity-induced increases in plasma AngII concentrations and the development of obesity-hypertension.24 Given these findings24, and that adipocytes express a relatively high level of AGT25, we were surprised by results demonstrating reductions in AGT content and release from adipose tissue explants of obese hepatocyte AGT deficient mice. These results suggest that adipocyte AGT/AngII production in obese mice is partially dependent on hepatocyte-derived AGT.
Previous studies demonstrated that liver-derived AGT influences the intrarenal RAS, with uptake and transcytosis of AGT via megalin in proximal tubule cells.19 Our results extend a potential role for megalin in AGT uptake into adipocytes. A novel finding of this study is that AngII stimulates megalin expression in adipocytes to potentially influence AGT uptake, a positive feedback loop that may contribute to local control of AngII synthesis. In obese AGT hepatocyte deficient mice with pronounced reductions in plasma AngII concentrations, decreased expression of megalin may have contributed to reduced AGT uptake in the feedback control of adipocyte AngII synthesis. We were also surprised to find that effects of hepatocyte AGT deficiency to reduce plasma AGT and AngII concentrations and blood pressure were more pronounced in obese than lean mice. Indeed, obese mice with hepatocyte AGT deficiency became hypotensive, with systolic blood pressures averaging 85 mmHg. A potential contributing factor to the pronounced effect of hepatocyte AGT deficiency to decrease plasma AngII concentrations and blood pressure of obese mice is suppression of both systemic and adipose AngII production.
Since kidney is a primary site for production and function of AngII, and has been implicated in the development of obesity-hypertension26, we quantified mRNA abundance of RAS components in kidneys from obese mice of each genotype. In agreement with previous findings17, we observed increased expression of renin and PRR in kidneys of obese hepatocyte AGT deficient mice. However, unlike findings from hepatocyte AGT deficient mice fed standard murine diet17, regulation of kidney RAS in obese mice with hepatocyte AGT deficiency was not associated with changes in renal pathology.
Supplementary Material
Perspectives.
These results demonstrate inter-dependency of the systemic and adipose RAS in the regulation of blood pressure in mice with diet-induced obesity. Deficiency of AGT in hepatocytes abolished obesity-induced elevations in plasma AGT concentrations, and plummeted plasma AngII concentrations. These effects were associated with hypotension despite obesity in hepatocyte AGT-deficient mice. Our findings suggest that AngII may stimulate megalin to increase adipocyte uptake of AGT, exerting positive feedback control over local AngII synthesis in obese mice. As a result, both adipose and systemic production of AngII decreased in mice with hepatocyte AGT deficiency, resulting in hypotension. These results suggest that targeted inhibition of hepatocyte-derived AGT may serve as an effective therapeutic target for obesity-induced hypertension. However, given that obese mice with hepatocyte AGT deficiency were markedly hypotensive, therapies resulting in modest reductions in hepatocyte AGT expression may have greatest benefit in the therapy of obesity-induced hypertension.
Novelty and Significance.
1. What is new?
Demonstration that hepatocyte AGT deficiency induces pronounced reductions in plasmas concentrations of AGT, AngII and blood pressure despite the continued presence of obesity in HF-fed mice.
Demonstration that hepatocyte-derived AGT deficiency influences adipose AGT content and release.
Demonstration that AngII stimulates megalin expression in adipocytes, potentially contributing to feedback control of adipose AngII synthesis.
What is relevant?
This study demonstrates that the RAS is a primary contributor to the control of blood pressure in mice with diet-induced obesity.
This study demonstrates inter-dependence of the systemic and adipose RAS in the control of blood pressure in mice with diet-induced obesity.
2. Summary
The effect of hepatocyte AGT deficiency to reduce blood pressure is profound in mice with diet-induced obesity, demonstrating a primary role for the RAS in the control of blood pressure in mice with diet-induced obesity.
In obese mice, elevated plasma AngII concentrations may promote megalin expression in adipocytes to increase AGT uptake and augment adipose production of AngII. In mice with hepatocyte AGT deficiency, reductions in plasma AngII concentrations may mitigate megalin-mediated AGT uptake and adipose AGT/AngII synthesis.
Acknowledgement
None.
Sources of funding
These studies were supported by the National Heart, Lung, and Blood Institute (HL73085, LAC; T32HL091812, FY), by the American Heart Association (13SDG17230008 FY; 14PRE20380163, YW), through funding for graduate student support (NIH T32DK007778; NL,LC) and through research cores supported by the National Institute of General Medical Sciences (GM103527; LAC).
Footnotes
Conflict of Interest/Disclosure(s) Statement
None.
References
- 1.Cutler JA, Sorlie PD, Wolz M, Thom T, Fields LE, Roccella EJ. Trends in hypertension prevalence, awareness, treatment, and control rates in United States adults between 1988-1994 and 1999-2004. Hypertension. 2008;52:818–827. doi: 10.1161/HYPERTENSIONAHA.108.113357. [DOI] [PubMed] [Google Scholar]
- 2.Boustany CM, Bharadwaj K, Daugherty A, Brown DR, Randall DC, Cassis LA. Activation of the systemic and adipose renin-angiotensin system in rats with diet-induced obesity and hypertension. Am J Physiol Regul Integr Comp Physiol. 2004;287:R943–949. doi: 10.1152/ajpregu.00265.2004. [DOI] [PubMed] [Google Scholar]
- 3.Gupte M, Boustany-Kari CM, Bharadwaj K, Police S, Thatcher S, Gong MC, English VL, Cassis LA. ACE2 is expressed in mouse adipocytes and regulated by a high-fat diet. Am J Physiol Regul Integr Comp Physiol. 2008;295:R781–R788. doi: 10.1152/ajpregu.00183.2008. [DOI] [PMC free article] [PubMed] [Google Scholar]
- 4.Kotsis V, Stabouli S, Papakatsika S, Rizos Z, Parati G. Mechanisms of obesity-induced hypertension. Hypertens Res. 2010;33:386–393. doi: 10.1038/hr.2010.9. [DOI] [PubMed] [Google Scholar]
- 5.Licata G, Corrao S, Parrinello G, Scaglione R. Obesity and cardiovascular diseases. Ann Ital Med Int. 1994;9:27–31. [PubMed] [Google Scholar]
- 6.Umemura S, Nyui N, Tamura K, Hibi K, Yamaguchi S, Nakamaru M, Ishigami T, Yabana M, Kihara M, Inoue S, Ishii M. Plasma angiotensinogen concentrations in obese patients. Am J Hypertens. 1997;10:629–633. doi: 10.1016/s0895-7061(97)00053-8. [DOI] [PubMed] [Google Scholar]
- 7.Yiannikouris F, Gupte M, Putnam K, Cassis LA. Adipokines and blood pressure control. Curr Opin Nephrol Hypertens. 2010;19:195–200. doi: 10.1097/MNH.0b013e3283366cd0. [DOI] [PMC free article] [PubMed] [Google Scholar]
- 8.Hermida RC, Ayala DE, Fernandez JR, Portaluppi F, Fabbian F, Smolensky MH. Circadian rhythms in blood pressure regulation and optimization of hypertension treatment with ACE inhibitor and ARB medications. Am J Hypertens. 2011;24:383–391. doi: 10.1038/ajh.2010.217. [DOI] [PubMed] [Google Scholar]
- 9.Huang SS, Wu TC, Lin SJ, Chen JW. Combination of an ACE inhibitor and indapamide improves blood pressure control, but attenuates the beneficial effects of ACE inhibition on plasma adiponectin in patients with essential hypertension. Circ J. 2009;73:2282–2287. doi: 10.1253/circj.cj-09-0387. [DOI] [PubMed] [Google Scholar]
- 10.Kolasinska-Malkowska K, Filipiak KJ, Gwizdala A, Tykarski A. Current possibilities of ACE inhibitor and ARB combination in arterial hypertension and its complications. Expert Rev Cardiovasc Ther. 2008;6:759–771. doi: 10.1586/14779072.6.5.759. [DOI] [PubMed] [Google Scholar]
- 11.Koren G. Hypertension: ACE inhibitor use in pregnancy--setting the record straight. Nat Rev Cardiol. 2012;9:7–8. doi: 10.1038/nrcardio.2011.179. [DOI] [PubMed] [Google Scholar]
- 12.Peck RN, Smart LR, Beier R, Liwa AC, Grosskurth H, Fitzgerald DW, Schmidt BM. Difference in blood pressure response to ACE-Inhibitor monotherapy between black and white adults with arterial hypertension: a meta-analysis of 13 clinical trials. BMC Nephrol. 2013;14:201. doi: 10.1186/1471-2369-14-201. [DOI] [PMC free article] [PubMed] [Google Scholar]
- 13.Vershinina AM, Gapon LI, Veber EE, Popova SN, Pliusnin AV. Effects of ACE inhibitor fosinopril on a 24-h profile of arterial pressure in hypertensive patients with obesity and hypercholesterolemia. Ter Arkh. 2005;77:55–58. [PubMed] [Google Scholar]
- 14.Mori Y, Tanaka T, Matsuura K, Yokoyama J, Utsunomiya K. Influence of telmisartan on insulin response after glucose loading in obese patients with hypertension: ARB trial of hypertension in obese patients with hyperinsulinemia assessed by oral glucose tolerance test (ATHLETE) Adv Ther. 2011;28:698–706. doi: 10.1007/s12325-011-0040-2. [DOI] [PubMed] [Google Scholar]
- 15.Tamura K, Umemura S, Sumida Y, Nyui N, Kobayashi S, Ishigami T, Kihara M, Sugaya T, Fukamizu A, Miyazaki H, Murakami K, Ishii M. Effect of genetic deficiency of angiotensinogen on the renin-angiotensin system. Hypertension. 1998;32:223–227. doi: 10.1161/01.hyp.32.2.223. [DOI] [PubMed] [Google Scholar]
- 16.Tanimoto K, Sugiyama F, Goto Y, Ishida J, Takimoto E, Yagami K, Fukamizu A, Murakami K. Angiotensinogen-deficient mice with hypotension. J Biol Chem. 1994;269:31334–31337. [PubMed] [Google Scholar]
- 17.Matsusaka T, Niimura F, Shimizu A, Pastan I, Saito A, Kobori H, Nishiyama A, Ichikawa I. Liver angiotensinogen is the primary source of renal angiotensin II. J Am Soc Nephrol. 2012;23:1181–1189. doi: 10.1681/ASN.2011121159. [DOI] [PMC free article] [PubMed] [Google Scholar]
- 18.Rohrwasser A, Morgan T, Dillon HF, Zhao L, Callaway CW, Hillas E, Zhang S, Cheng T, Inagami T, Ward K, Terreros DA, Lalouel JM. Elements of a paracrine tubular renin-angiotensin system along the entire nephron. Hypertension. 1999;34:1265–1274. doi: 10.1161/01.hyp.34.6.1265. [DOI] [PubMed] [Google Scholar]
- 19.Pohl M, Kaminski H, Castrop H, Bader M, Himmerkus N, Bleich M, Bachmann S, Theilig F. Intrarenal renin angiotensin system revisited: role of megalin-dependent endocytosis along the proximal nephron. J Biol Chem. 2010;285:41935–41946. doi: 10.1074/jbc.M110.150284. [DOI] [PMC free article] [PubMed] [Google Scholar]
- 20.Yiannikouris F, Karounos M, Charnigo R, English VL, Rateri DL, Daugherty A, Cassis LA. Adipocyte-specific deficiency of angiotensinogen decreases plasma angiotensinogen concentration and systolic blood pressure in mice. Am J Physiol Regul Integr Comp Physiol. 2012;302:R244–251. doi: 10.1152/ajpregu.00323.2011. [DOI] [PMC free article] [PubMed] [Google Scholar]
- 21.Kim S, Urs S, Massiera F, Wortmann P, Joshi R, Heo YR, Andersen B, Kobayashi H, Teboul M, Ailhaud G, Quignard-Boulange A, Fukamizu A, Jones BH, Kim JH, Moustaid-Moussa N. Effects of high-fat diet, angiotensinogen (agt) gene inactivation, and targeted expression to adipose tissue on lipid metabolism and renal gene expression. Horm Metab Res. 2002;34:721–725. doi: 10.1055/s-2002-38263. [DOI] [PubMed] [Google Scholar]
- 22.Massiera F, Bloch-Faure M, Ceiler D, Murakami K, Fukamizu A, Gasc JM, Quignard-Boulange A, Negrel R, Ailhaud G, Seydoux J, Meneton P, Teboul M. Adipose angiotensinogen is involved in adipose tissue growth and blood pressure regulation. FASEB J. 2001;15:2727–2729. doi: 10.1096/fj.01-0457fje. [DOI] [PubMed] [Google Scholar]
- 23.Massiera F, Seydoux J, Geloen A, Quignard-Boulange A, Turban S, Saint-Marc P, Fukamizu A, Negrel R, Ailhaud G, Teboul M. Angiotensinogen-deficient mice exhibit impairment of diet-induced weight gain with alteration in adipose tissue development and increased locomotor activity. Endocrinology. 2001;142:5220–5225. doi: 10.1210/endo.142.12.8556. [DOI] [PubMed] [Google Scholar]
- 24.Yiannikouris F, Gupte M, Putnam K, Thatcher S, Charnigo R, Rateri DL, Daugherty A, Cassis LA. Adipocyte deficiency of angiotensinogen prevents obesity-induced hypertension in male mice. Hypertension. 2012;60:1524–1530. doi: 10.1161/HYPERTENSIONAHA.112.192690. [DOI] [PMC free article] [PubMed] [Google Scholar]
- 25.Cassis LA, Lynch KR, Peach MJ. Localization of angiotensinogen messenger RNA in rat aorta. in rat aorta. Circ Res. 1988;62:1259–1262. doi: 10.1161/01.res.62.6.1259. [DOI] [PubMed] [Google Scholar]
- 26.Hall JE. The kidney, hypertension, and obesity. Hypertension. 2003;41:625–633. doi: 10.1161/01.HYP.0000052314.95497.78. [DOI] [PubMed] [Google Scholar]
Associated Data
This section collects any data citations, data availability statements, or supplementary materials included in this article.


