

Abstract
Acetylcholinesterase (AChE) inhibition has been described as the main mechanism of organophosphate (OP)-evoked toxicity. OPs represent a human health threat, because chronic exposure to low doses can damage the developing brain, and acute exposure can produce long-lasting damage to adult brains, despite post-exposure medical countermeasures. Although the main mechanism of OP toxicity is AChE inhibition, several lines of evidence suggest that OPs also act by other mechanisms. We hypothesized that rat neural progenitor cells extracted on embryonic day 14.5 would be affected by constant inhibition of AChE from chronic exposure to OP or pyri-dostigmine (a reversible AChE blocker) during differentiation. In this work, the OP paraoxon decreased cell viability in concentrations >50 μM, as measured with the MTT assay; however, this effect was not dose-dependent. Reduced viability could not be attributed to blockade of AChE activity, since treatment with 200 μM pyri-dostigmine did not affect cell viability, even after 6 days. Although changes in protein expression patterns were noted in both treatments, the distribution of differentiated phenotypes, such as the percentages of neurons and glial cells, was not altered, as determined by flow cytometry. Since paraoxon and pyridostigmine each decreased neurite outgrowth (but did not prevent differentiation), we infer that developmental patterns may have been affected.
Keywords: Organophosphates, Proteomics, Neural progenitor cells, Differentiation, Paraoxon
Introduction
Present in half of the pesticides used worldwide, organophosphate (OP) compounds have been widely used since the 1930s and were manufactured during World War II as highly toxic chemical warfare nerve agents [1]. OPs are potent, lipophilic neurotoxicants that irreversibly inhibit acetylcholinesterase (AChE) and cause acetylcholine (ACh) accumulation in the synaptic cleft [2]. The accumulation of ACh resulting from treatment with pysostig-mine [3], pyridostigmine (PY) [4], or other AChE inhibitors also has a therapeutic rationale. The purpose of this work was to analyze the cellular differentiation of neural progenitors when AChE is constantly inhibited by either an irreversible or reversible AChE inhibitor.
First, paraoxon (O, O-diethyl p-nitrophenylphosphate, POX), the bioactive metabolite of parathion, is generated in the liver by a cytochrome P450-mediated biotransformation [5]. POX inhibits AChE by a mechanism in which the OP–AChE intermediate is either hydrolyzed to produce an OP leaving group and a functional enzyme or dealkylated to produce a phospho–AChE covalent bond in the enzyme active site. This permanent bond irreversibly inactivates the enzyme and triggers the subsequent accumulation of ACh that leads to neural impairment [6].
There is evidence that POX affects neurons in multiple ways. For example, it induces apoptosis in rat neonate hippocampal cells [7] and a significant decrease in ATP production by interfering with mitochondrial metabolism in dorsal root ganglion cells [8].
On the other hand, because of its charged quaternary amine group, PY is not expected to cross the blood–brain barrier. However, Abou-Donia et al. [9] detected changes in senso-rimotor performance and a significant decrease in AChE activity in the rat midbrain after long-term exposure to PY.
The research employing constant inhibition of AChE in models that contain the three most important cell types of the brain is sparse. Therefore, we studied the effects of POX and PY on primary cultures of differentiating neural stem and progenitor cells (dNPCs). These cells can be isolated from the CNS of embryonic, neonatal, and adult rodents [10–12] and are of particular interest, because they retain their multi-lineage differentiation capacity. When they are expanded and maintained in the form of neuro-spheres [13], they can be differentiated into astrocytes, oligodendrocytes, and several types of neuron if the correct stimulus is added.
Until now, studies of the inhibition of AChE by POX and PY through irreversible or reversible mechanisms, respectively, have not been done in a cellular model that is able to differentiate into the major neural phenotypes present in the brain, which would closely reflect events during embryonic cortex development. Instead, most studies have been performed with undifferentiated neuroblastoma or neuron-like cells or using low POX concentrations. Accordingly, this study addresses the effects of toxic concentrations of POX and the clinically used PY on cell differentiation, neurite outgrowth, and protein expression patterns in a more suitable model for evaluating the consequences of continuous inhibition of AChE on differentiation.
Materials and Methods
Embryonic day-14 fetuses were removed from pregnant 14–16-week-old Sprague–Dawley rats weighing 250–300 g. Animals were kept in a temperature-controlled facility on a 12/12 h light–dark cycle. All procedures involving live animals were reviewed and approved by the IACUC and were carried out in agreement with current US National Institutes of Health guidelines.
Neurosphere Cell Culture
Primary cultures of dNPCs were aseptically obtained by dissection of the telencephalons of rat fetuses at 14.5 days post conception, as determined by vaginal smear [14]. Briefly, brain stem and meninges were removed from the telencephalon, and the resulting tissue was mechanically dissociated using a Stomacher 80 Biomaster blender (Se-ward Laboratory Systems, Port St. Lucie, FL, USA). Following centrifugation at 200×g, cells were filtered using a 40-μm cell strainer (BD), resuspended, and allowed to grow in suspension at a density of 2 × 10⁵ cells/ml in medium composed of 70 % Dulbecco’s Modified Eagle’s Medium (DMEM, high glucose, Life Technologies, Carlsbad, CA, USA) and 30 % F-12 nutrient mixture (life technologies) in the presence of 100 IU/ml of penicillin, 100 μg/ml streptomycin, 2 mM L-glutamine, 5 μg/ml heparin, 20 ng/ml fibroblast growth factor (FGF)-2, 20 ng/ ml epidermal growth factor (EGF), and 2 % B-27 supplements (v:v; Life Technologies) at 37 °C, 95 % humidity, and 5 % CO2. Cells were grown for 10 days in culture plates, and half of the medium was replenished at 3-day intervals, followed by the removal of growth factors and subsequent culture on plates with poly-D-lysine (50 μg/ml) and laminin (1 μg/ml) for 6 days to allow differentiation. Three experimental conditions were tested using three independent replicates: 200 μM paraoxon (POX) dissolved in propylene glycol (PG, Sigma), 200 μM pyridostigmine (PY) dissolved in PG, or PG vehicle alone. For simplicity, the presence of PG is unstated in the experimental treatments labeled ‘‘POX’’ or ‘‘PY’’. The cell viabilities obtained were compared with those obtained in cells treated with a concentration range of 0–300 μM of the OP PY, a therapeutically used acetylcholine esterase inhibitor [15]. The cells were exposed to POX, PY, and PG over 6 days for all experiments, except in Fig. 1c. POX (200 μM), PY (200 μM), or the same volume of PG were added on day 0. A half volume of medium was changed on day 4 using 2 % B27 and DMEM/F12 plus 200 μM POX, 200 μM PY, or the same volume of PG.
Fig. 1.

Interference of paraoxon (POX) and pyridostigmine (PY) with cell viability. MTT assay of differentiating neural progenitor cells treated with POX (a) or PY (b) for 6 days (treated cells vs. PG treatment *p <0.05). c MTT assay of differentiating neural progenitor cells treated with POX or PY and analyzed on days 2 and 4 (***p <0.001). d Representative immunocytochemistry using antibodies against β3-tubulin and a secondary antibody conjugated with Alexa Fluor® 488 (green), 5 μM propidium iodide (red), and 1 μg/ml of 4′,6-diamidino-2-phenylindole (DAPI, blue). Left panel quantification of the number of propidium iodide-positive cells (p <0.001). Percentage of cell death determined by the intensity ratio propidium iodide/DAPI. Values are the mean number of cells in three independent experiments. Statistical analysis was performed using one-way ANOVA followed by the Tukey test (a, b, c) or by Student’s t-test (d)
Cell Viability Determination by the Methylthiazol Tetrazolium (MTT) Assay
Cells (6 × 10⁴) were seeded in 96-well plates (Corning) and treated with several concentrations (50–300 μM) of POX or PY (Sigma) or propylene glycol (PG), and cells without PG were used as control. A total of 25 μl of MTT solution (5 mg/ml, Sigma) was added to each well containing 200 μl, and the cells were then incubated at 37 and 5 % CO2 for 4 h. After incubation, the MTT was discharged, and 200 μl of dimethyl sulfoxide (DMSO) was added to each well. Subsequently, cell viability was assessed by measuring the OD550 on a SpectraMax spectrophotometer (Molecular Devices, Sunnyvale, CA, USA).
Immunocytochemistry
Differentiating NPC cell viability was determined following incubation for 10 min with 5 μM propidium iodide (Calbiochem). For immunofluorescence staining, cells were first incubated with 4 % paraformaldehyde and then incubated for 30 min using a blocking solution (1 % BSA, 0.5 % Triton-100, 10 % fetal bovine serum [FBS], and 10 % methanol in PBS) at 25 °C and washed twice for 5 min with PBS. The cells were then incubated overnight in the presence of an anti-β3 tubulin rabbit monoclonal antibody (Abcam, 1:750 dilution) in a solution of 1X PBS, 0.5 % Triton-100, and 1 % FBS. The cells were washed three times with PBS, followed by incubation with a secondary antibody conjugated with the green fluorescence-emitting probe Alexa Fluor® 488 (1:1000; Molecular Probes) in a solution of 1X PBS and 1 % FBS for 1 h at room temperature, followed by washing with PBS. Images were taken on an Olympus IX70 microscope equipped with a QColor 5 camera (Olympus, Center Valley, PA, USA).
AChE Assay
AChE activity was measured using the Ellman assay [16]. The cells were homogenized in Triton buffer (sodium phosphate buffer, 0.1 M, pH 8.0, 1 % Triton X-100) at a concentration of 100 mg cells per ml buffer. The homogenates were centrifuged at 12,000g for 1 min. Supernatants were collected, and tetraisopropyl pyrophosphoramide was added to inhibit butyrylcholinesterase. The samples were homogenized once again in Triton buffer and incubated in the dark for 5 min at 25 °C. Acetylthiocholine (ACHI) substrate (Sigma) was added to each well, and the enzyme kinetics at OD405 were recorded. AChE activity was measured in duplicate in at least three experiments, and enzymatic activity was normalized to the protein concentration, as determined using Bradford reagent (Bio-Rad).
Flow Cytometry
Flow cytometry procedures were in accordance with a previously published protocol, with a few modifications [10]. dNPCs were collected by centrifugation at 300×g for 5 min, dissociated to a single-cell suspension using 5 ml of trypsin (0.05 %), and treated with 2 % FBS (GIBCO) to inhibit trypsin activity. The cells were then centrifuged at 300×g for 5 min and fixed in PBS/1 % formaldehyde for 20 min on ice, followed by a triple wash in PBS/2 % FBS. Differentiation of neuronal and glial cells was probed with antibodies directed against neuronal β3-tubulin (1:100, dilution, Abcam) or glial fibrillary acidic protein (GFAP, 1:500 dilution, Sigma). Cells were incubated for 1 h at 25 °C in PBS supplemented with 2 % FBS and 0.05 % Triton X-100. A secondary antibody conjugated with Alexa-Fluor® 488 (1:1000 dilution, Molecular Probes) was used for detection of β3-tubulin. After 2 h, the cells were washed and analyzed by using a flow cytometer (FACSCALIBUR, BD, San Jose, CA, USA). An argon laser line was used for fluorescence excitation (FL1, 488 nm and FL2, 635 nm, with band pass filter). Background fluorescence was measured using unlabeled cells and cells labeled with secondary antibody alone, which were used to set gating parameters between positive and negative cell populations. Forward and side light-scatter gates were used to exclude cell aggregates and small debris. In a total of ten thousand events, normalized with negative controls and incubated without the primary antibody, were acquired per sample. Data were analyzed and plotted in one-parameter histogram format.
Sholl Analysis
Images obtained using antibodies against β-3 tubulin and the respective secondary antibody conjugated with Alexa Fluor® 488 were analyzed with the Image J program for changes in neurite outgrowth [17]. The plug-in Fiji creates concentric circles around the cell body to trace the primary neurites. The radius of the circles were 16, 24, 33, 41 and 66 μm. The number of intersections between primary neurites and each of the circles of increasing radio was quantified. Neurites that crossed several circles were counted every time they intersected a circle and neurites smaller than 16 μm were not counted at all. For each treatment, the intersections between circles and the neurites from 60 neurons were measured, and the calculated numbers were expressed as the average of neurites per neuron that crossed a circle of a given radius.
Proteomics
High-Resolution 2D Gel Electrophoresis
To obtain highly resolved 2D patterns, different optimization steps were necessary to improve focusing and to reduce gel streaking. Differentiated neurospheres treated with PG, POX, or PY, containing 150 μg of total protein, and rehydration buffer (8 M urea, 2 % CHAPS, 0.2 % carrier ampholytes, and 10 mM DTT for immobilized pH gradient [IPG] strips, pH 3–6, pH 5–8, and pH 7–10, Bio-Rad, Hercules, CA, USA), and rehydrated overnight at room temperature (RT). The samples were mixed gently for 1 h at room temperature before centrifugation at 18,000×g for 30 min to remove particulates. For the first-dimension separation, dNPC extracts were loaded onto an IPG strip by overnight passive in-gel rehydration at 20 °C for at least 12 h, after which isoelectric focusing (IEF) was run for a total of 20,000 Vh. All IEF took place on a Bio-Rad protein IEF cell with a surface temperature of 20 °C and a maximum current of 50 μA/strip. Following IEF, the strips were reduced for 15 min in equilibration buffer (6 M urea, 0.05 M Tris–HCl, pH 8.8, 2 % SDS, and 20 % glycerol) containing 2 % DTT and then alkylated for 10 min in equilibration buffer containing 2.5 % iodoacetamide. The second-dimension separation was performed on 4–20 %-gradient SDS–polyacrylamide gels. After 6 days of treatment or its absence, dNPC extracts were run on 2D-PAGE gels in triplicate. Electrophoresis proceeded at 15 mA/gel for the first 15 min and then at 30 mA/gel. For analysis, the 2D gels were routinely stained with Coomassie blue G-250.
Image Analysis of 2D Gels Using PDQuest Software
Coomassie blue-stained gels were scanned using the Ver-saDoc model 1000 image system running Quantity One version 4.3.0 software (Bio-Rad, Hercules, CA, USA). Gel image analysis was performed with PDQuest software version 7.4.0 (Bio-Rad). Differentially expressed proteins of interest were marked for excision. An experimental set was created for pI 3–10 gels and another for pI 3–6, 5–8, 7–10 gels, with each set containing images of nine gels (three images per treatment). After automatic detection of spots using PDQuest software, the files were manually edited to correct for artifacts. The software calculated individual spot ‘‘volumes’’ by density/area integration. To eliminate gel-to-gel variation, individual spot volumes for each gel were normalized relative to the total spot volume of the gel. Normalized spot volume data from each experimental set were exported to Microsoft Excel. Differences in expression of 2D spots between the control cells and cells differentiated in the presence of PY or POX were analyzed by Student’s t test using p < 0.05 as the criterion for statistical significance. Spots showing a >onefold increase or decrease in protein expression were selected for identification by peptide mass fingerprint. From each of the analyzed samples, three biological replicates with two independent protein extractions were performed, and three replicate two-dimensional gels were prepared from each protein extract.
Statistical Analysis
Data were analyzed for statistical significance using one-way ANOVA or Student’ s t-test, as implemented with SigmaPlot version 11.00 software (Systat Software, San Jose, CA, USA). Statistical relevance was set at p < 0.05.
Results
Impact of Paraoxon and Pyridostigmine on Viability of Differentiating Neural Progenitor Cells
Cytotoxic effects of a 6-day treatment with POX and PY (50–300 μM) on dNPC viability were evaluated by using the MTT assay in comparison with untreated cells (control) or with the PG vehicle (Fig. 1a, b, p <0.05). POX also decreased the cell viability on days 2 and 4 when 200 μM of POX or PY were added, as observed in Fig. 1c (p <0.001, n = 3 for each treatment). The percentage of membrane damage (the intensity ratio propidium iodide/DAPI) shows a statistically significant difference between the groups (p <0.001), confirming a decrease in cell viability in the presence of POX. On the other hand, PY did not affect cell viability at the concentrations used. (Fig 1b, c).
Differentiating NPCs Shows Active AChE that is Inhibited by Paraoxon and Pyridostigmine
Differentiating NPCs had detectable AChE activity that was partially inhibited by POX and PY, as measured by the Ellman assay. At the concentration of 200 μM, POX decreased the AChE activity of dNPCs to 0.130 μmol/min/ mg of protein ± 0.011 in comparison with 0.278 μmol/ min/mg of protein ± 0.0298 (mean ± S.E.M., p < 0.05) for PG, and PY decreased the activity to 0.116 ± 0.0145 (mean ± S.E.M., n = 3, Fig. 2).
Fig. 2.
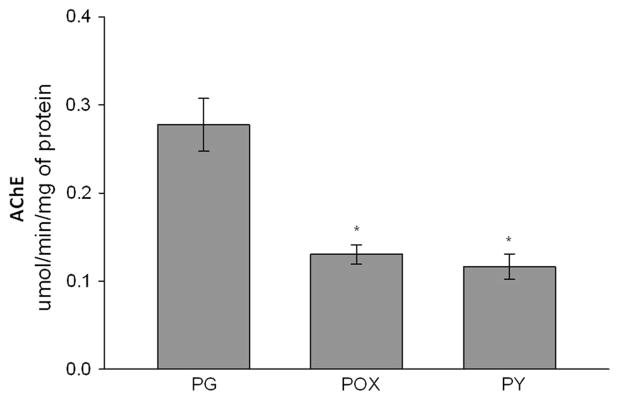
AChE activity in differentiating neural progenitor cells in the presence of propylene glycol (PG), paraoxon (POX), or pyridostig-mine (PY). The cells were harvested on day 6 after treatment. AChE activity was measured using the Ellman assay, and the results were as follows: PG, 0.28 ± 0.03 (mean ± S.E.M.), n = 6; POX, 0.13 ± 0.01, n = 6; PY, 0.12 ± 0.015, n = 9. *p < 0.05. Statistical analysis was performed using one-way ANOVA followed by the Student–Newman–Keuls test
Impaired Neurite Outgrowth in Neurospheres Differentiated in the Presence of Paraoxon and Pyridostigmine
Apart from developmental processes where migration and neurite outgrowth are essential for completing neural connections, reestablishment of lost neuronal connections is crucial for repair of brain damage and maintaining synaptic plasticity [18]. Therefore, any inhibitory effects on neurite outgrowth can be judged as developmental toxicity [19] as well as a neurotoxic effect on physiological brain function [20]. After 6 days of treatment, dNPCs showed a reduction in the number of neurite in cells treated with 200 μM POX or 200 μM PY in comparison with PG controls, cultured the absence of inhibitors. The number of neurites was estimated by the number of intersections with circles of 16, 24, 33, 41 μm radiuses. Within each of these radiuses, there was the same significant approximately 20 % decrease in intersections in comparison with the PG controls. Between 41 and 66 μm there was a decrease in the number of intersections in the three groups, however, the difference between PG controls and cells exposed to AChE inhibitors was the same (Fig. 3). Therefore, the exposure to POX or PY decreased the number but not the length of neurites.
Fig. 3.

Paraoxon decreases the number of neurite per neuron after 6 days of treatment with either POX or PY. Morphological (Sholl) analysis was performed on differentiating neural progenitor cells stained with an antibody against β3-tubulin. **p < 0.01. Statistical analysis was performed using one-way ANOVA followed by the Tukey test, n = 60, for each treatment. Black bar control, Gray POX, White PY
The Cellular Fate of Neural Progenitor Cells is Not Affected by POX or PY
Following induction of the embryonic telencephalon, NPCs differentiate into the three principal types of brain cells, with neurons and astrocytes constituting the majority, and oligodendrocytes representing <10 % of the population [10]. A flow cytometry assay was performed to assess how the differentiation of NPCs into astrocytes and neurons is affected by the continuous inhibition of AChE by 200 μM POX or PY over 6 days. No significant difference in the relative distribution of neurons and astrocytes, as determined by the expression of β3-tubulin and GFAP, respectively, was observed for NPCs treated with PG, POX, or PY (Fig. 4).
Fig. 4.

Maintenance of cellular fate decision of differentiating neural progenitor cells in the presence of paraoxon (POX), pyridostigmine (PY), or the vehicle control propylene glycol (PG). Flow cytometry analysis using antibodies against GFAP and β3-tubulin after 6 days of differentiation with different treatments. The graphs shown are one-parameter histograms with cell counts on the y-axis and the measurement parameter on the x-axis. Blank cells, without primary antibodies and with control-only secondary antibody. There were no significant differences between the control-, PY-, and POX-treated groups
Changes in Protein Expression Profiles of Differentiating NPCs in the Presence of Paraoxon and Pyridostigmine
Proteomics analysis using two-dimensional gel electrophoresis was performed for detection of altered protein expression in dNPCs in the presence of POX (Fig 5).
Fig. 5.

Overview of two-dimensional gel electrophoresis (2D-GE) showing protein profiles in differentiating neural progenitor cells in the presence of propylene glycol (PG) vehicle, paraoxon (POX), or pyridostigmine (PY). The blue triangles represent differentially expressed proteins in comparison with POX and PY; the red triangles represent the differentially expressed proteins following POX treatment; and the green triangles represent the differentially expressed proteins following PY treatment in comparison with PG. The spots on the 2D gels that are common to all the three conditions are indicated with capital letters. All experiments were performed in triplicate
A Venn diagram (Fig. 6) was created to organize the number of unique and shared proteins between the different groups (control, POX, and PY). In order to merge the protein expression level of the three different 2D gels of neural progenitor cells in the presence of PG, POX, or PY, a multichannel viewer from PD quest software overlapping the three 2DS images was used (Fig. 7). Analysis of all three treatments revealed 116 proteins in common (Fig. 6), with controls and PY-treated neurospheres sharing 47 proteins, PG- and POX-treated neurospheres sharing 42 proteins, and POX- and PY-treated neurospheres having 47 proteins in common. On the other hand, 35 proteins were exclusively expressed in PG-treated cells, 30 in POX-treated cells, and 37 in PY-treated cells (Fig. 6). Fifty-nine differentially expressed proteins were further analyzed for their expression pattern and compared with the PG vehicle. In Fig. 5, 34 of these proteins are shown. A significant reduction in protein expression of POX-treated cells was observed for cofilin; heat shock protein 1; Rho GDP dissociation inhibitor (GDI) alpha; serine (or cysteine) proteinase inhibitor, clade H; germinal histone H4 gene; D-3-phosphoglycerate dehydrogenase; B-36 VDAC, a 36-kDa voltage-dependent anion channel; and glyceraldehyde-3-phosphate dehydrogenase. On the other hand, PY-treated cells showed a significant reduction in tumor-rejection antigen gp96 precursor, protein disulfide-isomerase A3, eukaryotic translation initiation factor 4H, serum albumin precursor, and actin, cytoplasmic 2. Other protein expression patterns were shared that were not diminished to the same extent; for example, ATP synthase subunit alpha, mitochondrial precursor was decreased 12.5 fold in POX and 3.57 in PY (Table 1). In sum, proteomics analysis revealed differential expression of structural, nuclear and metabolic proteins, indicating that dNPCs undergo structural and cell signaling changes in the presence of POX or PY.
Fig. 6.

Venn diagram of common and uniquely expressed proteins in differentiating neural progenitor cells cultured in the presence of propylene glycol (PG), paraoxon (POX), or pyridostigmine (PY)
Fig. 7.
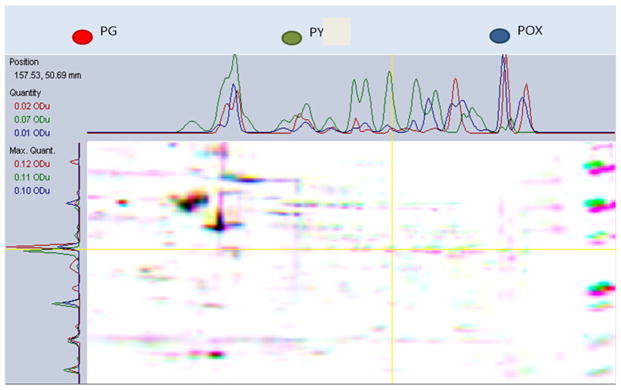
Multichannel viewer highlighting the overlay of three 2D gels of neural progenitor cell proteins in the presence of propylene glycol (PG), paraoxon (POX), or pyridostigmine (PY). The images depict a computer-generated, color-coded comparison between the three samples and exhibit intensity variations in the x- and y-directions
Table 1.
Proteins differentially expressed in differentiating neural progenitor cells treated with paraoxon (POX), pyridostigmine (PY), or propylene glycol (PG) and identified by peptide mass fingerprinting
| Spots | GI# | Protein name | MW (kDa) | PI | Peptides | Protein scores | Gel (spot location) | Fold change POX compared to PG | Fold change PY compared to PG |
|---|---|---|---|---|---|---|---|---|---|
| l | 8393101 | Cofilin-l | 18.75 | 8.22 | 11 | 376 | PY | −1.2 | 1.97 |
| 2 | 34740335 | Tubulin, alpha 1B | 50.80 | 4.94 | 16 | 1160 | PY | 1.315 | 11.32 |
| 3 | 183396771 | Heat shock protein 1 (chaperonin) | 61.09 | 5.91 | 22 | 1130 | PY | −1.75 | 1.29 |
| 4 | 4501887 | Actin, gamma 1 propeptide | 42.11 | 5.31 | 10 | 521 | PG | Unique in PG | −2.27 |
| 5 | 149064296 | Isoform CRA_c, rCG46767 | 66.87 | 5.11 | 23 | 441 | PG | Unique in PG | −1.29 |
| 6 | 31982030 | Rho GDP dissociation inhibitor (GDI) alpha | 23.45 | 5.12 | 9 | 522 | PY | Unique in PG | 2.86 |
| 7 | 40538742 | ATP synthase subunit alpha, mitochondrial precursor | 59.83 | 9.22 | 19 | 677 | PG | −12.5 | −3.57 |
| 8 | 117935064 | Triosephosphate isoraerase | 27.34 | 6.89 | 13 | 449 | PG | Unique in PG | −7.73 |
| 9 | 157823517 | Ladybird homeobox 2 | 21.27 | 6.63 | 7 | 53 | PY | 28 | 49 |
| 10 | 157818781 | Protein kinase C substrate 80 K-H | 60.15 | 4.41 | 15 | 564 | PG | Unique in PG | −1.29 |
| 11 | 12025526 | Histone H2B type 1 | 13.98 | 10.36 | 6 | 360 | PG | Unique in PG | −1.31 |
| 12 | 149068858 | Serine (or cysteine) proteinase inlubitor, clade H | 45.10 | 9.01 | 17 | 308 | PY | Unique in PG | 9.2 |
| 13 | 157059865 | Heterogeneous nuclear ribonucleoprotem 80b | 34.00 | 9.04 | 14 | 543 | POX | 2.33 | 1.02 |
| 14 | 109504921 | Germinal histone H4 gene | 11.42 | 11.36 | 5 | 311 | PY | Unique in PG | 3.67 |
| 15 | 21746161 | Tubulin, beta | 50.38 | 4.78 | 12 | 317 | PG | −1.38 | −2.23 |
| 16 | 6756041 | Tyrosine 3-monooxygenase/ tryptophan 5-monooxygenase activation aotein, zeta polypeptide | 27.92 | 4.73 | 12 | 277 | PG | −1.09 | −1.51 |
| 17 | 9507245 | 14-3-3 protein gamma | 28.46 | 4.8 | 6 | 182 | POX | 1.78 | Unique in PG |
| 18 | 5453555 | Ras-related nuclear protein | 24.58 | 7.01 | 8 | 318 | PG | −2.54 | −3.08 |
| 19 | 8394009 | Peptidyi-prolyi cis–trans isomerase A | 18.09 | 8.34 | 6 | 93 | PG | −1.6 | −4.74 |
| 20 | 25453420 | Glutathione S-transferase P | 23.65 | 6.89 | 8 | 450 | PG | −1.46 | −1.3 |
| 21 | 51859516 | Heat shock protein 90 kDa alpha (cytosolic), class B | 83.63 | 4.97 | 25 | 870 | PG | −2.56 | −1.28 |
| 22 | 210032365 | Tumor rejection antigen gp96 precursor | 93.00 | 4.72 | 26 | 523 | POX | 4.14 | Unique in PG |
| 23 | 158186649 | Alpha-Enolase isoform 1 | 47.44 | 6.16 | 14 | 575 | POX | 2.19 | 2.89 |
| 24 | 13928850 | D-3-phosphoglycerate dehydrogenase | 57.26 | 6.28 | 19 | 726 | PG | −1.64 | 1.46 |
| 25 | 1352384 | Protein disulfide-isomerase A3 | 57.04 | 5.88 | 21 | 555 | PY | 1.55 | −1.84 |
| 26 | 55741S53 | Lukaryotic translation initiation factor 4H | 27.36 | 6.67 | 1 | 100 | POX | 1.11 | Unique in PG |
| 27 | 299036 | B-36 VDAC = 36kda voltage dependent anion channel | 32.33 | 7.44 | 10 | 336 | POX | −2.68 | 1.05 |
| 28 | 158138568 | Serum albumin precursor | 70.71 | 6.09 | 4 | 60 | PG | 1.25 | Unique in PG |
| 29 | 149021114 | Vimentin, isoform CRA_b | 53.73 | 5.06 | 30 | 804 | POX | 1.46 | 0 |
| 30 | 5803225 | Tyrosine 3/tryptophan 5 - monooxygenase activation protein | 29.33 | 4.63 | 17 | 714 | POX | −1.57 | −3.36 |
| 31 | 109484558 | Glyceraldehyde-3-phosphate dehydrogenase | 36.05 | 8.44 | 7 | 439 | PG | −1.09 | 1.46 |
| 32 | 109492380 | Actin, cytoplasmic 2 | 59.16 | 5.67 | 15 | 518 | PY | 8.43 | Unique in PG |
| Spots | GI# | Protein name | MW (kDa) | PI | Peptides | Protein scores | Gel (spot location) | Fold change POX compared to PG | Fold change PY compared to PG |
| 33 | 109486214 | Phosphatidyiirtositol-3-phosphate/ phosphatidyiirtositol | 245.02 | 6.35 | 24 | 64 | POX | −3.86 | −1.08 |
| 34 | 62664759 | Prohibitin | 27.76 | 5.44 | 12 | 670 | PG | 1.65 | 0 |
Discussion
The main purpose of this study was to determine the effect of constant inhibition of AChE by high concentrations of POX or PY, which are irreversible and reversible inhibitors of AChE, respectively, in driving cell differentiation of NPCs to a specific cell type and also to evaluate whether AChE inhibition is responsible for decreased cell viability. A dose–response curve was obtained to establish the cytotoxic threshold concentrations for PY and POX by using the MTT assay (Fig. 1a–c). Exposure to POX decreased cell viability at concentrations in the range 50–300 μM in a concentration-independent fashion. In addition, we observed that only a small population (25 %) is susceptible to concentrations >50 μM POX, which is not in agreement with Buzanska et al. [21] and Visan et al. [22]. Busanska used the OP chlorpyrifos in neuronal-committed human umbilical cord blood-derived neural stem cells (HUCB-NSCs) and observed decreasing cell viability in which 60 μM decreased viability to 16 %. Visan found that concentrations <10 μM of chlorpyrifos reduced cell viability of D3 cells to<20 %. The discrepancy between these findings and those presented in this paper, could be the result of differences between OPs. For instance, even though chlorpyrifos and POX possess similar chemical structures, there are differences in inhibitory potency against AChE at high concentrations [23]. Alternatively, there could be differences between cell types, such as cells derived from human umbilical cord versus rat neural progenitors. On the other hand, Bahrami et al. [7] showed that POX induces apoptosis in a dose-dependent manner when using isolated neonatal hippocampal cells. These discordant results could also be attributed to several other factors, including the use of neonatal versus embryonic tissue or to previous observations that hippocampal neurons are especially sensitive to OP.
Because AChE inhibition is the predominant action of OP, the next step was to verify whether POX-mediated apoptosis is triggered by AChE inhibition in dNPCs. To this end, we used 200 μM PY, which did not change cell viability on days 2, 4, and 6. Since PY and POX decreased AChE activity of dNPCs on day 6 when compared with control dNPCs in the absence of AChE inhibitors, these results suggest that dNPC viability is independent of AChE inhibition. Having evaluated cell viability, the next step was to verify whether inhibition of AChE decreases neurite growth, as suggested by Yang for dorsal root ganglion neurons [24]. Here we evaluated whether 200 μM POX or PY decreases neurite outgrowth during NPC differentiation. As expected, a significant decrease in neurite outgrowth was detected by continuous AChE inhibition using Sholl analysis. It is important to highlight that this analysis included the length of neurite up to a maximum of 66 μm and did not include neurite beyond this value. Although, the decrease of the number of neurite crossing the Sholl circles can be attributed to several factors we can rule out the effect of decreased viability, since PY did not decrease the viability and still decreased the number of neurites intersecting the circles. In view of this result, the inhibition of AChE must cause alterations in the differentiation and cellular phenotype specification [25]. Therefore, the progress of neural differentiation was verified by quantification of β3-tubulin-positive cells (neurons) and glial fibrillary acidic protein (astrocytes) by flow cytometry, which is the method previously used for this purpose [10, 26]. No significant difference in the percentages of β3-tubulin-positive cells (neurons) or GFAP-positive cells (astrocytes) was observed along NPC differentiation. It can be concluded that inhibition of AChE by 200 μM POX was not enough to affect the fate of NPC differentiation. On the other hand, POX treatment resulted in a decrease in cell viability and neurite outgrowth measured as crossings of Sholl circles, thus affecting the progress of NPC differentiation. As the involvement of non-cholinergic mechanisms in neural differentiation is far from being understood, a proteomics approach was undertaken to study differential protein expression patterns in the absence and presence of AChE inhibitors. Comparing the three treatments by analysis of two-dimensional gels, we found 35, 30, and 37 proteins expressed uniquely in the presence of PG alone, POX, or PY, respectively (Fig. 5). The results obtained suggest mechanisms of action not shared by the two AChE inhibitors, POX, and PY. A possible explanation for such differences could be that POX is an irreversible while PY is a reversible, inhibitor of acetylcholinesterase. However, in both cases acetylcholinesterase remained inhibited for 48 h after the last dose, proving this possibility to be incorrect. In fact, these results suggest that POX causes other cellular effects that are independent of AChE inactivation. In order to identify the differentially expressed proteins for each treatment (PG, POX, and PY), a mass spectrometry analysis was performed for 59 differentially expressed protein spots, of which we show 34. Proteins related to cy-toskeleton, metabolism, and glycolysis, as well as transcription factors, are differentially expressed by POX- and PY-treated cells, with PG-treated cells used as controls. Expression of cytoskeletal proteins, such as actin gamma 1 propeptide, beta tubulin, and profilin-1 (not shown), are decreased in POX- and PY-treated cells, in agreement with the observed decrease in neurite outgrowth. The ATP synthase alpha subunit is present in the mitochondrial membrane and produces ATP from ADP in the presence of a proton gradient across the membrane, which is generated by electron transport complexes of the respiratory chain. Expression of this protein is down-regulated 12.5 fold in comparison to PG exposure while following PY exposure, its expression is diminished 3.5 fold. Expression of the glycolytic protein glyceraldehyde 3-phosphate dehydrogenase is reduced, while PY exposure led to increased expression of this protein by a factor of 1.46 fold. The observed decreased expression of these proteins is expected to result in low energy production, which would explain the decreased viability of cells treated with POX. In summary, these results suggest that dNPCs treated with POX or PY undergo a series of structural and molecular changes, which may be responsible for impaired neurite outgrowth. Increased cell death was observed only in POX-treated cells, providing novel evidence for OP effects and AChE inhibition of NPC differentiation.
Acknowledgments
This work was supported by the following NIH Grants: NINDS SNRP U54NS083924 (AHM), NIMHD RTRN Small Grant U54RR022762 (AHM), NIMHD 8G12MD007583 RCMI Biomedical Proteomics Facility (NMB), NIMHD 8G12MD007583 RCMI Neural Glial Facility (PAF). The authors wish to thank Madeline Rodriguez and Sheila Lopez for their valuable research contribution during the preparation of this manuscript and the Proteomics Center at the University of Texas Medical Branch for the mass spectrometry service. HU acknowledges grant support from Fundação de Amparo à Pesquisa do Estado de São Paulo (FAPESP) and Conselho Nacional de Desenvolvimento Científico e Tecnológico (CNPq), Brazil. CAT and PDN acknowledge fellowship support from FAPESP. SLBO was supported by CNPq.
Footnotes
Special Issue: In Honor of Lynn Wecker.
Conflict of interest The authors declare that they have no conflict of interest.
Contributor Information
Verónica O. Berríos, Department of Biochemistry, Universidad Central del Caribe, Ave. Laurel #100, Santa Juanita, P.O. Box 60327, Bayamón, PR 00960-6032, USA
Nawal M. Boukli, Department of Microbiology and Immunology, Biomedical Proteomics Facility, Universidad Central del Caribe, P.O. Box 60327, Bayamón, PR 00960-6032, USA
Jose W. Rodriguez, Department of Microbiology and Immunology, Universidad Central del Caribe, P.O. Box 60327, Bayamón, PR 00960-6032, USA
Priscilla D. Negraes, Departamento de Bioquímica, Instituto de Química, Universidade de São Paulo, Av. Prof. Lineu Prestes, 748, São Paulo 05508-900, Brazil
Telma T. Schwindt, Departamento de Bioquímica, Instituto de Química, Universidade de São Paulo, Av. Prof. Lineu Prestes, 748, São Paulo 05508-900, Brazil
Cleber A. Trujillo, Departamento de Bioquímica, Instituto de Química, Universidade de São Paulo, Av. Prof. Lineu Prestes, 748, São Paulo 05508-900, Brazil
Sophia L. B. Oliveira, Departamento de Bioquímica, Instituto de Química, Universidade de São Paulo, Av. Prof. Lineu Prestes, 748, São Paulo 05508-900, Brazil
Luis A. Cubano, Department of Biochemistry, Universidad Central del Caribe, Ave. Laurel #100, Santa Juanita, P.O. Box 60327, Bayamón, PR 00960-6032, USA
P. A. Ferchmin, Department of Biochemistry, Universidad Central del Caribe, Ave. Laurel #100, Santa Juanita, P.O. Box 60327, Bayamón, PR 00960-6032, USA
Vesna A. Eterovic, Department of Biochemistry, Universidad Central del Caribe, Ave. Laurel #100, Santa Juanita, P.O. Box 60327, Bayamón, PR 00960-6032, USA
Henning Ulrich, Departamento de Bioquímica, Instituto de Química, Universidade de São Paulo, Av. Prof. Lineu Prestes, 748, São Paulo 05508-900, Brazil.
Antonio H. Martins, Email: baccin31@gmail.com, Department of Biochemistry, Universidad Central del Caribe, Ave. Laurel #100, Santa Juanita, P.O. Box 60327, Bayamón, PR 00960-6032, USA
References
- 1.Casida JE, Quistad GB. Organophosphate toxicology: safety aspects of nonacetylcholinesterase secondary targets. Chem Res Toxicol. 2004;17(8):983–998. doi: 10.1021/tx0499259. [DOI] [PubMed] [Google Scholar]
- 2.Main AR. Kinetics of cholinesterase inhibition by organophosphate and carbamate insecticides. Can Med Assoc J. 1969;100(4):161–167. [PMC free article] [PubMed] [Google Scholar]
- 3.Andersen JB, et al. Total drug treatment and comorbidity in myasthenia gravis: a population-based cohort study. Eur J Neurol. 2014;21(7):948–955. doi: 10.1111/ene.12439. [DOI] [PMC free article] [PubMed] [Google Scholar]
- 4.Hail SL, Obafemi A, Kleinschmidt KC. Successful management of olanzapine-induced anticholinergic agitation and delirium with a continuous intravenous infusion of physostigmine in a pediatric patient. Clin Toxicol (Phila) 2013;51(3):162–166. doi: 10.3109/15563650.2013.773006. [DOI] [PubMed] [Google Scholar]
- 5.Butler AM, Murray M. Biotransformation of parathion in human liver: participation of CYP3A4 and its inactivation during mi-crosomal parathion oxidation. J Pharmacol Exp Ther. 1997;280(2):966–973. [PubMed] [Google Scholar]
- 6.Li H, et al. Aging pathways for organophosphate-inhibited human butyrylcholinesterase, including novel pathways for isomalathion, resolved by mass spectrometry. Toxicol Sci. 2007;100(1):136–145. doi: 10.1093/toxsci/kfm215. [DOI] [PubMed] [Google Scholar]
- 7.Bahrami F, et al. Type of cell death and the role of acetylcholinesterase activity in neurotoxicity induced by paraoxon in cultured rat hippocampal neurons. Acta Biol Hung. 2009;60(1):1–13. doi: 10.1556/ABiol.60.2009.1.1. [DOI] [PubMed] [Google Scholar]
- 8.Massicotte C, et al. Effects of organophosphorus compounds on ATP production and mitochondrial integrity in cultured cells. Neurotox Res. 2005;7(3):203–217. doi: 10.1007/BF03036450. [DOI] [PubMed] [Google Scholar]
- 9.Abou-Donia MB, et al. Locomotor and sensorimotor performance deficit in rats following exposure to pyridostigmine bromide, DEET, and permethrin, alone and in combination. Toxicol Sci. 2001;60(2):305–314. doi: 10.1093/toxsci/60.2.305. [DOI] [PubMed] [Google Scholar]
- 10.Martins AH, et al. Kinin-B2 receptor expression and activity during differentiation of embryonic rat neurospheres. Cy-tometry A. 2008;73(4):361–368. doi: 10.1002/cyto.a.20519. [DOI] [PubMed] [Google Scholar]
- 11.Luo MH, Schwartz PH, Fortunato EA. Neonatal neural progenitor cells and their neuronal and glial cell derivatives are fully permissive for human cytomegalovirus infection. J Virol. 2008;82(20):9994–10007. doi: 10.1128/JVI.00943-08. [DOI] [PMC free article] [PubMed] [Google Scholar]
- 12.Toma JG, et al. Isolation of multipotent adult stem cells from the dermis of mammalian skin. Nat Cell Biol. 2001;3(9):778–784. doi: 10.1038/ncb0901-778. [DOI] [PubMed] [Google Scholar]
- 13.Reynolds BA, Tetzlaff W, Weiss S. A multipotent EGF-responsive striatal embryonic progenitor cell produces neurons and astrocytes. J Neurosci. 1992;12(11):4565–4574. doi: 10.1523/JNEUROSCI.12-11-04565.1992. [DOI] [PMC free article] [PubMed] [Google Scholar]
- 14.Negraes PD, et al. Neural differentiation of P19 carcinoma cells and primary neurospheres: cell morphology, proliferation, viability, and functionality. Curr Protoc Stem Cell Biol. 2012;2:2D–9D. doi: 10.1002/9780470151808.sc02d09s20. [DOI] [PubMed] [Google Scholar]
- 15.Pohanka M. Acetylcholinesterase inhibitors: a patent review. Expert Opin Ther Pat. 2008;22(8):871–886. doi: 10.1517/13543776.2012.701620. [DOI] [PubMed] [Google Scholar]
- 16.Ellman GL, et al. A new and rapid colorimetric determination of acetylcholinesterase activity. Biochem Pharmacol. 1961;7:88–95. doi: 10.1016/0006-2952(61)90145-9. [DOI] [PubMed] [Google Scholar]
- 17.Sholl DA. Dendritic organization in the neurons of the visual and motor cortices of the cat. J Anat. 1953;87(4):387–406. [PMC free article] [PubMed] [Google Scholar]
- 18.Zhao S, et al. Constraint-induced movement therapy overcomes the intrinsic axonal growth-inhibitory signals in stroke rats. Stroke. 2013;44(6):1698–1705. doi: 10.1161/STROKEAHA.111.000361. [DOI] [PubMed] [Google Scholar]
- 19.Jung JE, et al. 2,3,7,8-Tetrachlorodibenzo-p-dioxin (TCDD) inhibits neurite outgrowth in differentiating human SH-SY5Y neuroblastoma cells. Toxicol Lett. 2009;188(2):153–156. doi: 10.1016/j.toxlet.2009.04.004. [DOI] [PubMed] [Google Scholar]
- 20.Frimat JP, et al. The network formation assay: a spatially standardized neurite outgrowth analytical display for neuro-toxicity screening. Lab Chip. 2010;10(6):701–709. doi: 10.1039/b922193j. [DOI] [PubMed] [Google Scholar]
- 21.Buzanska L, et al. A human stem cell-based model for identifying adverse effects of organic and inorganic chemicals on the developing nervous system. Stem Cells. 2009;27(10):2591–2601. doi: 10.1002/stem.179. [DOI] [PubMed] [Google Scholar]
- 22.Visan A, et al. Neural differentiation of mouse embryonic stem cells as a tool to assess developmental neurotoxicity in vitro. Neurotoxicology. 2012;33(5):1135–1146. doi: 10.1016/j.neuro.2012.06.006. [DOI] [PubMed] [Google Scholar]
- 23.Kousba AA, et al. Comparison of chlorpyrifos-oxon and paraoxon acetylcholinesterase inhibition dynamics: potential role of a peripheral binding site. Toxicol Sci. 2004;80(2):239–248. doi: 10.1093/toxsci/kfh163. [DOI] [PubMed] [Google Scholar]
- 24.Yang D, et al. Chlorpyrifos and chlorpyrifos-oxon inhibit axonal growth by interfering with the morphogenic activity of acetylcholinesterase. Toxicol Appl Pharmacol. 2008;228(1):32–41. doi: 10.1016/j.taap.2007.11.005. [DOI] [PMC free article] [PubMed] [Google Scholar]
- 25.Dori A, et al. Functional manipulations of acetyl-cholinesterase splice variants highlight alternative splicing contributions to murine neocortical development. Cereb Cortex. 2005;15(4):419–430. doi: 10.1093/cercor/bhh145. [DOI] [PubMed] [Google Scholar]
- 26.Trujillo CA, et al. Kinin-B2 receptor activity determines the differentiation fate of neural stem cells. J Biol Chem. 2012;287(53):44046–44061. doi: 10.1074/jbc.M112.407197. [DOI] [PMC free article] [PubMed] [Google Scholar]