

Abstract
Purpose
The purpose of this study was to determine the reproducibility and reliability of glutamine, measured with a very short echo time phase rotation stimulated echo acquisition mode (VTE-PR STEAM) sequence at 3 Tesla, in subjects with schizophrenia.
Methods
Seven subjects with schizophrenia were scanned twice with VTE-PR STEAM in a Siemens 3T TIM Trio with a 32 channel head coil. Spectroscopic data was collected from two voxels in grey matter, one in the dorsal anterior cingulate and the other in the medial occipital cortex. Reproducibility was assessed using the coefficients of variation (CV) and reliability with standard error of measurement (SEM) and intra-class correlations (ICC). Phantoms containing increasing concentrations of glutamine in a physiologic solution of other neuro-metabolites with overlapping resonances, were scanned to assess the validity of spectral glutamine measurement.
Results
Very good reliability and reproducibility for glutamine in both regions of interest were supported by CVs ≤ 10.0% and ICCs of ≥0.6, respectively. Phantom studies documented a robust correspondence between known glutamine concentrations and VTE-PR STEAM measurements of this metabolite (R2= 0.988).
Conclusion
The VTE-PR STEAM approach at 3 Tesla permits the longitudinal assessment of glutamine and other 1H-MRS neuro-metabolites in a clinically plausible setting.
Keywords: Glutamine, glutamate, spectroscopy, STEAM, schizophrenia
Introduction
The N-Methyl-D-aspartic acid receptor (NMDAR) model of schizophrenia postulates that hypo function of these receptors in gamma-amino-butyric acid (GABA) interneurons leads to dis-inhibition of pyramidal neurons and a paradoxical increase in presynaptic glutamate release across multiple cortical fields (1). Glutamine (Gln), is the principal metabolite from the uptake of extracellular glutamate (Glu). Indeed, about 90% (2-4) of brain glutamine is derived from synaptic glutamate (GABA accounts for a much smaller proportion (5)). In the largest study to date (6) (schizophrenia N=72, healthy controls N=76), we found increased levels of Gln, but not Glu, in the anterior dorsal cingulate cortex (dAC) consistent with a model of NMDAR hypo function. However, the effect size was small and variability was large.
The reproducibility of measurement of various neuro-metabolites was recently examined with a very short echo time phase rotation stimulated echo acquisition mode (VTE-PR STEAM) sequence at 3 Tesla in healthy volunteers (7, 8). Excellent reproducibility was shown for commonly reported metabolites as well as other metabolites such as GABA, Gln, and GSH in both the dAC and the posterior cingulate(8). In the present study, we tested the reproducibility of VTE-PR STEAM measurements, in a group of patients with schizophrenia. Due to the growing interest in Gln, phantoms containing increasing concentrations of glutamine in a physiologic solution of other neuro-metabolites with overlapping resonances, were scanned to assess the validity of spectral Gln measurement.
Methods
Subjects
Seven subjects with a diagnosis of schizophrenia (age= 31.6±10.6 yrs, length of illness= 9.4 ±6.8 yrs), were recruited from the clinics of the University of New Mexico Hospitals. Inclusion criteria were: 1) DSM-IV-TR diagnosis of schizophrenia determined by a Structured Clinical Interview for DSM-IV-P Disorders interview; 2) outpatient status, and 3) clinically stable determined by no changes in psychotropic medications within a month of scan. Subjects with an active diagnosis of substance abuse or dependence, except for nicotine, were excluded. Subjects provided informed consent and were paid for participation. The study was approved by the local institutional review board.
MR acquisition
MRI and 1H-MRS were performed on a Siemens 3T Tim Trio (Siemens Medical Solutions, Inc., Erlangen, Germany) using a 32 channel head coil at the MIND Research Network Albuquerque, NM. Three-dimensional MP-RAGE images were prescribed with slices parallel to the AC-PC line. Two 2.0×1.0×3.0cm3 voxels were selected using sagittal and reformatted coronal MP-RAGE in mostly grey matter: one in the dorsal anterior cingulate (dAC) positioned parallel to and above the corpus callosum, starting from the genu of the corpus callosum and extending 3cm posteriorly; and a second in the medial occipital cortex (mOC) positioned parallel and above the cerebellar tentorium immediately posterior to the parieto-occipital sulcus (see Figure 1).
Figure 1.
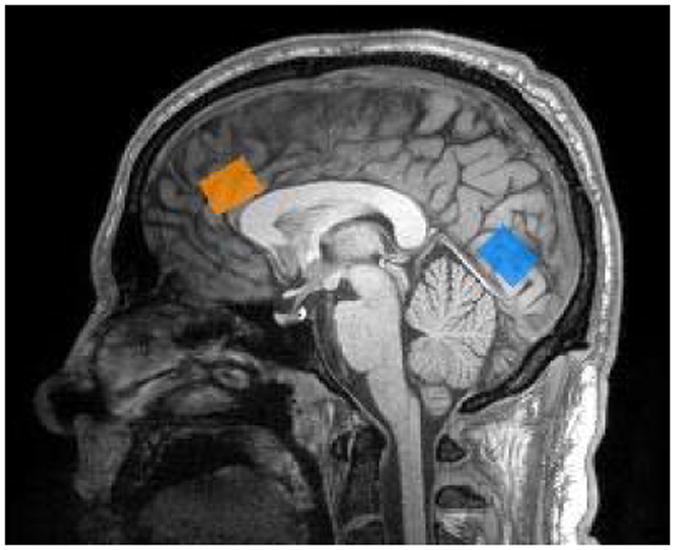
Voxel placements for dorsal anterior cingulate (orange) and medial occipital cortex (blue).
Data was acquired using VTE-PR STEAM with: repetition time (TR)=2000 ms; mixing time (TM)=10 ms; echo time (TE)=6.5 ms; number of excitations (NEX)=256; spectral width=2.5 kHz; complex points=2048; and the following RF phases: φ1=135°, φ2==22.5°, φ3=112.5°, φADC=0°. A non-water suppressed data set (NEX=16) was acquired for eddy current and phase corrections as well as for referencing the metabolite values. After the first scan, patients were removed from the scanner and repositioned within 5 minutes for a second scan with the same parameters.
MRS analyses
Spectroscopic data was fitted with LCModel (version 6.1) using a simulated basis set generated using GAVA (9) that contained 19 metabolites: alanine, aspartate (Asp), creatine (Cr), gamma-amino-butyric acid (GABA), glucose (Glc), glutamate (Glu), glutamine (Gln), glutathione (GSH), glycine (Gly), glycerophosphocholine (GPC), lactate (Lac), myo-Inositol (mIns), N-acetyl aspartate (NAA), N-acetylaspartylglutamate (NAAG), phosphocholine (PCh), phosphocreatine (PCr), phosphoroylethanolamine (PE), scyllo-Inositol (sIns), and taurine (Tau). The following sums are also reported by the fitting program: Cr+PCr (tCr), Gln+Glu (Glx), GPC+PCh (tCho) and NAA+NAAG (NAAc, NAA compounds). Macromolecules were simulated using default settings of LCModel 6.1 (10), which include soft constraints for peak position and line width and prior probabilities of the ratios of macromolecule and lipid peaks. Metabolite levels are reported in institutional units.
Although the voxels were prescribed using the same guidelines during the second scan, perfect re-positioning is unlikely. Hence, partial volume and relaxation correction was applied using gray matter (GM), white matter (WM) and cerebrospinal fluid (CSF) maps generated by segmenting the T1-weighted images with SPM-5 and taking into account the variable water densities and relaxation time in each tissue or CSF compartment (11). We used a CSF T1 value of 4 s and a CSF T2 estimate of 2.47 s based on previous measurements at our site. Otherwise, the previously reported T1, T2, and water density (WD) values were as follows: GM: T1=1.304 s, T2=0.093 s, WD=0.78; WM: T1=0.660 s, T2=0.073 s; WD=0.65; CSF: WD=0.97 (11). Estimates of metabolite T1 and T2 values at 3T are drawn from (12).
Reproducibility and reliability were estimated for metabolites with Cramer-Rao Lower Bounds (CRLB)s ≤ 20% for all subjects including Gln, Glu, Glx, GSH, GABA, NAAc, NAA, tCr, tCho and mIns.
Statistics
Reproducibility was measured using the coefficients of variations (CV) calculated for each subject with the following formula (and then averaged across all subjects):
Intra-class correlations (ICC) were calculated using the three variance (Var) components from an ANOVA table (SAS 9.0, PROC VARCOMP):
We also calculated standard error of measurement (SEM) a reliability measure less vulnerable to between subject variance (13). It uses the SD (from all subject measurements) and the ICC:
We expressed SEM as a percentage of the mean metabolite concentration across both scanning sessions as in (8).
Phantom measurements
Validity was assessed by creating five phantoms with increasing concentrations of glutamine (0mM, 2.25mM, 4.5mM, 6.75mM and 9.0mM) in a standard solution as recommended by Provencher (10). In addition to Gln, the solutions contained the following neuro-metabolites at physiological concentrations(14): Asp, Cr, GABA, Glu, GSH, Glc, mIns and NAA. Phantoms were scanned using VTE-PR STEAM with: TR/TM/TE=10000/10/6.5, VOI=6cm3, NEX=64, 2048 complex points and a non-water suppressed scan (NEX=16). Spectral data was fitted using LCModel (without partial volume correction) and a linear regression was used to calculate the correspondence of measured glutamine values to the known glutamine concentrations.
Results
Spectral quality was excellent for both voxels at the two scanning sessions as shown in Figure 2. The full-width-half-max (FWHM) and signal-to-noise-ratio (SNR), from LCModel in the dAC were 0.03±0.01 ppm and 40±5.6 for the first scan and 0.03±0.01 ppm and 38±7.9 for the second scan, respectively. In the MOC, they were 0.04±0.01 ppm and 42±5.3 for the first scan and 0.04±0.01 ppm and 42±6.8 for the second scan, respectively. CRLBs for all metabolites were all below 20% except for one instance where the GABA CRLB was 54% in the dAC. The table shows measurements of reproducibility, reliability and CRLBs for Gln and the other metabolites of interest in the two regions studied. Quantified Gln levels are within the expected range of 25-33% of Glu levels. Gln CV, SEM and ICC were 9.1%, 9,8% and 0.60 in the dAC compared to 10.0%, 10.6% and 0.62 in the MOC, respectively. Validity results is shown in Figure 3. A linear regression showed that 0.988 (R2) of the variance in measured concentration of Gln is accounted by the estimated spectral measurement of the metabolite. The differences between the phantom concentrations (0. 2.25, 4.5, 6.75 and 9 mM) and the VTE-PR STEAM measurements (0, 1.59, 3.25,5.52 and 7.37 mM) in absolute numbers and percentages (%) were: 0 (0%), 0.66 (29%), 1.25 (27%), 1.23 (17%) and 1.63 (18%), respectively.
Figure 2.
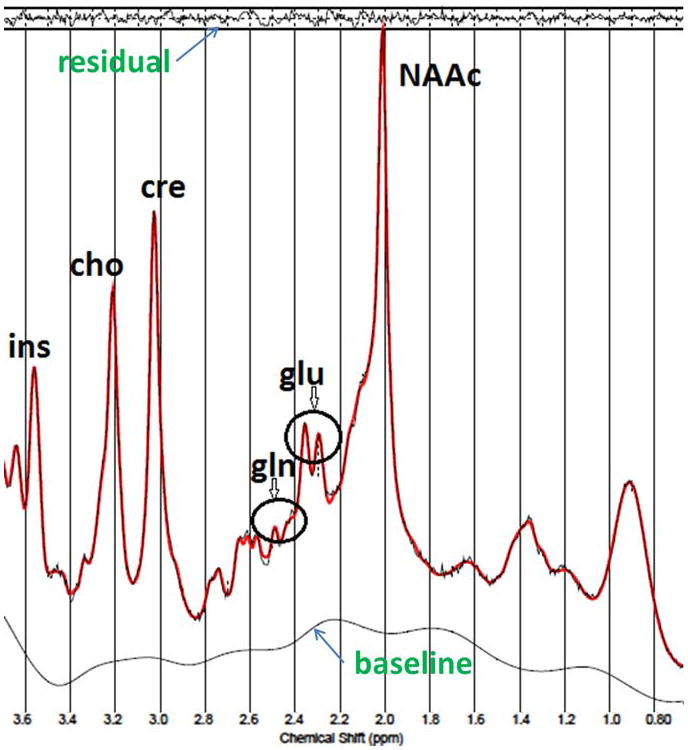
Example of a VTE PR-STEAM spectra from the dorsal anterior cingulate with corresponding fit spectra and residual from LCModel. The flat residual show excellent fits to the data. Gln (glutamine), glu (glutamate), NAAc (N-acetylaspartate + N-acetylaspartate-glutamate), cho (glycerophosphocholine + phosphocholine), cre (creatine + phosphocreatine) and ins (myo-inositol).
Table 1. Reproducibility and reliability of neurometabolites with VTE PR-STEAM in the dorsal anterior cingulate (dAC) and medial occipital cortex (mOC) in schizophrenia (N=7).
| Voxel | Mean 1st | CRLB 1st | Mean 2nd | CRLB 2nd | SEM% | CV (%) | ICC | |
|---|---|---|---|---|---|---|---|---|
| Glutamine | dAC | 3.64±0.57 | 13±3 | 3.69±0.60 | 14±3 | 9.8 | 9.1 | 0.60 |
| mOC | 2.85±0.45 | 15±3 | 3.28±0.53 | 14±3 | 10.6 | 10.0 | 0.62 | |
| Glutamate | dAC | 13.8±1.13 | 4±1 | 13.4±1.33 | 4±1 | 8.4 | 6.74 | 0.10 |
| mOC | 10.9±0.51 | 4±0.4 | 11.2±0.90 | 4±0.4 | 4.5 | 3.61 | 0.51 | |
| Glx | dAC | 17.4±1.41 | 2±0.7 | 17.1±1.45 | 4±1 | 5.9 | 4.58 | 0.46 |
| mOC | 13.8±0.73 | 4±0.8 | 14.4±1.26 | 5±0.5 | 4.6 | 4.07 | 0.61 | |
| GSH | dAC | 2.66±0.33 | 7±3 | 2.88±0.27 | 7±1 | 11.3 | 8.92 | 0.00 |
| mOC | 2.16±0.25 | 8±1 | 2.13±0.43 | 9±2 | 13.0 | 11.4 | 0.32 | |
| mIns | dAC | 8.73±0.67 | 5±1 | 8.99±0.69 | 5±2 | 5.4 | 5.00 | 0.49 |
| mOC | 6.52±0.50 | 6±1 | 6.91±0.65 | 6±0.7 | 8.1 | 7.48 | 0.16 | |
| NAA+NAAG | dAC | 14.8±0.69 | 2±0.4 | 14.7±0.81 | 2±0.4 | 3.5 | 2.83 | 0.48 |
| mOC | 15.3±0.56 | 2±0.4 | 15.6±0.88 | 2±0.0 | 1.9 | 1.52 | 0.83 | |
| NAA | dAC | 14.1±0.69 | 3±0.5 | 13.8±0.55 | 3±0.5 | 3.5 | 3.20 | 0.37 |
| mOC | 14.6±0.52 | 2±0.5 | 14.8±1.16 | 3±0.5 | 4.5 | 4.23 | 0.42 | |
| GPC+PCh | dAC | 2.90±0.29 | 3±0.5 | 2.81±0.39 | 4±1 | 4.0 | 3.84 | 0.88 |
| mOC | 1.16±0.09 | 6±1 | 1.15±0.12 | 6±1 | 4.4 | 4.00 | 0.77 | |
| Cr+PCr | dAC | 12.4±0.37 | 2±0.4 | 12.4±0.57 | 2±0.4 | 2.0 | 1.76 | 0.72 |
| mOC | 10.4±0.43 | 2±0.4 | 10.5±0.72 | 2±0.0 | 3.1 | 2.43 | 0.68 | |
| GABA | dAC | 3.51±0.66 | 13±3 | 2.89±0.81 | 20±16 | 24.4 | 21.7 | 0.00 |
| mOC | 3.54±0.56 | 12±3 | 3.78±0.64 | 11±2 | 16.2 | 12.0 | 0.00 |
Figure 3.
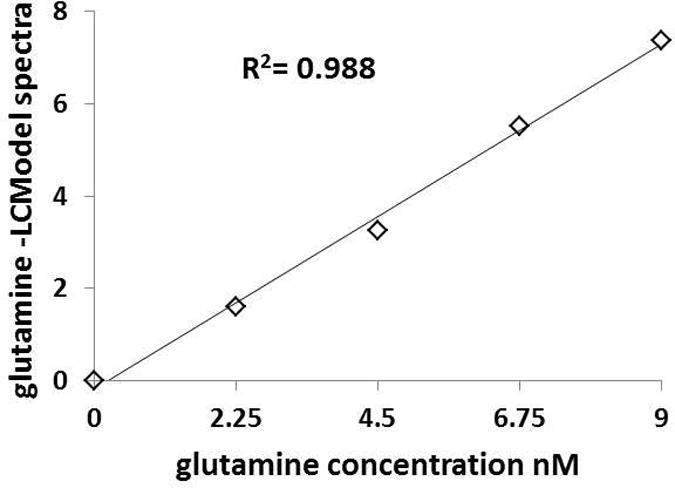
Correspondence of known phantom glutamine concentrations (mM) with values from VTE PR-STEAM acquisitions quantified using LCModel (in institutional units –IU).
Discussion
In patients with schizophrenia, using VTE-PR STEAM, we documented CV's under 10% and ICC's of about 0.6 for Gln in two regions of interest: dorsal anterior cingulate and medial occipital cortex. Gln phantom studies demonstrated excellent validity (R2=0.988) of this approach for glutamine quantification in the presence of metabolites with overlapping resonances. Furthermore, the CV's and ICC's for the traditional 1H-MRS neuro-metabolites (NAAc, NAA, tCho and tCr) were excellent but somewhat more variable for other j-coupled overlapping compounds (i.e.: Glu, Glx, GSH, mIns and GABA).
The two other studies with the same VTE-PR STEAM sequence at 3T, both in healthy volunteers, are generally consistent with the current one. One studied the dAC (7.2 cc) with an 8 channel coil and reported CV's of 24% for Gln, 7% for Glu, 13% for GSH and 27% for GABA (as ratios to Cre)(7). The second study in dAC and posterior cingulate (PC; both 6 cc), used a 32 channel coil and reported neuro-metabolites referenced to water (8). In the dAC, CV's were 9.4%, 1.9%, 5.7% and 6.4% for Gln, Glu, GSH and GABA, respectively. In the PC, CVs were 8.9%, 7.2%, 8.6% and 10.5% for Gln, Glu, GSH and GABA, respectively. The ICCs were not as consistently good, perhaps because in this sample of healthy volunteers, between subjects variability was lower than in a more heterogeneous population like schizophrenia. Though the age variability was similar in both groups (SD=9 and 10.6 years), length of illness varied significantly amongst our sample (SD=6.8 years). In the present study, the basis-set for fitting was the same as in (8), however we used partial volume correction, which can improve reproducibility (15). Hence, despite some differences in acquisition and analyses, the Gln reproducibility (CVs) for our study is very comparable to the two studies in healthy subjects with the same sequence. However for dAC, our CV's in schizophrenia subjects were larger than in healthy controls, especially for GABA (threefold; about 30% larger for GSH). In addition, our results also compare favorably with another study that used PRESS at 3T in healthy volunteers from dAC (12 cc) with different TE's (16). TE of 40 ms produced the lowest CV's of 37 and 5% for Gln and Glu, respectively.
Some limitations should be acknowledged. First, only two relatively large voxels were examined. Reproducibility in other smaller brain regions may be different. Second, Gln measurement in phantoms is not the same as in-vivo. The absence of macromolecules and tissue artifacts produce much narrower peak line shapes, allowing a better separation of glutamine. Third, although highly correlated (R2 = 0.988), the discrepancy between known phantom and LCModel fitted concentrations ranged between 17 to 29%, underscoring the limitation with accuracy of measurement. Finally, the broad (0 to 9 mM) Gln phantom concentrations may unrealistically increase the correlation between phantom and 1H-MRS measurements.
In summary, the VTE-PR STEAM approach at 3 Tesla permits the longitudinal assessment of Gln separate from Glu, as well as several other standard neuro-metabolites of interest, in a clinically plausible setting. Hence, this approach permits the examination of the impact of treatment and course of illness on glutamate-related measures in neuro-psychiatric disease.
Acknowledgments
Supported by NIMH R01MH084898 to J. R. Bustillo and 1 P20 RR021938-01A1 and DHHS/NIH/NCRR 3 UL1 RR031977-02S2 as well as T32MH067533 to S. A. Wijtenburg.
The authors are grateful to Dr Fernando Valenzuela, PhD, from the Department of Neurosciences of the University of New Mexico, for his supervision of the preparation of the phantom solutions. Also to Nicholas Lemke, Patrick Gallegos and Ashley Jaramillo, employees of the UNM Department of Psychiatry and to Diana South and Cathy Smith, MRN employees, for their contributions with data collection.
References
- 1.Olney JW, Farber NB. Glutamate receptor dysfunction and schizophrenia. Archives of general psychiatry. 1995 Dec;52(12):998–1007. doi: 10.1001/archpsyc.1995.03950240016004. [DOI] [PubMed] [Google Scholar]
- 2.Magistretti PJ, Pellerin L. Cellular mechanisms of brain energy metabolism and their relevance to functional brain imaging. Philos Trans R Soc Lond B Biol Sci. 1999 Jul 29;354(1387):1155–63. doi: 10.1098/rstb.1999.0471. [DOI] [PMC free article] [PubMed] [Google Scholar]
- 3.Rothman DL, Sibson NR, Hyder F, Shen J, Behar KL, Shulman RG. In vivo nuclear magnetic resonance spectroscopy studies of the relationship between the glutamate-glutamine neurotransmitter cycle and functional neuroenergetics. Philos Trans R Soc Lond B Biol Sci. 1999 Jul 29;354(1387):1165–77. doi: 10.1098/rstb.1999.0472. [DOI] [PMC free article] [PubMed] [Google Scholar]
- 4.Shulman RG. Functional imaging studies: linking mind and basic neuroscience. Am J Psychiatry. 2001 Jan;158(1):11–20. doi: 10.1176/appi.ajp.158.1.11. [DOI] [PubMed] [Google Scholar]
- 5.van Eijsden P, Behar KL, Mason GF, Braun KP, de Graaf RA. In vivo neurochemical profiling of rat brain by 1H-[13C] NMR spectroscopy: cerebral energetics and glutamatergic/GABAergic neurotransmission. Journal of neurochemistry. 2010 Jan;112(1):24–33. doi: 10.1111/j.1471-4159.2009.06428.x. [DOI] [PMC free article] [PubMed] [Google Scholar]
- 6.Bustillo JR, Chen H, Jones T, Lemke N, Abbott C, Qualls C, et al. Increased Glutamine in Patients Undergoing Long-term Treatment for Schizophrenia : A Proton Magnetic Resonance Spectroscopy Study at 3 T. JAMA psychiatry. 2014 Jan 8; doi: 10.1001/jamapsychiatry.2013.3939. [DOI] [PMC free article] [PubMed] [Google Scholar]
- 7.Wijtenburg SA, Knight-Scott J. Very short echo time improves the precision of glutamate detection at 3T in 1H magnetic resonance spectroscopy. Journal of magnetic resonance imaging : JMRI. 2011 Sep;34(3):645–52. doi: 10.1002/jmri.22638. [DOI] [PubMed] [Google Scholar]
- 8.Wijtenburg SA, Gaston FE, Spieker EA, Korenic SA, Kochunov P, Hong LE, et al. Reproducibility of phase rotation STEAM at 3T: Focus on glutathione. Magn Reson Med. 2013 Oct 22; doi: 10.1002/mrm.24959. [DOI] [PMC free article] [PubMed] [Google Scholar]
- 9.Soher BJ, Young K, Bernstein A, Aygula Z, Maudsley AA. GAVA: spectral simulation for in vivo MRS applications. Journal of magnetic resonance. 2007 Apr;185(2):291–9. doi: 10.1016/j.jmr.2007.01.005. [DOI] [PMC free article] [PubMed] [Google Scholar]
- 10.Provencher SW. Automatic quantitation of localized in vivo 1H spectra with LCModel. NMR Biomed. 2001 Jun;14(4):260–4. doi: 10.1002/nbm.698. Epub 2001/06/19. eng. [DOI] [PubMed] [Google Scholar]
- 11.Gasparovic C, Neeb H, Feis DL, Damaraju E, Chen H, Doty MJ, et al. Quantitative spectroscopic imaging with in situ measurements of tissue water T1, T2, and density. Magn Reson Med. 2009 Sep;62(3):583–90. doi: 10.1002/mrm.22060. [DOI] [PubMed] [Google Scholar]
- 12.Mlynarik V, Gruber S, Moser E. Proton T (1) and T (2) relaxation times of human brain metabolites at 3 Tesla. NMR Biomed. 2001 Aug;14(5):325–31. doi: 10.1002/nbm.713. [DOI] [PubMed] [Google Scholar]
- 13.Weir JP. Quantifying test-retest reliability using the intraclass correlation coefficient and the SEM. Journal of strength and conditioning research / National Strength & Conditioning Association. 2005 Feb;19(1):231–40. doi: 10.1519/15184.1. [DOI] [PubMed] [Google Scholar]
- 14.Govindaraju V, Young K, Maudsley AA. Proton NMR chemical shifts and coupling constants for brain metabolites. NMR Biomed. 2000 May;13(3):129–53. doi: 10.1002/1099-1492(200005)13:3<129::aid-nbm619>3.0.co;2-v. [DOI] [PubMed] [Google Scholar]
- 15.Gasparovic C, Bedrick EJ, Mayer AR, Yeo RA, Chen H, Damaraju E, et al. Test-retest reliability and reproducibility of short-echo-time spectroscopic imaging of human brain at 3T. Magn Reson Med. 2011 Aug;66(2):324–32. doi: 10.1002/mrm.22858. [DOI] [PMC free article] [PubMed] [Google Scholar]
- 16.Mullins PG, Chen H, Xu J, Caprihan A, Gasparovic C. Comparative reliability of proton spectroscopy techniques designed to improve detection of J-coupled metabolites. Magn Reson Med. 2008 Oct;60(4):964–9. doi: 10.1002/mrm.21696. [DOI] [PubMed] [Google Scholar]