Abstract
A wide range of diseases and conditions are monitored or diagnosed from blood plasma, but the ability to analyze a whole blood sample with the requirements for a point-of-care device, such as robustness, user-friendliness, and simple handling, remains unmet. Microfluidics technology offers the possibility not only to work fresh thumb-pricked whole blood but also to maximize the amount of the obtained plasma from the initial sample and therefore the possibility to implement multiple tests in a single cartridge. The microfluidic design presented in this paper is a combination of cross-flow filtration with a reversible electroosmotic flow that prevents clogging at the filter entrance and maximizes the amount of separated plasma. The main advantage of this design is its efficiency, since from a small amount of sample (a single droplet 10 μl) almost 10% of this (approx 1 μl) is extracted and collected with high purity (more than 99%) in a reasonable time (5–8 min). To validate the quality and quantity of the separated plasma and to show its potential as a clinical tool, the microfluidic chip has been combined with lateral flow immunochromatography technology to perform a qualitative detection of the thyroid-stimulating hormone and a blood panel for measuring cardiac Troponin and Creatine Kinase MB. The results from the microfluidic system are comparable to previous commercial lateral flow assays that required more sample for implementing fewer tests.
I. INTRODUCTION
Clinical blood tests are often used to determine or monitor diseases, mineral content, pharmaceutical drug effectiveness, and organ function. Multiple tests for specific blood components (such as a glucose test or a cholesterol test) are often grouped together into a blood panel. Although many researchers have developed plasma separation from whole blood utilizing different techniques in microtechnologies, the volume of extracted plasma to implement the test is still one barrier to achieve a reliable miniaturized blood panel. Based on the recent microfluidic studies, particle separation methods and blood plasma extraction techniques could categorize in three main groups: centrifugal microfluidics (Lab-on-Compact-Disk (CD)), paper-based microfluidics, and microfluidic chip.1 A centrifugal microfluidic system presents many advantages, but it needs to utilize intricate interconnects, specific equipment, and various valving systems (passive and active valves). The success of the blood plasma separation on the CD platform relies on these valving, additionally simple control of spinning speed of the motor for fluid handling on a CD platform has its own inherit limitations.2–4 Paper-based microfluidics or lab on a paper is an attractive microfluidic platform due to its low cost, ubiquitous, and compatibility with many medical and biochemical applications; however, it has some limitations such as sample retention, need to control the fluid flow, rapidly clogging, and unable to analyze low concentrated analytes.5–8 Different approaches have been taken in the microfluidics chip format to achieve separation of plasma from whole blood, see the reviews.9–11
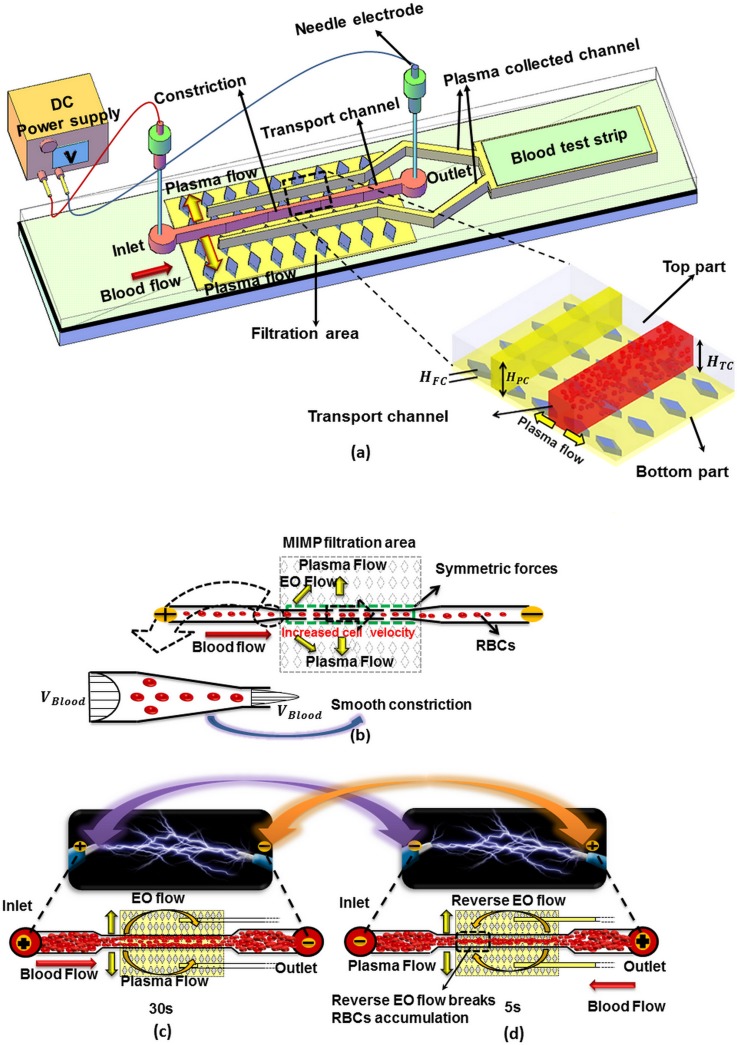
The cross flow filtration method has demonstrated its outstanding properties to separate particles from a suspension,12–15 but its major drawback is the clogging of the filtration area, which was solved either increasing the sample dilution12,13 or pumping at low flow rates.15 In our previous work, Madadi et al.16 the blood plasma separation used cross-flow filtration and capillarity. But after a while, the blood flow velocity in the transport channel was slowed down, which leads to an accumulation of cells in the entrance of the separation area (red blood cells (RBCs) clogging), see Fig. 1(b) phenomena that limited the plasma extracted from a 5 μl undiluted blood droplet (0.1 μl). In this paper, to address this issue, an electric field is applied but during a limited time, which enables the extraction of up to 1 μl from a 10 μl droplet without RBCs lysis.
FIG. 1.
(a) Schematic diagram of the blood plasma separation microdevice. (b) Detail of the transport channel constriction. (c) and (d) Electroosmotic flow and RBCs flow directions depending on the electrode polarization.
Initially, most of the microfluidics chips and aforementioned cross flow filtration studies required a syringe pump to control the required flow rate to achieve plasma separation, which is not always available when thinking in a point-of-care (POC) device for blood testing near the patient and in general only few nanoliters of plasma could be separated. In most diagnostic procedures, plasma or serum (plasma deprived of clotting agents) must be extracted from full blood prior to analysis. Thus, the best opportunities for microfluidic point of care tests (POCT) systems reside on those that provide separation of plasma from the components of blood and fulfill POC conditions such as short time to result, portability, flexibility, and low cost per test.17
Electrokinetic (EK) technique has the potential to address these issues and create flow by utilizing a voltage difference that can be provided by a single on-board battery18 which eliminates the need of an external driving force. The use of electric fields for particle trapping and separation had been previously reported by researchers. For instance, Johann and Renaud combined electroosmotic and pressure-driven flow for particle sorting in multiple branched channels.19 Kawamata et al. also used electroosmotic flow (EOF) for continuous particle separation in a design with multiple channels (two inlets and five outlets) and five electrodes to separate approximately 300 polystyrene particles.20 Wu et al. used hydrodynamic spreading, tuned by an electroosmotic flow in order to separate large E. coli cells, yeast cells, and fluorescent polystyrene particles.21 In all these cases, the control of the applied voltage had to be very precise,20 and most of them were not limited by the lysis of the cells. Nakashima et al. applied dielectrophoresis to separate plasma from blood, but they limited the applied voltage to 10 AC Volts at 1 MHz. Using this configuration, they could separate 300 nl of plasma from a 5 μl droplet.22 Later, they increased the blood separation efficiency by increasing the applied voltage in expense of plasma contamination with lysed RBCs due to the generated high electric field.23
The previous studies that employed EK techniques to separate cells or particles used either complex electrode geometries, more than two electrodes or a set of different voltages, which make it more complicated for the integration of such designs in micro-total analysis system. Furthermore, to achieve effective particle separation, the channels were initially filled to generate an electroosmotic flow before introducing the particle to the channel, which is not possible when the design should be used for a POC device.
From the broad range of different techniques for blood plasma separation, this work focuses on the enhancement of cross flow filtration technique due to its adaptability for POC use, a summary of achievements in this field is presented in Table I.
TABLE I.
Cross flow filtration studies for blood plasma separation.
| Author | Technique | Dilution | Extracted plasma (%) | Purity (%) | Voltage |
|---|---|---|---|---|---|
| Crowley and Pizziconi12 | Cross flow filtration | No | 0.3–0.9 | N/A | … |
| Chen et al.13 | Cross flow filtration | 1:1–1:100 | N/A | 20–95 | … |
| Kang et al.14 | Cross flow filtration | N/A | 5.36 | 99.9 | … |
| Madadi et al.16 | Cross flow filtration-capillarity | No | 5 | 99 | … |
| Nakashima et al.22 | Cross flow filtration-dielectrophoresis | 1:9 | 6 | 97 | 10 V-AC |
| Mohammadi et al. (current) | Cross flow filtration-electroosmosis | 1:1 | 10 | 99 | 50 V-DC |
This paper presents a novel, highly efficient blood plasma separator microfluidic chip by taking advantage of a cross-flow filtration method combined with a reversible electroosmotic flow to prevent RBC accumulation in the entrance of the filtration area. The use of just two simple electrodes placed in the inlet and the outlet of the microchannel offers advantages such as a straightforward fabrication process and allows the regulation of the flow rate through the voltage. This strategy allows the collection of 1 μl of blood plasma from a 10-μl fresh human blood sample. In the proposed design, two different 50-μm-deep channels are placed in the top part of the microfluidic design to facilitate the detection and readout of multiple blood parameters.
To validate the quality and quantity of the separated plasma and to show its potential as clinical tool, the microfluidic chip is combined with lateral flow immunochromatography technology to perform two different types of analysis: first, a single test for the qualitative detection of the TSH (thyroid-stimulating hormone), and second a blood panel for measuring two indicators in the diagnosis of myocardial infarction (MI): Cardiac Troponin (cTnI) and Creatine Kinase MB (CK-MB). Clearly, a combination of both measurements in the same test device increases the efficiency of the diagnosis. The microfluidic chip results are comparable to previous commercial lateral flow assays that require (50–100 blood and 100–150 Buffer solution) 10 times more sample and a large ratio of blood dilution, which in some applications may limit the detection of some substances that are present in very low concentrations.
According to the results, the combination of the new microfluidic chip with lateral flow analysis (LFA) technology fulfills the requirements for a POC device such as short time to result, robustness, user-friendly manipulation, portability, flexibility, and low cost per test. Qualitative results can be read directly, but for quantification of the analyte, this microfluidics-based lateral flow cartridge could be integrated with a direct readout using a smart phone.24
This paper is organized as follows: the Introduction in Section I. The design principles, microfluidic chip fabrication, and experimental setup are explained in the Materials and methods in Section II. Experimental results and integration of the plasma separator with analyte detection and plasma validation are demonstrated in Results and discussion in Section III, and Concluding remarks are presented in Section IV.
II. MATERIAL AND METHODS
A. Design principle
The proposed microfluidic device is based on a microfluidic blood plasma filter developed in our group,16,25 see Fig. 1(a).
In our previous work, Madadi et al.16 the cross-flow filtration and capillarity were used for blood plasma separation but the clogging phenomena limited the plasma extracted (0.1 μl), see Fig. 1(b). In this paper, to address this issue and break the RBCs accumulation and maximize collected plasma to generate an efficient point of care blood panel device, an electroosmotic flow is generated connecting two electrodes placed in the inlet and the outlet, respectively, see Fig. 1(c).
When a DC electric field is applied between the channel inlet and the channel outlet, the ions from the electrolyte form an electric double layer (EDL) over the wall surface. The ions from the double layer are attracted to the negative electrode producing an electroosmotic liquid flow. The electroosmotic velocity is (EOF)26,27
| (1) |
where E is the magnitude of the electric field, is the electroosmotic mobility of the ionic fluid, is the zeta potential of the wall of microchannel, is the viscosity, and is the permittivity of the fluid. The total electrokinetic velocity (EK) of the suspended RBCs in the fluid due to the combined effects of electroosmosis (EO) and electrophoresis (EP) can be expressed as
| (2) |
where is the total electrokinetic velocity, is electric field strength, is the electroosmotic mobility, and is the electrophoretic mobility.
The electrophoretic direction of negatively charged particles such as RBCs is from the ground to the positive electrode. According to Srivastava et al.,27 RBCs are large with a minor net negative charge, therefore EP mobility is insignificant compared with EO mobility thus can be neglected. The applied DC electric field creates a net force on the RBCs mainly dominated by EO flow and particles move from positive to negative electrodes.26,28
Fig. 1(c) shows how the EOF generates a higher shear rate on the clogged RBCs in the entrance area of the separation zone and consequently controls the RBCs movements.
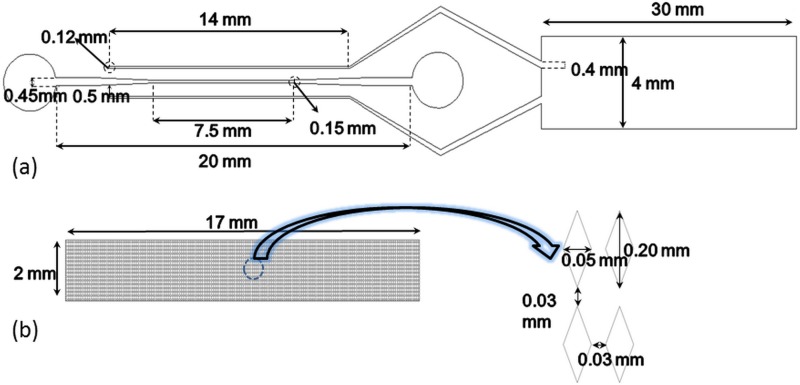
In this technique, the direction of this net force is modified by changing the polarity of electrodes (reverse EOF), see Figs. 1(c) and 1(d). This reverse DC electric field prevents the RBC accumulation at the entrance of the separation area and allows the filtration process to proceed till the plasma has reached the test zone of the lateral flow assay test strip. Figs. 2(a) and 2(b) show the main dimensions of the proposed design. This extracted blood plasma is collected in two channels (height, = 50-μm) which are placed 500 μm apart from the transport channel in the top part, called plasma collected channels. The width of these plasma collected channels increases smoothly from 100-μm (in the filtration area) up to 400-μm at the end where the blood plasma is gathered to interface with the lateral flow assay test strips.
FIG. 2.
Design dimensions. (a) Top part. (b) Down part diamond shaped post-array.
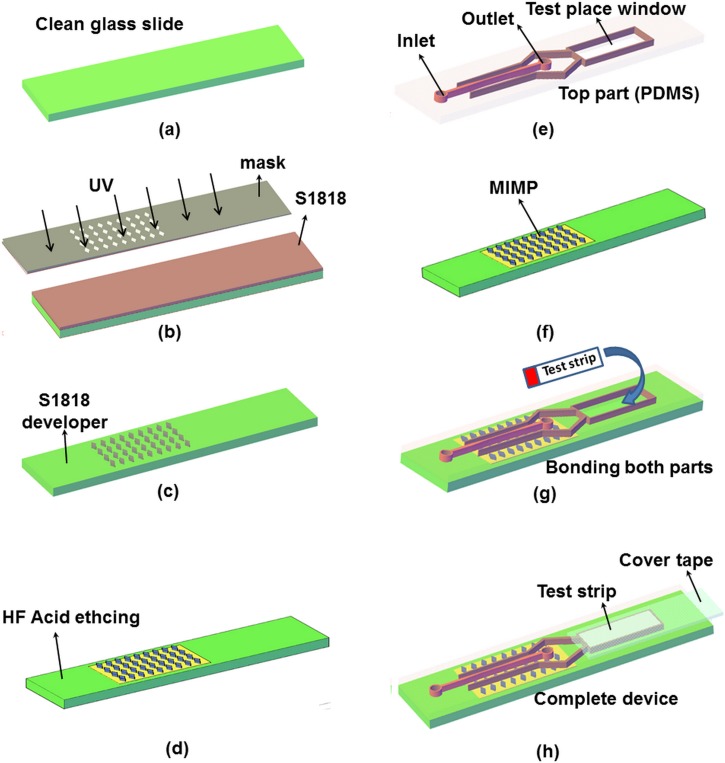
The manufacturing process used in Ref. 16 has been modified to allocate precisely the test strip, see Fig. 3 where steps (a) till (d), for Microchannel Integrated Micro-Pillars (MIMP) fabrication are used in Ref. 16 and steps (e) to (h) has been added. Conventional photolithography and soft lithography procedures have been utilized to generate top part (Polydimethylsiloxane (PDMS) microchannel) (Fig. 3(e)) also photolithography and wet chemical method have been used to fabricate the down part (glass substrate) (Fig. 3(f)).16 In the test strips, the filtration pad (fiberglass) and the absorption pad from the end are removed. After, the test strips are allocated in place (Fig. 3(g)) and sealed with tape (Fig. 3(h)).
FIG. 3.
Schematic view of the microdevice fabrication. (a)–(d) MIMP filtration channel manufacturing steps, (e) the microdevice top part with the test window, the channel inlet, and the channel outlet (PDMS), (f) the microdevice down part (glass), (g) bonding of both parts, and (h) the complete microdevice with the test strip covered with tape.
Fresh blood samples from healthy adults are collected using a lancet from market POCT. A 5-μl drop of fresh human whole blood is mixed with 0.5-μl heparin (purchased from Pfizer Co., Madrid, Spain) as a standard anticoagulant and 5-μl of phosphate-buffered saline (PBS, purchased from Life Technologies S.A., Madrid, Spain). Based on the test strip manufacturer (Nal Von Minden) to completely wet the conjugate pad, 5-μl of phosphate-buffered saline is added to the LFA strips after the plasma has reached the conjugate pad.
Two different types of tests are implemented; one measures TSH level (as in Ref. 16) and the other is a blood panel for measuring two indicators in the diagnosis of MI, cTnI, and CK-MB in the same cartridge.
The cTnI is a protein found in the cardiac muscle that is released into the blood 4 to 6 h after the onset of pain. CK-MB is an enzyme found in the cardiac muscle too, but this is released, 3 to 8 h after the onset of symptoms, but it lasts up to 72 h while cTnI can be elevated up to 10 days. This is a clear example where the use of a microfluidic cartridge that maximizes the amount of extracted plasma allows a combination of both measurements and therefore increases the efficiency of the diagnosis.
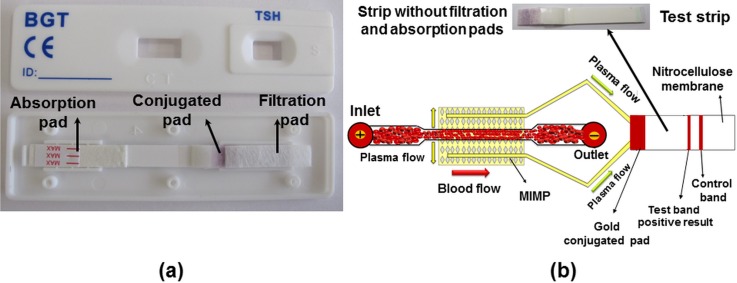
The separated plasma in both plasma-collected channels is driven to the entrance of the test strip. The test strip gold conjugate pad is overlapped with the blood plasma reservoir and is sealed with tape, see Figs. 3(g) and 3(h). In the gold conjugate pad, the plasma antigens are recognized and bound to the gold-conjugated antibodies and coloring the control line if the test works properly and the test band if the test is positive, see Fig. 6(b).
FIG. 6.
(a) All components of TSH test strip and (b) the test strip without filtration pad and the schematic view of microdevice with the test strip.
The appearance of a coloured band at the control region serves as a procedural control, indicating that the proper volume of specimen has been added. ImageJ software was employed to measure color intensity of both commercial LFA strip and microfluidic device coloured band. Two dimensional profile of color intensity along considered rectangular was created in Analyze /plot profile module. (The Y-axis the vertically averaged pixel intensity and X-axis present the horizontal distance through the selection.)
III. RESULTS AND DISCUSSION
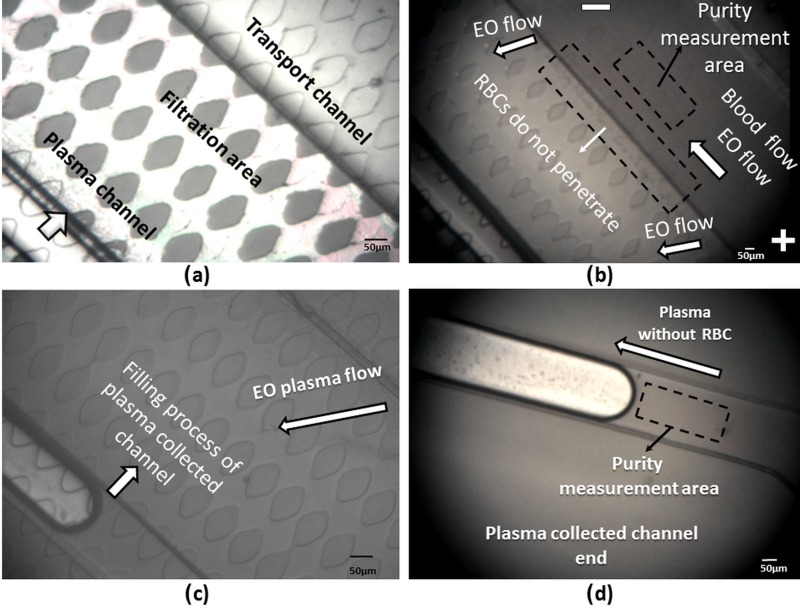
Fig. 4(a) (Multimedia view) shows the device before introducing the 5-μl droplet of human blood sample into the inlet port of the transport channel, and a 5-μl droplet of blood sample is dropped into the outlet to avoid a hydrostatic pressure difference in the main channel. The blood sample is first drawn into the microdevice, due to the capillary forces.
FIG. 4.
The separation process starts as soon as the blood flows in the transport channel and arrives in the MIMP filtration channel in the down part. The capillary forces are not enough to fill the 50-μm-deep plasma-collected channels. Therefore, to increase the volume of extracted plasma after 2 min, 50 V are applied between the channel inlet and the channel outlet in a 22-mm long microchannel, see Fig. 4(b) (Multimedia view).
The applied electric field creates an EO flow from the inlet to the outlet (positives to negative electrode) that speeds up the filling process of the plasma-collected channels; see Figs. 4(c) and 4(d) (Multimedia view).
The results of the numerical simulation of the flow direction created by the electric field and also a video clip of the performance of the blood plasma separation microdevice are provided in supplementary material Figs. S-1 and S-2 (Ref. 29) and movie S1.29
Normally, RBCs clogging is inevitable in the separation zone of blood microfilter, the velocity of blood is decreased in the transport channel which leads to an accumulation of cells in the entrance of the separation area, see Fig. 4(b).
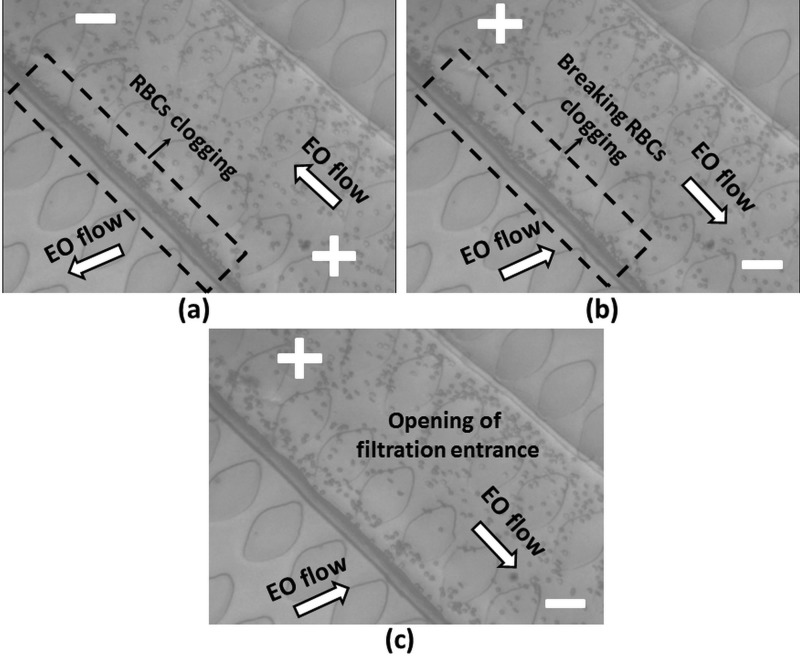
In order to break the accumulation of RBCs and avoid clogging in the entrance of the filtration area, the direction of the electric field is optimally changed every 30 s during 5 s (outlet to the inlet). It should be noted that, based on the experimental result, applying EOF more than 30 s and reverse EOF less than 5 s could permanently clog the MIMP while employing EOF less than 30 s and reverse EOF more than 5 could reduce the amount of separated plasma.
Fig. 5(a) (Multimedia view) shows the direction of EO flow in the transport, MIMP channels, and how the RBCs clog the entrance to the MIMP filtration area (30 s). Fig. 5(b) (Multimedia view) shows the backward generated electroosmotic flow when the polarity is changed. This flow pushes the RBCs away from the entrance of the MIMP and breaks the RBCs clogging. Based on our experimental result, the electroosmotic mobility of PDMS and blood is which generates almost 60–80 μm/s electroosmotic velocity in transport channel. The complete opening of the filtration entrance is shown in Fig. 5(c) (Multimedia view). A video clip of the breaking performance of RBCs clogging is presented in the supplementary material movie S2.29
FIG. 5.
If the plasma purity is defined as
| (3) |
where is the number of RBC in the plasma collected channel, and is the number of RBC in the main channel. ImageJ is used to compare the number of RBCs in the region marked in Figs. 4(b) and 4(d). The purity calculated from Equation (3) of the extracted blood plasma from whole blood in the plasma channel topology is more than 99% (by considering 106 RBCs/μl in whole human blood, less than 5 × 10³ RBCs in whole separated plasma).
Calculating the total area filled with plasma, around 1 μl of blood plasma, is successfully separated from 10 μl of fresh blood sample in all the tests. According to the results, the plasma collected channels are filled in 8–10 min with a purity of more than 99%. The results of five fabricated devices are summarized in Table II, showing the average and standard deviation of the recorded data; see supplementary material Table S-1.29
TABLE II.
Average amount of separated plasma, time, and purity.
| Microchip | Blood sample volume | Volume of the extracted plasma | Time (min) | Purity (%) |
|---|---|---|---|---|
| Reciprocating electroosmotic | 10 μl | 1 ± .01 μl | 8–10 | >99 |
A. TSH test
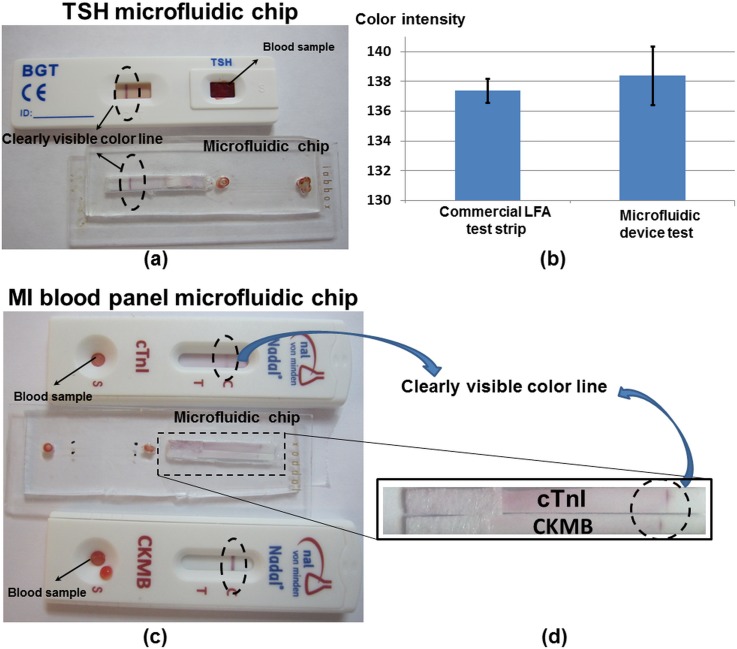
All components of the test strip are shown in Fig. 6(a), notice that the filtration pad and absorption pad have been removed in order integrate the lateral flow assay in the microfluidic chip. The separated plasma reaches to the conjugated pad after 8 min, and the chromatography process is started. Five test devices are tested; a colored line appears in the control section of the test strip in average 18 ± 2 min after dropping the blood droplet. The schematic view of the test strip is shown in Fig. 6(b). Fig. 7(a) shows a picture of the coloured line in the control section from the microfluidic chip compared to the standard NADAL® TSH test. It should be highlighted that the microfluidic chip is shown from the backside view, since the test strip is rotated in the implementation process; see Fig. 3(h).
FIG. 7.
(a) The results of the TSH test using in the microfluidic chip and LFA strip. (b) The color intensity of the results of the TSH test using the microfluidic chip and the LFA strip. (c) and (d) The results of the myocardial infarction tests using the microfluidic chip and cTnI and CKMB LFA strips.
For the evaluation of the quality of the obtained plasma and the repeatability of the results, the color intensity of the results line of the TSH test is measured using ImageJ software. Fig. 7(b) shows that the average color intensity of the commercial LFA test strip, which is equivalent to the results obtained with the microfluidic chip.
B. Myocardial infarction test (MI blood panel)
The capability of the presented microdevice for separating and gathering blood plasma within more than one plasma-collected channel paves the way for multiplex blood analysis simultaneously in the same device. In order to implement myocardial infarction test, half test strip of cTnI and CK-MB has been placed in test location of the microfluidic device.
Five test devices have been tested; the average time for the colored line to appear is 20 ± 2 min after dropping the blood droplet. The hybrid microfluidic device with cTnI and CK, also commercial LFA cTnI and CK-MB tests, are shown in Figs. 7(c) and 7(d).
Table III and Fig. 7 show that the results obtained from the proposed device and commercial LFA test strip are equivalent (Fig. 7(b)) but the required sample is 5 times less.
TABLE III.
Required blood sample volume for LFA test strip and microfluidic device.
| Microchip | Blood sample volume (μl) | Buffer solution (μl) |
|---|---|---|
| Microfluidic chip | 10 | 10 |
| LFA strip | 50–100 | 100–150 |
During all the experimental procedure, the voltage is kept below 50 V between the inlet and the outlet of the 22-mm-long channel, which generates an electric field that cannot lyse the cells,30,31 see supplementary material Fig. S-1.29 But the quality of the obtained plasma was also analyzed using Image J software.
The variation of the color intensity is measured over a 160-μm line region 20 s and 8 min after the beginning of the test in the MIMP filtration area. The same procedure is repeated for the blood sample in the transport channel, see supplementary material Fig. S-3.29
The measurement shows that the variation of plasma color intensity is negligible (less than 1%) during the experiment (8 min), therefore the plasma is separated without haemolysis.
IV. CONCLUSION
A novel microfluidic chip for blood plasma separation, which combines microfluidics with conventional lateral flow immunochromatography to extract enough plasma to perform a blood panel in a simple and portable device, is designed and fabricated in the present study. The microfluidic chip design is a combination of cross-flow filtration with a reversible electroosmotic flow that with only 50 V prevents clogging at the filter entrance and separates more than 1-μl of plasma of high purity (more than 99%) in a reasonable time (5 to 8 min). The main advantage of this design is its portability and the small amount of sample required (a single droplet 10 μl). The potential as clinical tool has been proved combining with lateral flow immunochromatography technology to perform a qualitative detection of the TSH and a blood panel for measuring cardiac Troponin and Creatine Kinase MB. The results obtained from the microfluidic system are comparable to previous commercial lateral flow assays that required more sample for implementing less tests. According to the results, the combination of the new microfluidic chip with LFA technology fulfills the requirements for a POC device such as robustness, user-friendly manipulation, and simple handling, since the blood sample can be analyzed directly. For a quantification of the analyte, this microfluidics-based lateral flow cartridge can be easily integrated to a readout device, for instance a smart phone.
ACKNOWLEDGMENTS
The research for this paper was financially supported by the Spanish Ministry of Economy and competitivity, Grant No. CTQ2013-48995-C2-1-R.
References
- 1. Kersaudy-Kerhoas M. and Sollier E., Lab Chip 13(17), 3323–3346 (2013). 10.1039/c3lc50432h [DOI] [PubMed] [Google Scholar]
- 2. Gorkin R., Park J., Siegrist J., Amasia M., Lee B. S., Park J. M., Kim J., Kim H., Madou M., and Cho Y. K., Lab Chip 10(14), 1758–1773 (2010). 10.1039/b924109d [DOI] [PubMed] [Google Scholar]
- 3. Ducrée J., Haeberle S., Lutz S., Pausch S., Stetten F. V., and Zengerle R., J. Micromech. Microeng. 17, S103–S115 (2007). 10.1088/0960-1317/17/7/S07 [DOI] [Google Scholar]
- 4. Haeberle S., Brenner T., Zengerle R., and Ducrée J., Lab Chip 6, 776–781 (2006). 10.1039/b604145k [DOI] [PubMed] [Google Scholar]
- 5. Vella S. J., Beattie P., Cademartiri R., Laromaine A., Martinez A. W., Phillips S. T., Mirica K., and Whitesides G. M., Anal. Chem. 84(6), 2883–2891 (2012). 10.1021/ac203434x [DOI] [PMC free article] [PubMed] [Google Scholar]
- 6. Li X., Ballerini D. R., and Shen W., Biomicrofluidics 6, 011301 (2012). 10.1063/1.3687398 [DOI] [PMC free article] [PubMed] [Google Scholar]
- 7. Yang X., Forouzan O., Brown T. P., and Shevkoplyas S. S., Lab Chip 12, 274–280 (2012). 10.1039/C1LC20803A [DOI] [PubMed] [Google Scholar]
- 8. Songjaroen T., Dungchai W., Chailapakul O., Henry C. S., and Laiwattanapaisal W., Lab Chip 12, 3392–3398 (2012). 10.1039/c2lc21299d [DOI] [PubMed] [Google Scholar]
- 9. Pamme N., Lab Chip 7, 1644–1659 (2007). 10.1039/b712784g [DOI] [PubMed] [Google Scholar]
- 10. Yu Z. T. F., Yong K. M. A., and Fu J., Small 10(9), 1687–1703 (2014). 10.1002/smll.201302907 [DOI] [PMC free article] [PubMed] [Google Scholar]
- 11. Hou H. W., Bhagat A. A. S., Lee W. C., Huang S., Han J., and Lim C. T., Micromachines 2, 319–343 (2011). 10.3390/mi2030319 [DOI] [Google Scholar]
- 12. Crowley T. A. and Pizziconi V., Lab Chip 5, 922–929 (2005). 10.1039/b502930a [DOI] [PubMed] [Google Scholar]
- 13. Chen X., Cui D. F., Liu C. C., and Li H., Sens. Actuators, B 130, 216–221 (2008). 10.1016/j.snb.2007.07.126 [DOI] [Google Scholar]
- 14. Kang T. G., Yoon Y. J., Ji H., Limand P. Y., and Chen Y., J. Micromech. Microeng. 24, 087001 (2014). 10.1088/0960-1317/24/8/087001 [DOI] [Google Scholar]
- 15. Sollier E., Rostaing H., Pouteau P., Fouillet Y., and Achard J., Sens. Actuators, B: Chem. 141, 617–624 (2009). 10.1016/j.snb.2009.05.023 [DOI] [Google Scholar]
- 16. Madadi H., Casals-Terré J., and Mohammadi M., Biofabrication 7(2), 025007 (2015). 10.1088/1758-5090/7/2/025007 [DOI] [PubMed] [Google Scholar]
- 17. Ng A. H. C., Uddayasankar U., and Wheeler A. R., Anal. Bioanal. Chem. 397, 991–1007 (2010). 10.1007/s00216-010-3678-8 [DOI] [PubMed] [Google Scholar]
- 18. Erickson D., Sintonb D., and Li D., Lab Chip 4, 87–90 (2004). 10.1039/b316916b [DOI] [PubMed] [Google Scholar]
- 19. Johann R. and Renaud P., Electrophoresis 25, 3720–3729 (2004). 10.1002/elps.200406104 [DOI] [PubMed] [Google Scholar]
- 20. Kawamata T., Yamada M., Yasuda M., and Sek M., Electrophoresis 29, 1423–1430 (2008). 10.1002/elps.200700658 [DOI] [PubMed] [Google Scholar]
- 21. Wu Z., Liu A. Q., and Hjort K., J. Micromech. Microeng. 17(10), 1992 (2007). 10.1088/0960-1317/17/10/010 [DOI] [Google Scholar]
- 22. Nakashima Y., Hata S., and Yasuda T., Sens. Actuators, B 145, 561–569 (2010). 10.1016/j.snb.2009.11.070 [DOI] [Google Scholar]
- 23. Liao S. H., Chang C. Y., and Chang H. C., Biomicrofluidics 7, 024110 (2013). 10.1063/1.4802269 [DOI] [PMC free article] [PubMed] [Google Scholar]
- 24. Vashist S. K., Schneider E. M., and Luong J. H. T., Diagnostics 4(3), 104–128 (2014). 10.3390/diagnostics4030104 [DOI] [PMC free article] [PubMed] [Google Scholar]
- 25. Madadi H., Casals-Terré J., Castilla-López R., and Sureda-Anfres M., Microfluid. Nanofluid. 17(1), 115–130 (2014). 10.1007/s10404-013-1295-5 [DOI] [Google Scholar]
- 26. Mohammadi M., Madadi H., and Casals-Terré J., Anal. Bioanal. Chem. 407(16), 4733–4744 (2015). 10.1007/s00216-015-8678-2 [DOI] [PubMed] [Google Scholar]
- 27. Srivastava S. K., Artemiou A., and Minerick A. R., Electrophoresis 32(18), 2530–2540 (2011). 10.1002/elps.201100089 [DOI] [PubMed] [Google Scholar]
- 28. Ozuna-Chacón S., Lapizco-Encians B. H., Rito-Palomares M., Martínez-Chapa S. O., and Reyes-Betanzo C., Electrophoresis 29(15), 3115–3122 (2008). 10.1002/elps.200700865 [DOI] [PubMed] [Google Scholar]
- 29.See supplementary material at http://dx.doi.org/10.1063/1.4930865E-BIOMGB-9-005505 for the numerical simulation of the flow direction created by the electric field, the results of five fabricated devices and variation of the color intensity in after 20 s and 8 min.
- 30. Gao J., Yin X., and Fang Z., Lab Chip 4, 47–52 (2004). 10.1039/b310552k [DOI] [PubMed] [Google Scholar]
- 31. Brown R. B. and Audet J., J. R. Soc., Interface 5, 131–138 (2008). 10.1098/rsif.2008.0009.focus [DOI] [PMC free article] [PubMed] [Google Scholar]
Associated Data
This section collects any data citations, data availability statements, or supplementary materials included in this article.
Data Citations
- See supplementary material at http://dx.doi.org/10.1063/1.4930865E-BIOMGB-9-005505 for the numerical simulation of the flow direction created by the electric field, the results of five fabricated devices and variation of the color intensity in after 20 s and 8 min.


