

Abstract
Background
Asian-Americans outlive whites by an average of nearly 8 years. By determining the sources of the Asian mortality advantage, we can pinpoint where there is the greatest potential for raising the life expectancy of whites and other groups in the United States.
Methods
Our analyses include all Asian and white deaths in the United States between 2006 and 2010, from the Center for Disease Control (CDC). Using the International Classification of Diseases (version 10), we code causes of deaths into 19 categories, based on the most common causes as well as causes particularly relevant to racial differences. We then create life tables and apply a newly-developed demographic method to determine whether Asians have longer life expectancy because they are less likely than whites to die of causes of death that strike at younger ages, or because they tend to outlive whites regardless of cause of death.
Results
Nearly 90% of the Asian-white life expectancy gap is attributable to the fact that Asians tend to outlive whites regardless of the cause of death. The causes that contribute the most to the gap are heart disease (24%) and cancers (18%). Men contribute somewhat more to the gap than women do (55% versus 45%), primarily because Asian-white differences in mortality are greater among men than among women with respect to suicide, traffic accidents, and accidental poisoning.
Conclusions
For almost all causes of death, Asian victims tend to be older than white victims. The greatest potential for raising the life expectancy of whites to that of Asians, then, resides in efforts that effectively increase whites' average age at death for the most common causes of death.
Keywords: Asian, Life Expectancy, Decomposition, Causes of death, Longevity
Introduction
Asians and Pacific Islanders (hereafter Asians) outlive all other racial and ethnic groups in the United States [1-6]. Because their life expectancy at birth is 86.3 years, they outlive non-Hispanic white Americans (hereafter whites) by an average of 7.8 years (authors' calculation from 2006-2010 CDC data).
Moreover, Asians are the fastest-growing racial group in the United States [7], with an increase of 45% from 2000 to 2010 [7, 8]. From approximately 18 million Asians in the United States in 2010, it is projected that there will be more than 40.6 million Asians by the year 2050, comprising 9.2 percent of the total population in the United States [8]. Despite their longevity and rapid population growth, Asians have received relatively little attention in the medical literature. The popular portrayal of Asians as the “model minority” (Asian Americans have higher levels of educational attainment and median family income than whites) has contributed to keeping Asians largely out of the public health policy discourse [9]. While there is a vast literature on health disparities between blacks and whites [10, 11] and between Hispanics and whites [12], few studies have focused on the health and mortality of Asians at the national level [13]. However, due to their rapid rate of growth and distinct sociodemographic profile, we must incorporate Asians to understand the current state and future trajectory of population health in the United States [14]. Focusing on Asians is also strategic because Asians provide a benchmark for other groups. By comparing the mortality patterns of Asians and whites in America, we can better pinpoint the differences that have a significant impact on longevity. Using Asian mortality as a benchmark, this study employs a new decomposition method that allows us to determine more precisely the location of the mechanisms that generate the Asian mortality advantage.
To identify the sources of group differences in life expectancy, researchers traditionally have used partitioning methods developed by demographers [15] to isolate the contribution of various causes to differences in longevity [16, 17]. However, this approach does not tell us how much of the life expectancy gap is due to difference in the average age at death (age component), and how much is due to difference in the probability of dying of disease specific cause (incidence component) for the two populations. In this study, we use the recently developed age-incidence method [18] to separate the age component from the incidence component for each cause of death. This distinction is important because it provides more specific information on where the Asian-white gap in life expectancy is generated; thus it helps to narrow the search for causes of the disparity. Understanding the age versus incidence mechanisms generating the Asian-white life expectancy gap can play a role in designing more effective public policies. For example, if the effect of, say, heart diseases on life expectancy disparities is due to different incidence rates (i.e., whites dying more from heart diseases), that suggests the potential for reducing mortality for the disadvantaged group by focusing on prevention strategies for that specific group. On the other hand, if the effect of heart diseases on life expectancy disparities is due to different ages at death (i.e., white victims of heart disease dying younger), that might suggest renewed effort to provide the same quality of health care across racial groups.
Methods
Our analyses are based on the Detailed Mortality files from the Center for Disease Control [19], a registry of all deaths occurring in the United States. In addition to age, gender, race, and ethnicity, the files include the underlying cause of death, defined as “the disease or injury that initiated the train of morbid events leading directly to death or the circumstances of the accident or violence that produced the injury.” [20] Population denominators are also from the Detailed Mortality files. Using the tenth version of the International Classification of Diseases (ICD-10) [21], we created multidecrement life tables for Asians and whites. Given the relatively small population size of Asians, we use pooled data from 2006-2010 for more robust cause-specific estimates. During this 5 year period, the total number of deaths was 9,779,338 for whites and 223,662 for Asians.
We classified the over 10,000 specific causes of death into 19 categories. We based our classification scheme on prior studies [16, 18, 22], which consider the most common causes of death, as well as those causes that are particularly relevant in terms of racial differences [16]. Our scheme further groups the common causes of death into five broad categories: three leading causes of death (heart disease, cancers, and cerebrovascular diseases), chronic diseases (lower respiratory, Alzheimer's, diabetes, and nephritis), communicable diseases (influenza and pneumonia, septicemia, and HIV/AIDS), external causes (homicide, suicide, traffic accidents, and accidental poisoning), and infant and child conditions (perinatal deaths and congenital anomalies). This classification includes the 10 overall leading causes of death in the United States [16], with “accidental poisoning” and “traffic accidents” separated out of one of those 10 causes (“accidents”) because of their relevance to racial health disparities [18, 22]. To that list we added two child and infant conditions [16]; although infant and child deaths are relatively rare nowadays in the United States, they have a large impact on life expectancy. We also added three causes of death that are products of social and economic environments – homicide, suicide, and HIV/AIDS – because of their relevance to racial health disparities [18]. Finally, to cover all causes of death, we added “other infectious diseases” and “other external causes” as well as residual categories containing causes not elsewhere classified.
Analytic Technique
This study uses the age-incidence method, a new decomposition technique for pinpointing more precisely the sources of group differences in life expectancy [18]. This method enables us to determine how much of the Asian-white life expectancy gap is due to differences in the age at death for Asians and whites who die of the same cause (age component), and how much is due to differences in the causes of death for Asians and whites, that is, how much is due to the fact that whites are more likely to die of causes that strike at younger ages (incidence component). Traditional demographic decomposition methods [15] do quantify the contribution to the gap in life expectancy of a single cause of death, but they are not able to distinguish between these two underlying processes. The age-incidence method, by contrast, more precisely pinpoints the mechanisms that generate the life expectancy gap breaking down the gap simultaneously by cause of death and by age versus incidence.
When we consider multiple causes of death, life expectancy at birth (e0) can be calculated as the sum of the cause-specific mean age at death weighted by the cause-specific probability of death: e0 = Σc pcx̄c, where c indicates the cause of death, x̄c is the mean age at death for cause c, and pc is the proportion of deaths due to cause c, or in other words, the probability of dying of cause c. Therefore, the difference in life expectancy between population A and population B can be written as e0A − e0B = ΣcpcAx̄cA − ΣcpcBx̄cB, and the contribution to the gap of a given cause c equals pcA(x̄cA − ē) − pcB(x̄cB − ē), where ē is the average life expectancy for the two populations. The previous equation shows that the contribution of each cause to the gap in life expectancy depends on both the probability of dying of that cause and on the specific mean age at death. If the probability of dying of cause c were the same for both populations (pcA = pcB), then cause c would contribute to the gap only through differences in mean age at death across populations A and B. If, on the other hand, the mean age at death for cause c were the same for both populations (x̄cA = x̄cB), then cause c would contribute to the gap only through differences in the probability of dying. However, real data do not normally match either of these extreme situations; in fact, each cause usually contributes to the gap through both differences in mean age at death (age component) and differences in proportions (incidence component). The age-incidence method [18] allows us to disentangle these two components: The age component for cause c equals p̄c(x̄cA − x̄cB), where p̄ c is the (simple) average proportion for the two populations, and the incidence component for cause c equals (x̄c − ē)(pcA − pcB). Summing up the two components over all causes of death, we determine what part of the overall gap is generated by differences in cause-specific mean age at death, and what part is generated by differences in the probability of dying of certain causes. In addition, the new method can also determine the contribution of specific subpopulations to the total gap. We use this extension in order to further quantify how much of the total gap is due to differences between Asian women versus white women, and how much is due to differences between Asian men versus white men. More detailed information on these equations is available elsewhere [18].
Results
Over the 2006-2010 period, life expectancy was 78.5 years for whites and 86.3 years for Asians. This difference of 7.8 years is more than twice the 3.8-year difference in life expectancy between blacks and whites in 2010 [23]. As shown by the first bar in Figure 1, the overall age component accounts for 6.9 years of the total gap (89%), while the incidence component accounts for slightly less than one year (11% of the gap). So the mortality advantage of Asians is primarily due to the fact that Asians tend to outlive whites regardless of the cause of death, and not because Asians are more likely to avoid causes that strike at younger ages.
Figure 1.
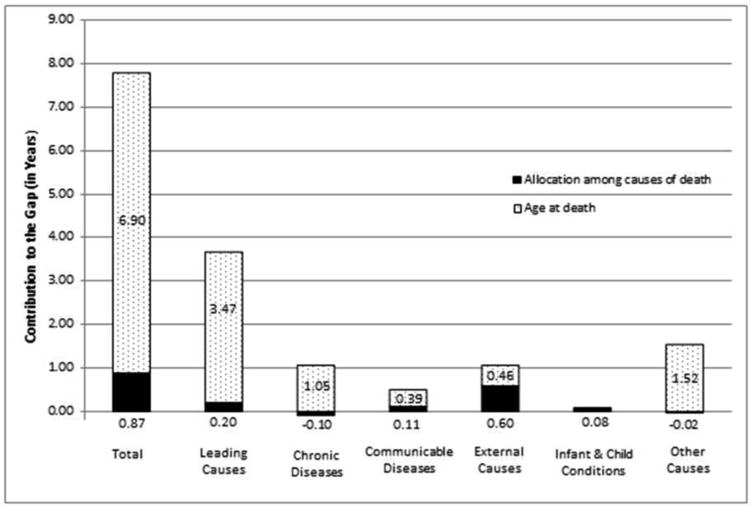
Age versus incidence components of the Asian-white disparity in life expectancy in the US, 2006-2010.
Table 1 unpacks these findings by specific cause of death. Because Asian heart disease victims outlive white heart disease victims by 6.7 years on average, and heart disease is responsible for more than one-fourth of all deaths, the age component of heart disease alone accounts for 1.8 years (24%) of the 7.8-year life expectancy advantage for Asians (Table 1). Cancer is also a large contributor to the age component of the Asian-white gap, accounting for 1.4 years (18%) of the advantage for Asians. Lower respiratory diseases and cerebrovascular diseases also contribute substantially to the age component. Although other causes make smaller contributions to the age component, the contribution is never negative – indicating that the Asian mortality advantage is spread across all causes of death. In fact, for all causes of death, with the one exception of perinatal deaths, Asians outlive whites, usually by at least 4-5 years (see Appendix Table).
Table 1.
Components of the Asian-white racial gap in life expectancy, 2006-2010.
| Cause of Death | Component | Total | Differences due to | Total | |||
|---|---|---|---|---|---|---|---|
|
|
|
||||||
| Incidence | Age | Males | Females | ||||
| Leading causes of death | |||||||
| 1 | Heart diseases | 0.03 (0.4%) | 1.82 (23.4%) | 1.85 (23.8%) | 0.99 (12.8%) | 0.85 (11.0%) | 1.85 (23.8%) |
| 2 | Cancers | 0.07 (0.9%) | 1.33 (17.1%) | 1.40 (18.0%) | 0.77 (9.9%) | 0.62 (8.0%) | 1.40 (18.0%) |
| 3 | Cerebrovascular diseases | 0.10 (1.3%) | 0.33 (4.2%) | 0.43 (5.5%) | 0.17 (2.2%) | 0.25 (3.3%) | 0.43 (5.5%) |
| Totals for leading causes | 0.20 (2.5%) | 3.47 (44.7%) | 3.67 (47.2%) | 1.94 (24.9%) | 1.73 (22.3%) | 3.67 (47.2%) | |
| Chronic diseases | |||||||
| 4 | Chronic lower respiratory diseases | -0.05 (-0.7%) | 0.47 (6.0%) | 0.42 (5.4%) | 0.24 (3.1%) | 0.18 (2.3%) | 0.42 (5.4%) |
| 5 | Alzheimer's | -0.06 (-0.7%) | 0.20 (2.6%) | 0.15 (1.9%) | 0.06 (0.8%) | 0.08 (1.1%) | 0.15 (1.9%) |
| 6 | Diabetes | -0.01 (-0.1%) | 0.27 (3.4%) | 0.26 (3.3%) | 0.12 (1.5%) | 0.14 (1.8%) | 0.26 (3.3%) |
| 7 | Nephritis | 0.01 (0.1%) | 0.12 (1.5%) | 0.13 (1.6%) | 0.06 (0.8%) | 0.07 (0.9%) | 0.13 (1.6%) |
| Totals for chronic diseases | -0.10 (-1.3%) | 1.05 (13.5%) | 0.95 (12.2%) | 0.48 (6.2%) | 0.47 (6.1%) | 0.95 (12.2) | |
| Communicable diseases | |||||||
| 8 | Influenza and pneumonia | 0.10 (1.3%) | 0.24 (3.1%) | 0.34 (4.4%) | 0.18 (2.3%) | 0.17 (2.2%) | 0.34 (4.4%) |
| 9 | Septicemia | 0.00 (0.0%) | 0.09 (1.2%) | 0.09 (1.2%) | 0.05 (0.6%) | 0.04 (0.6%) | 0.09 (1.2%) |
| 10 | HIV/AIDS | 0.02 (0.2%) | 0.00 (0.0%) | 0.02 (0.3%) | 0.02 (0.2%) | 0.00 (0.0%) | 0.02 (0.3%) |
| 11 | Other infectious diseases | -0.01 (-0.1%) | 0.05 (0.7%) | 0.04 (0.6%) | 0.03 (0.3%) | 0.02 (0.3%) | 0.04 (0.6%) |
| Totals for communicable diseases | 0.11 (1.4%) | 0.39 (5.0%) | 0.50 (6.5%) | 0.27 (3.4%) | 0.24 (3.0%) | 0.50 (6.5%) | |
| External causes | |||||||
| 12 | Homicide | 0.01 (0.1%) | 0.01 (0.1%) | 0.02 (0.2%) | 0.01 (0.1%) | 0.01 (0.1%) | 0.02 (0.2%) |
| 13 | Suicide | 0.16 (2.0%) | 0.06 (0.8%) | 0.22 (2.8%) | 0.19 (2.4%) | 0.03 (0.4%) | 0.22 (2.8%) |
| 14 | Traffic accident | 0.13 (1.6%) | 0.14 (1.8%) | 0.26 (3.4%) | 0.19 (2.5%) | 0.07 (0.9%) | 0.26 (3.4%) |
| 15 | Accidental poisoning | 0.30 (3.8%) | 0.05 (0.7%) | 0.35 (4.5%) | 0.23 (3.0%) | 0.12 (1.5%) | 0.35 (4.5%) |
| 16 | Other external causes | 0.01 (0.1%) | 0.20 (2.6%) | 0.21 (2.7%) | 0.14 (1.8%) | 0.07 (0.9%) | 0.21 (2.7%) |
| Totals for external causes | 0.60 (7.7%) | 0.46 (6.0%) | 1.06 (13.7%) | 0.76 (9.8%) | 0.30 (3.8%) | 1.06 (13.7%) | |
| Infant and child conditions | |||||||
| 17 | Perinatal deaths | 0.04 (0.5%) | 0.00 (0.0%) | 0.04 (0.5%) | 0.02 (0.3%) | 0.02 (0.2%) | 0.04 (0.5%) |
| 18 | Congenital anomalies | 0.04 (0.6%) | 0.00 (0.0%) | 0.05 (0.6%) | 0.03 (0.3%) | 0.02 (0.3%) | 0.05 (0.6%) |
| Totals for infant and child conditions | 0.08 (1.1%) | 0.00 (0.0%) | 0.09 (1.1%) | 0.05 (0.6%) | 0.04 (0.5%) | 0.09 (1.1%) | |
| Other causes | |||||||
| 19 | Causes not elsewhere classified | -0.02 (-0.2%) | 1.52 (19.6%) | 1.50 (19.3%) | 0.80 (10.3%) | 0.71 (9.1%) | 1.50 (19.3%) |
|
| |||||||
| Grand Total | 0.9 (11.2%) | 6.9 (88.8%) | 7.8 (100%) | 4.3 (55.2%) | 3.5 (44.8%) | 7.8 (100%) | |
The incidence component is responsible for nearly one year of the total Asian advantage. External causes of death account for most of the incidence component, as whites are more likely than Asians to die of traffic accidents, accidental poisoning, homicide, or suicide - all causes that disproportionately affect the young and middle-aged. The most striking difference is among the victims of accidental poisoning (mostly due to drug overdose [16]) for which whites are over seven times more likely to die (0.97% vs 0.13%) than Asians (Appendix Table).
Table 1 also shows that men account for slightly more of the Asian mortality advantage than women do, with differences in the mortality regime between Asian and white men accounting for 4.3 years (55%) of the 7.8 year racial gap in life expectancy. Looking across the main group categories, we see the sources of the sex difference. For communicable diseases, infant and child conditions, and most chronic diseases, the Asian mortality advantage is about the same for men and women. For heart diseases, cancers, and other causes not elsewhere classified, the Asian mortality advantage is slightly more pronounced for men than for women. The greatest sex difference is for external causes, however, where the advantage of Asian men over white men is more than twice the size of the advantage of Asian women over white women (0.76 versus 0.30 years). This is mostly due to greater Asian-white differences among men with regard to all the major external causes except homicide, for which the (small) Asian advantage is the same for men and women.
Concerns about Data Validity
The exceptional longevity of Asians in the United States has raised concerns about validity of the mortality data for Asians [6]. The misclassification of race, for example, may cause an underestimation of mortality rates for Asians [4, 6]. The problem arises because, though race is self-reported in the Census, funeral directors and medical examiners choose race on the death certificate, either through questioning the victim's relatives or through direct observation [5, 6]. When a misclassification occurs, it is more likely that a member of a minority group is classified as white, rather than vice versa [24, 25]. By counting a number of Asian deaths as white deaths, the mortality rate of the Asian population is downwardly biased [26]. Although quantifying this underestimation is not an easy task [6], a handful of studies have attempted to do so, with estimates of the overall underestimation rate varying from 11% [9] to 12% [27] to 13% [28]. Even after inflating their mortality rates by 13%, the most conservative choice, Asians have a much higher life expectancy than whites, consistent with previous studies [2, 28]. After adjustment, the life expectancy for Asians is 84.7 years, reducing the Asian-white gap in life expectancy from 7.8 years down to 6.2 years.
Table 2 reports results of the decomposition of the Asian-white adjusted gap in life expectancy. By comparing Table 2 to Table 1, we see that correcting for the potential underestimation of mortality rates for Asians reduces the total gap in life expectancy by 20%, but does not affect our conclusions about the sources of the Asian mortality advantage in America. The age component still dominates, accounting for 88% of the overall gap. Men still account for somewhat more of the gap than women do (57% versus 43%). Importantly, the upward adjustment of Asian mortality rates has little effect on the estimated contributions of our 19 causes of death. For example, accidental poisoning – the specific cause of death most affected by the adjustment – changes by less than a single percentage point (from 4.5% of the Asian-white gap in life expectancy without adjustment to 5.4% with adjustment).
Table 2.
Sensitivity analyses for components of the Asian-white racial gap in life expectancy, 2006-2010.
| Cause of Death | Component | Total | Differences due to | Total | |||
|---|---|---|---|---|---|---|---|
| Incidence | Age | Males | Females | ||||
| Leading causes of death | |||||||
| 1 | Heart diseases | 0.02 (0.3%) | 1.42 (22.9%) | 1.44 (23.2%) | 0.80 (12.9%) | 0.64 (10.3%) | 1.44 (23.2%) |
| 2 | Cancers | 0.04 (0.6%) | 1.04 (16.8%) | 1.08 (17.4%) | 0.61 (9.8%) | 0.47 (7.6%) | 1.08 (17.4%) |
| 3 | Cerebrovascular diseases | 0.10 (1.6%) | 0.22 (3.6%) | 0.32 (5.2%) | 0.13 (2.2%) | 0.19 (3.0%) | 0.32 (5.2%) |
| Totals for leading causes | 0.16 (2.6%) | 2.69 (43.2%) | 2.85 (45.8%) | 1.54 (24.9%) | 1.30 (21.0%) | 2.85 (45.8%) | |
| Chronic diseases | |||||||
| 4 | Chronic lower respiratory diseases | -0.05 (-0.9%) | 0.40 (6.5%) | 0.35 (5.6%) | 0.20 (3.3%) | 0.14 (2.3%) | 0.35 (5.6%) |
| 5 | Alzheimer's | -0.07 (-1.1%) | 0.15 (2.5%) | 0.09 (1.4%) | 0.04 (0.7%) | 0.04 (0.7%) | 0.09 (1.4%) |
| 6 | Diabetes | -0.01 (-0.1%) | 0.22 (3.6%) | 0.22 (3.5%) | 0.10 (1.6%) | 0.12 (1.9%) | 0.22 (3.5%) |
| 7 | Nephritis | 0.01 (0.2%) | 0.09 (1.4%) | 0.10 (1.6%) | 0.05 (0.8%) | 0.05 (0.9%) | 0.10 (1.6%) |
| Totals for chronic diseases | -0.12 (-1.9%) | 0.87 (14.0%) | 0.75 (12.1%) | 0.39 (6.3%) | 0.36 (5.8%) | 0.75 (12.1%) | |
| Communicable diseases | |||||||
| 8 | Influenza and pneumonia | 0.10 (1.6%) | 0.19 (3.1%) | 0.29 (4.7%) | 0.15 (2.4%) | 0.14 (2.3%) | 0.29 (4.7%) |
| 9 | Septicemia | 0.00 (0.0%) | 0.07 (1.2%) | 0.07 (1.2%) | 0.04 (0.6%) | 0.03 (0.6%) | 0.07 (1.2%) |
| 10 | HIV/AIDS | 0.02 (0.3%) | 0.00 (0.1%) | 0.02 (0.3%) | 0.02 (0.3%) | 0.00 (0.1%) | 0.02 (0.3%) |
| 11 | Other infectious diseases | -0.01 (-0.2%) | 0.04 (0.6%) | 0.03 (0.5%) | 0.02 (0.3%) | 0.01 (0.2%) | 0.03 (0.5%) |
| Totals for communicable diseases | 0.10 (1.7%) | 0.31 (5.0%) | 0.41 (6.7%) | 0.22 (3.6%) | 0.19 (3.1%) | 0.41 (6/7%) | |
| External causes | |||||||
| 12 | Homicide | 0.00 (0.0%) | 0.01 (0.1%) | 0.01 (0.1%) | 0.00 (0.1%) | 0.01 (0.1%) | 0.01 (0.1%) |
| 13 | Suicide | 0.14 (2.3%) | 0.05 (0.9%) | 0.20 (3.2%) | 0.17 (2.7%) | 0.03 (0.5%) | 0.20 (3.2%) |
| 14 | Traffic accident | 0.11 (1.8%) | 0.13 (2.0%) | 0.24 (3.8%) | 0.18 (2.8%) | 0.06 (1.0%) | 0.24 (3.8%) |
| 15 | Accidental poisoning | 0.29 (4.7%) | 0.05 (0.8%) | 0.34 (5.4%) | 0.22 (3.6%) | 0.11 (1.8%) | 0.34 (5.4%) |
| 16 | Other external causes | 0.01 (0.1%) | 0.16 (2.6%) | 0.17 (2.8%) | 0.12 (1.9%) | 0.05 (0.8%) | 0.17 (2.8%) |
| Totals for external causes | 0.55 (8.9%) | 0.40 (6.4%) | 0.95 (15.3%) | 0.69 (11.1%) | 0.26 (4.2%) | 0.95 (15.3%) | |
| Infant and child conditions | |||||||
| 17 | Perinatal deaths | 0.01 (0.2%) | 0.00 (0.0%) | 0.01 (0.2%) | 0.01 (0.1%) | 0.01 (0.1%) | 0.01 (0.2%) |
| 18 | Congenital anomalies | 0.03 (0.6%) | 0.00 (0.0%) | 0.03 (0.5%) | 0.02 (0.3%) | 0.01 (0.2%) | 0.03 (0.5%) |
| Totals for infant and child conditions | 0.05 (0.8%) | 0.00 (0.0%) | 0.05 (0.8%) | 0.03 (0.4%) | 0.02 (0.3%) | 0.05 (0.8%) | |
| Other causes | |||||||
| 19 | Causes not elsewhere classified | -0.02 (-0.4%) | 1.22 (19.7%) | 1.20 (19.3%) | 0.67 (10.7%) | 0.53 (8.6%) | 1.20 (19.3%) |
|
| |||||||
| Grand Total | 0.7 (11.7%) | 5.5 (88.3%) | 6.2 (100%) | 3.5 (57.1%) | 2.7 (42.9%) | 6.2 (100%) | |
Discussion
Longevity in the United States varies greatly by race and ethnicity. Asians have by far the highest life expectancy, with nearly an 8-year advantage over whites, thus setting the standard for life expectancy in America.
Several explanations have been given for the surprisingly high life expectancy of Asians in the United States. One is the “healthy migrant” hypothesis [2, 4, 5], that Asians constitute a non-randomly selected population of unusually healthy individuals [14] as over two-thirds of Asian-Americans were foreign born, compared to less than 4% of non-Hispanic whites [29]. According to the healthy migrant hypothesis, Asian migrants should be healthier and experience longer longevity than their U.S.-born counterparts. Unfortunately, we are unable to compare the life expectancy of the two groups of Asians because nativity information is not available for our mortality data. Research on the subject has yielded mixed results. One study [13] found a small mortality advantage for foreign-born versus U.S.-born Asians; another study [30] found that U.S.-born Asians have higher life expectancy than their foreign-born counterparts; a third study [4] shows the same finding for women but not for men. Clearly, the debate on the healthy migrant hypothesis for Asians is still open. For instance, for three of the largest Asian groups (i.e., Chinese, Filipinos and Japanese), life expectancy is higher for U.S. born than for foreign born [4], which is contrary to the healthy migrant hypothesis. On the other hand, the life expectancy of Asians in the United States is higher than in any Asian country, which suggests that some health selection is likely at play.
A second possibility is based on the “salmon-bias effect” [5, 30], which occurs when foreign-born individuals go back to their home country when their health deteriorates, to spend the last years of their lives. This process would cause an underestimation of the deaths among the Asians, as deaths occurring abroad would not be accounted for. However, studies find little support for a significant salmon bias effect for Asians [9, 12]. One reason for this might be the distance involved. It is harder for an elderly Korean-American to move back to the homeland than an elderly Mexican-American, for example. An indirect test of the salmon-bias hypothesis can be performed at the state-level. We would expect that the Asian-white gap in life expectancy is larger in the Western states, as traveling back to Asia is easier, in terms of time and money, from those regions. Surprisingly, we observe the opposite. When we compare the two states with the largest Asian population, California and New York, the gap is smaller in California (6.5 years versus 8.1 years). Moreover, in the other Western states (Oregon, Washington, and Arizona) the gap is lower than the national average, while in the other Northeastern states (New Jersey, Maryland, Pennsylvania, Massachusetts) the gap is larger than the national average [31], which provides no support for the salmon-bias hypothesis. In addition, per capita income for Asians in 2006-2010 is higher in California compared to New York ($31,195 versus $28,308) [32] – ruling out the possibility that Asians from Eastern states might be able to better afford the return migration back to their home countries.
Other explanations focus on the health behaviors and environments of Asian Americans. Cultural factors such as healthier traditional cooking may work as protective factors for Asians to buffer some negative health behaviors found in the United States [26]. Asians also have the lowest BMI, fasting plasma glucose, and smoking rate of all major racial or ethnic group in the United States [1]. Furthermore, the relatively high socioeconomic status of Asians may provide greater access to favorable health environments [26]. In addition to a longer life expectancy, Asian Americans also experience more favorable health outcomes, such as lower rates of heart disease, asthma, cancer – especially among the foreign born [33]. On the other hand, self-rated health is on average lower among Asians than for whites after adjusting for a series of control variables, but this might be due to lack of measurement invariance of the self-rated health scale across racial groups [33].
Our contribution in this study is to show that the Asian mortality advantage does not arise because Asian Americans are more likely than whites to avoid specific causes of death that disproportionately affect the young and middle-aged. To be sure, Asians in fact are less likely than whites to die of accidental poisoning, suicide, and traffic accidents, but our decompositions show that this difference accounts for relatively little of the Asian mortality advantage. Rather, Asians die at about the same rate as whites for the major causes of death, but they tend to succumb to those causes later in life, significantly outliving whites for every cause of death except perinatal deaths. This pattern holds for both men and women, and it accounts for nearly 90% of the Asian mortality advantage. These results narrow the research question from “Why do Asians outlive whites?” to the more precise question “For virtually all causes of death, why do Asians tend to outlive whites?”
Conclusion
To increase life expectancy in America, it is helpful to focus on the life expectancy of Asians since they outlive all other racial and ethnic groups. Research on the Asian mortality advantage suggests, one, that the advantage is not an artifact – it is not attributable either to the underreporting of Asian deaths or to the misclassification of race on death certificates – and two, that Asian mortality rates constitute a realistic standard for other Americans to strive to achieve, since U.S.-born Asians enjoy the same longevity as their foreign-born counterparts. By using the new age-incidence method to decompose the difference in life expectancy between Asians and whites, this study identifies the causes of death where disparities are the greatest and through which mechanisms (age versus incidence). For all common causes of death, whites tend to succumb at younger ages than Asians; for instance, roughly the same proportion of Asians and whites die of heart disease, but white victims on average are 6.7 years younger than Asian victims (Appendix Table). This within-cause age difference accounts for most of the Asian mortality advantage.
By demonstrating that the mortality advantage of Asians is due largely to an age effect, this study provides an agenda for subsequent research on the life expectancy gap between Asian Americans and other Americans. Because Asians and whites generally succumb to the same causes of death, researchers can focus on why Asian victims tend to outlive white victims. Is the onset of disease delayed for Asians, or do they live longer while in poor health? Studies of mortality gaps, then, need to be juxtaposed with studies of morbidity gaps. In addition, nativity data should be routinely transferred from death certificates to data archives to permit the comparison of U.S.- and foreign-born Asians. The best studies will compare those data with data from countries of origin to test more directly the salmon bias and healthy migrant hypotheses. In short, future research should make use of the heterogeneity of Asian Americans themselves (their country of origin, generation, length of time in the U.S., and so on) as leverage for understanding the exceptional life expectancy of Asian-Americans.
What is already known on this subject
Asians outlive whites by eight years in the United States. While prior studies pinpoint the causes of death that contribute to the exceptional longevity of Asian Americans, they do not tell us how much of the life expectancy gap is due to difference in the average age at death (age component), and how much is due to difference in the probability of dying of disease specific cause (incidence component).
What this study adds
This study uses a newly developed method to separate the age and incidence components for causes of death. We find that Asian Americans outlive whites because they have a higher average age at death for almost all causes of death.
Acknowledgments
Funding Statement: This work was supported by the Eunice Kennedy Shriver National Institute of Child Health and Human Development (NICHD) (R24 HD041025-11) and the NICHD Predoctoral Training Program (T-32HD007514).
Appendix Table
Distribution of deaths, and average age at death, by cause: Whites versus Asians, total and sex-specific, United States 2006-2010.
| TOTAL | MALE | FEMALE | |||||||||||
|---|---|---|---|---|---|---|---|---|---|---|---|---|---|
|
| |||||||||||||
| Proportion | Mean Age | Proportion | Mean Age | Proportion | Mean Age | ||||||||
|
| |||||||||||||
| White | Asian | White | Asian | White | Asian | White | Asian | White | Asian | White | Asian | ||
| Leading Causes of Death | |||||||||||||
| 1 | Heart diseases | 0.266 | 0.276 | 81.98 | 88.69 | 0.126 | 0.127 | 78.77 | 86.59 | 0.139 | 0.149 | 84.90 | 90.47 |
| 2 | Cancers | 0.225 | 0.208 | 75.42 | 81.55 | 0.116 | 0.107 | 74.82 | 81.35 | 0.109 | 0.101 | 76.06 | 81.76 |
| 3 | Cerebrovascular diseases | 0.058 | 0.088 | 83.51 | 87.99 | 0.021 | 0.035 | 80.86 | 86.43 | 0.036 | 0.053 | 85.07 | 89.03 |
| Total proportion, leading causes | 0.549 | 0.571 | 0.264 | 0.268 | 0.284 | 0.303 | |||||||
| Chronic diseases | |||||||||||||
| 4 | Chronic lower respiratory diseases | 0.062 | 0.039 | 79.88 | 89.20 | 0.029 | 0.023 | 79.07 | 88.74 | 0.033 | 0.016 | 80.58 | 89.83 |
| 5 | Alzheimer's | 0.041 | 0.034 | 87.70 | 93.02 | 0.012 | 0.011 | 86.39 | 92.61 | 0.029 | 0.024 | 88.24 | 93.20 |
| 6 | Diabetes | 0.024 | 0.037 | 77.47 | 86.11 | 0.012 | 0.016 | 75.17 | 84.30 | 0.012 | 0.021 | 79.73 | 87.54 |
| 7 | Nephritis | 0.019 | 0.023 | 82.28 | 87.82 | 0.009 | 0.011 | 81.08 | 86.88 | 0.010 | 0.012 | 83.41 | 88.64 |
| Total proportion, chronic diseases | 0.147 | 0.133 | 0.062 | 0.060 | 0.085 | 0.073 | |||||||
| Communicable diseases | |||||||||||||
| 8 | Influenza and pneumonia | 0.024 | 0.045 | 83.83 | 90.88 | 0.011 | 0.022 | 82.09 | 90.21 | 0.013 | 0.023 | 85.20 | 91.52 |
| 9 | Septicemia | 0.013 | 0.012 | 79.11 | 86.35 | 0.006 | 0.006 | 77.32 | 85.42 | 0.007 | 0.006 | 80.53 | 87.18 |
| 10 | HIV/AIDS | 0.001 | 0.000 | 49.68 | 54.60 | 0.001 | 0.000 | 50.09 | 52.84 | 0.000 | 0.000 | 47.65 | 59.63 |
| 11 | Other infectious diseases | 0.008 | 0.010 | 75.77 | 81.57 | 0.004 | 0.005 | 71.90 | 79.52 | 0.004 | 0.005 | 79.16 | 83.47 |
| Total proportion, communicable diseases | 0.047 | 0.067 | 0.021 | 0.033 | 0.025 | 0.034 | |||||||
| External causes | |||||||||||||
| 12 | Homicide | 0.002 | 0.002 | 40.09 | 44.04 | 0.001 | 0.001 | 38.82 | 40.33 | 0.001 | 0.001 | 42.47 | 51.02 |
| 13 | Suicide | 0.011 | 0.006 | 50.18 | 57.64 | 0.009 | 0.004 | 50.50 | 56.94 | 0.002 | 0.002 | 48.96 | 59.10 |
| 14 | Traffic accident | 0.011 | 0.007 | 46.77 | 61.82 | 0.008 | 0.004 | 45.48 | 58.47 | 0.004 | 0.003 | 49.60 | 66.14 |
| 15 | Accidental poisoning | 0.010 | 0.001 | 42.11 | 51.92 | 0.006 | 0.001 | 40.28 | 48.43 | 0.004 | 0.000 | 45.32 | 57.95 |
| 16 | Other external causes | 0.022 | 0.019 | 74.24 | 84.07 | 0.011 | 0.010 | 68.94 | 81.34 | 0.010 | 0.009 | 80.06 | 86.99 |
| Total proportion, external causes | 0.056 | 0.035 | 0.036 | 0.020 | 0.020 | 0.015 | |||||||
| Infant mortality causes | |||||||||||||
| 17 | Perinatal deaths | 0.003 | 0.002 | 0.28 | 0.23 | 0.001 | 0.001 | 0.32 | 0.28 | 0.001 | 0.001 | 0.24 | 0.17 |
| 18 | Congenital anomalies | 0.003 | 0.002 | 26.66 | 28.07 | 0.001 | 0.001 | 24.89 | 25.57 | 0.001 | 0.001 | 28.57 | 30.52 |
| Total proportion, infant mortality causes | 0.005 | 0.004 | 0.003 | 0.002 | 0.002 | 0.002 | |||||||
| Other causes | |||||||||||||
| 19 | Causes not elsewhere classified | 0.197 | 0.189 | 80.60 | 88.48 | 0.082 | 0.080 | 77.02 | 86.83 | 0.115 | 0.109 | 83.17 | 89.67 |
|
| |||||||||||||
| Grand Totals | 1.000 | 1.000 | 78.49 | 86.26 | 0.468 | 0.463 | 75.34 | 84.52 | 0.532 | 0.537 | 81.26 | 87.76 | |
Footnotes
Licence for Publication: The Corresponding Author (Francesco Acciai) has the right to grant on behalf of all authors and does grant on behalf of all authors, an exclusive licence (or nonexclusive for government employees) on a worldwide basis to the BMJ Publishing Group Ltd to permit this article (if accepted) to be published in JECH and any other BMJPGL products and sublicences such use and exploit all subsidiary rights, as set out in our licence.
Competing Interest: None to declare.
Contributorship Statement: Acciai and Noah had full access to all data in the study and take responsibility for the integrity of the data and the accuracy of the analysis. Acciai and Noah conducted all the analyses. Acciai, Noah and Firebaugh all contributed to the conception, interpretation and writing of the manuscript.
Contributor Information
Aggie J. Noah, Email: ajn164@psu.edu.
Glenn Firebaugh, Email: firebaugh@psu.edu.
References
- 1.Danaei G, Rimm EB, Oza S, et al. The Promise of Prevention: The Effects of Four Preventable Risk Factors on National Life Expectancy and Life Expectancy Disparities by Race and County in the United States. PLoS Medicine. 2010;7:1–13. doi: 10.1371/journal.pmed.1000248. [DOI] [PMC free article] [PubMed] [Google Scholar]
- 2.Hahn RA, Eberhardt S. Life Expectancy in Four U.S. Racial/Ethnic Populations: 1990. Epidemiology. 1995;6:350–5. doi: 10.1097/00001648-199507000-00004. [DOI] [PubMed] [Google Scholar]
- 3.Murray CJL, Kulkarni S, Ezzati M. Eight Americas: New Perspectives on U.S. Health Disparities. American Journal of Preventive Medicine. 2005;29:4–10. doi: 10.1016/j.amepre.2005.07.031. [DOI] [PubMed] [Google Scholar]
- 4.Singh GK, Hiatt RA. Trends and disparities in socioeconomic and behavioural characteristics, life expectancy, and cause-specific mortality of native-born and foreign-born populations in the United States, 1979–2003. International journal of epidemiology. 2006;35:903–19. doi: 10.1093/ije/dyl089. [DOI] [PubMed] [Google Scholar]
- 5.Clarke CA, Miller T, Chang ET, et al. Racial and social class gradients in life expectancy in contemporary California. Social Science & Medicine. 2010;70:1373–80. doi: 10.1016/j.socscimed.2010.01.003. [DOI] [PMC free article] [PubMed] [Google Scholar]
- 6.Elo IT. Adult Mortality Among Asian Americans and Pacific Islanders. Minorities, aging, and health. 1997:41–78. [Google Scholar]
- 7.Humes KR, Jones NA, Ramirez RR. 2010 Census Brief. Washington, DC: 2011. Overview of Race and Hispanic Origin: 2010. [Google Scholar]
- 8.Hoeffel EM, Rastogi S, Kim MO, et al. 2010 Census Briefs. Washington, DC: 2012. The Asian Population: 2010. [Google Scholar]
- 9.Tendulkar S, Hamilton R, Chu C, et al. Investigating the Myth of the “Model Minority”: A Participatory Community Health Assessment of Chinese and Vietnamese Adults. J Immigrant Minority Health. 2012;14:850–7. doi: 10.1007/s10903-011-9517-y. [DOI] [PubMed] [Google Scholar]
- 10.Adler NE, Rehkopf DH. US disparities in health: descriptions, causes, and mechanisms. Annu Rev Public Health. 2008;29:235–52. doi: 10.1146/annurev.publhealth.29.020907.090852. [DOI] [PubMed] [Google Scholar]
- 11.Wong MD, Shapiro MF, Boscardin WJ, et al. Contribution of major diseases to disparities in mortality. New England Journal of Medicine. 2002;347:1585–92. doi: 10.1056/NEJMsa012979. [DOI] [PubMed] [Google Scholar]
- 12.Franzini L, Ribble JC, Keddie AM. Understanding the Hispanic paradox. Ethnicity & disease. 2000;11:496–518. [PubMed] [Google Scholar]
- 13.Hummer RA, Rogers RG, Nam CB, et al. Race/ethnicity, nativity, and US adult mortality. Social Science Quarterly. 1999 [Google Scholar]
- 14.Jasso G, Massey DS, Rosenzweig MR, et al. Immigrant health: selectivity and acculturation. Critical perspectives on racial and ethnic differences in health in late life. 2004:227–66. [Google Scholar]
- 15.Beltran-Sanchez H, Preston SH, Canudas-Romo V. An integrated approach to cause-of-death analysis: cause-deleted life tables and decompositions of life expectancy. Demographic research. 2008;19:1323. doi: 10.4054/DemRes.2008.19.35. [DOI] [PMC free article] [PubMed] [Google Scholar]
- 16.Harper S, Lynch J, Burris S, et al. Trends in the black-white life expectancy gap in the United States, 1983-2003. Jama. 2007;297:1224–32. doi: 10.1001/jama.297.11.1224. [DOI] [PubMed] [Google Scholar]
- 17.Harper S, Rushani D, Kaufman JS. Trends in the black-white life expectancy gap, 2003-2008. Jama. 2012;307:2257–9. doi: 10.1001/jama.2012.5059. [DOI] [PubMed] [Google Scholar]
- 18.Firebaugh G, Acciai F, Noah AJ, et al. Why the racial gap in life expectancy is declining in the United States. Demographic Research. 2014;31:975–1006. doi: 10.4054/DemRes.2014.31.32. [DOI] [PMC free article] [PubMed] [Google Scholar]
- 19.National Center for Health Statistics. Multiple Cause of Death File 2010. Washington, D.C: 2007. [Google Scholar]
- 20.OECD. OECD Glossary of Statistical Terms. 2006 [Google Scholar]
- 21.World Health Organization. ICD-10: International Statistical Classification of Diseases and Related Health Problems. Geneva, Switzerland: 2008. [Google Scholar]
- 22.Nau C, Firebaugh G. A new method for determining why length of life is more unequal in some populations than in others. Demography. 2012;49:1207–30. doi: 10.1007/s13524-012-0133-9. [DOI] [PMC free article] [PubMed] [Google Scholar]
- 23.National Vital Statistics System. Public-use Mortality Files. Hyattsville, MD: 2010. [Google Scholar]
- 24.Hahn RA, Mulinare J, Teutsch SM. Inconsistencies in coding of race and ethnicity between birth and death in US infants: a new look at infant mortality, 1983 through 1985. Jama. 1992;267:259–63. [PubMed] [Google Scholar]
- 25.Poe G, Powell-Griner E, McLaughlin J, et al. Annales De Demographie Historique. Hyattsville Maryland US: National Center for Health Statistics [NCHS]; 1993. Nov, Comparability of the death certificate and the 1986 National Mortality Followback Survey; pp. 61–150. 1992. [PubMed] [Google Scholar]
- 26.Hoyert DL, Kung HC. Asian or Pacific Islander mortality, selected states, 1992. Monthly vital statistics report. 1997;46:1–63. [PubMed] [Google Scholar]
- 27.Sorlie PD, Rogot E, Johnson NJ. Validity of demographic characteristics on the death certificate. Epidemiology. 1992;3:181–4. doi: 10.1097/00001648-199203000-00018. [DOI] [PubMed] [Google Scholar]
- 28.Rosenberg HM, Maurer JD, Sorlie PD, et al. Quality of death rates by race and Hispanic origin: a summary of current research, 1999. Vital and health statistics Series 2, Data evaluation and methods research. 1999:1–13. [PubMed] [Google Scholar]
- 29.Grieco EM. American Community Survey Reports. Washington, DC: 2010. Race and Hispanic Origin of the Foreign-Born Population in the United States: 2007. [Google Scholar]
- 30.Murray CJL, Kulkarni S, Michaud C, et al. Eight Americas: investigating mortality disparities across races, counties, and race-counties in the United States. PLoS Medicine. 2006;3:e260–1524. doi: 10.1371/journal.pmed.0030260. [DOI] [PMC free article] [PubMed] [Google Scholar]
- 31.The Henry J. Kaiser Family Foundation. Life Expectancy at Birth by Race/Ethnicity in 2010. The Henry J. Kaiser Family Foundation; 2015. [Google Scholar]
- 32.American Community Survey. 5-Year Estimates, 2006-2010. Washington, DC: US Census Bureau; 2010. [Google Scholar]
- 33.Huh J, Prause JA, Dooley CD. The impact of nativity on chronic diseases, self-rated health and comorbidity status of Asian and Hispanic immigrants. Journal of Immigrant and Minority Health. 2008;10:103–18. doi: 10.1007/s10903-007-9065-7. [DOI] [PubMed] [Google Scholar]