Abstract
Purpose
To define empirical models and parameters based on theoretical equations to describe drug release profiles from two polycaprolactone thin-film drug delivery systems. Additionally, to develop a predictive model for empirical parameters based on drugs’ physicochemical properties.
Methods
Release profiles from a selection of drugs representing the standard pharmaceutical space in both polycaprolactone matrix and reservoir systems were determined experimentally. The proposed models were used to calculate empirical parameters describing drug diffusion and release. Observed correlations between empirical parameters and drug properties were used to develop equations to predict parameters based on drug properties. Predictive and empirical models were evaluated in the design of three prototype devices: a levonorgestrel matrix system for on-demand locally administered contraception, a timolol-maleate reservoir system for glaucoma treatment, and a primaquine-bisphosphate reservoir system for malaria prophylaxis.
Results
Proposed empirical equations accurately fit experimental data. Experimentally derived empirical parameters show significant correlations with logP, molecular weight, and solubility. Empirical models based on predicted parameters accurately predict experimental release data for three prototype systems, demonstrating the accuracy and utility of these models.
Conclusion
The proposed empirical models can be used to design polycaprolactone thin-film devices for target geometries and release rates. Empirical parameters can be predicted based on drug properties. Together, these models provide tools for preliminary evaluation and design of controlled-release delivery systems.
Keywords: Drug delivery, polycaprolactone, diffusion, empirical
Introduction
Controlled and sustained release drug delivery systems overcome challenges associated with patient compliance and unfavorable pharmacokinetics improving quality of life and therapeutic outcomes.1–5 Taken for example, the advent of long-acting contraceptive injections that have made effective contraception a possibility where patient compliance and a lack of discretion render daily oral regimens ineffective.1 Or the unmet need for long-acting opthalmic delivery systems to treat eye diseases such as glaucoma or age-related macular degeneration. Such ocular diseases often require daily eye-drops or monthly injections into the eye that risk infection and are understandably an unpleasant experience for the patient.2 Such need for controlled release devices spans a variety of therapeutic areas ranging from chemotherapy, psychiatry, and ophthalmology to HIV pre-exposure prophylaxis, contraception, and tissue engineering.1–6 The technological demands for release and methods to achieve control are similar in these applications. However the physicochemical properties of the drugs differ, requiring development of individual design parameters for each indication.
One versatile approach for long-acting controlled release systems is the use of devices comprised of polymeric thin-films. Thin-film devices are flexible and can be made in a range of shapes and sizes as biodegradable or removable devices. Polycaprolactone (PCL) thin-film devices show great promise for controlled-release delivery of both small and large molecule therapeutics.7 The biocompatibility and biodegradation of PCL and the flexibility of the thin-film device design make the technology applicable to ocular injections and subcutaneous insertion for local or systemic delivery.8 While initially in development for ocular diseases, the PCL thin-film device technology platform is currently expanding to other indications such as systemic HIV pre-exposure prophylaxis, contraception, and anti-inflammatory treatments. A better understanding of diffusion in these thin-film systems will allow for more sophisticated and efficient device design.
A primary challenge in developing drug-delivery devices is to control the drug release rate and profile. There are a number of different mechanisms for controlling drug release depending on the delivery system, but these mechanisms depend on both device design and the drug's physical properties.9–11 Understanding how the physical properties of a drug affect its release rate in a given system is crucial for tailoring the device design to achieve a target release profile.9–14 Therefore, we investigated the effect of drug properties (LogP, molecular weight, solubility, and pKa) on diffusion and release in monolithic dispersion matrix as well as membrane-controlled reservoir systems. In addition to developing empirical and predictive models describing drug release profiles, we identified key physicochemical properties of pharmaceuticals affecting partition into and diffusion through PCL membranes. Insight into how different drugs behave in these simple thin-film systems will aid in the design of multi-component drug-delivery systems and the easy translation of the technology for delivering new therapeutics.
Materials & Methods
Materials
70–90 kDa polycaprolactone (PCL), 2,2,2-trifluoroethanol (TFE), and all drugs with the exception of metoprolol tartrate and ranitidine-HCl were purchased from Sigma-Aldrich. Ranitidine-HCl was purchased from Fluka and metoprolol tartrate from VWR. Product numbers and physical properties are detailed in Table I.
Table I.
Physical properties and sources of Pharmaceuticals
| API | Form | Supplier/Catalog# | MW API15 |
MW DP15 |
Cs API (mg/L)15, 21–25 |
Cs DP (mg/L)15,21–25 |
LogP15 | pKa15 |
|---|---|---|---|---|---|---|---|---|
| Caffeine | Caffeine | Sigma/C0705 | 194 | 194 | 16005 | 16005 | −0.07 | 10.4 |
| Diltiazem | Diltiazem HCl | Sigma/D2521 | 415 | 451 | 464 | 50000 | 2.8 | 8.2 |
| Diclofenac | Diclofenac Na | Sigma/D6899 | 296 | 318 | 17.8 | 1771 | 4.51 | 4.15 |
| Famotidine | Famotidine | Sigma/F6889 | 337 | 337 | 999 | 999 | −0.64 | 8.38 |
| Hydrocortisone | Hydrocortisone | Sigma/H0888 | 363 | 363 | 319 | 319 | 1.61 | 12.58 |
| Labetalol | Labetalol HCl | Sigma/L1011 | 328 | 364 | 117 | 10100 | 3.09 | 8.05 |
| Ranitidine | Ranitidine HCl | Fluka/P500026 | 314 | 350 | 24700 | 1800 | 0.27 | 8.08 |
| Verapamil | Verapamil HCl | Sigma/V4629 | 455 | 491 | 4 | 45500 | 3.9 | 8.92 |
| Ibuprofen | Ibuprofen | Sigma/I4883 | 206 | 206 | 470 | 470 | 3.5 | 4.91 |
| Atenolol | Atenolol | Sigma/A7655 | 266 | 266 | 13300 | 13300 | 0.16 | 9.6 |
| Metoprolol | MetoprololTartrate | VWR/AAJ61920-06 | 267 | 685 | 16900 | 1.88 | 9.67 | |
| Aspirin | Aspirin | Sigma/A5376 | 180 | 180 | 4608 | 4608 | 1.19 | 3.49 |
Matrix System Fabrication & Characterization
Drug product was dissolved in TFE and once dissolved, 70–90 kDa PCL was added to solution at 200 mg/ml. PCL was dissolved in drug/TFE solution overnight in either a 60°C water bath or in a 37°C incubator on an orbital shaker. A drug-polymer thin-film matrix was cast onto a 3-inch diameter silicon wafer using a spin-coater (Specialty Coating Systems, Model P6700; 30s at 1500RPM, 30s at 2000RPM) at room temperature. The resulting film was dried under ambient conditions and film thickness was measured using a profilometer. Circular samples (28 mm diameter) were cut from films for in vitro release studies. For each drug and loading concentration, three films were cast and a sample was taken from each. See Table 2 for a summary of analyzed samples.
Table II.
Summary of PCL Matrix Samples Analyzed
| Pharmaceutical | n | % Loading (w/w API/PCL) |
Membrane Thickness (µm) |
D‘ (mm2/hr) | Y' |
|---|---|---|---|---|---|
| Aspirin | 3 | 3 | 15.8 | 1.3E-05 | 1.38E-10 |
| 3 | 4 | 17.3 | 2.4E-05 | 8.44E-11 | |
| 3 | 5 | 19.5 | 1.4E-05 | 6.67E-11 | |
| 3 | 5 | 17.4 | 1.8E-05 | 1.65E-10 | |
| 3 | 6 | 20.2 | 2.2E-05 | 1.96E-10 | |
| Atenolol | 3 | 4 | 12 | 1.5E-05 | 5.93E-11 |
| 3 | 5 | 10.4 | 1.0E-05 | 7.49E-11 | |
| 3 | 7 | 19.5 | 7.8E-06 | 9.88E-11 | |
| 3 | 7 | 7.7 | 1.0E-05 | 6.52E-11 | |
| Caffeine | 3 | 2 | 8.6 | 8.2E-06 | * |
| 3 | 3 | 10.2 | 7.9E-06 | * | |
| 3 | 4 | 10.4 | 1.7E-05 | * | |
| 3 | 5 | 19.5 | 1.3E-05 | 1.84E-11 | |
| 3 | 7 | 13.2 | 2.3E-05 | 1.75E-11 | |
| Diclofenac-Na | 3 | 4 | 19.5 | 5.3E-06 | 1.16E-07 |
| Ibuprofen | 3 | 3 | 16.2 | 1.0E-05 | 1.99E-08 |
| 3 | 4 | 14.7 | 1.4E-05 | 1.82E-08 | |
| 3 | 5 | 19.8 | 1.0E-05 | 2.87E-08 | |
| Labetalol-HCl | 3 | 5 | 19.5 | 3.4E-06 | 3.41E-09 |
| Metoprolol Tartrate | 3 | 16 | 20.3 | 3.0E-06 | 1.82E-10 |
| Ranitidine-HCl | 3 | 9 | 19.5 | 2.6E-06 | 1.54E-10 |
| Verapamil-HCl | 3 | 4 | 13.7 | 1.2E-06 | 6.29E-08 |
| 3 | 6 | 14.5 | 1.1E-06 | 1.01E-07 | |
| 3 | 11 | 13.6 | 1.2E-06 | 5.52E-07 | |
| 3 | 12 | 19.2 | 4.8E-06 | 2.04E-07 |
Y’ not calculated for these samples. Drug loading was below Cs and data is fit with equation 1b only.
Reservoir System Fabrication & Characterization
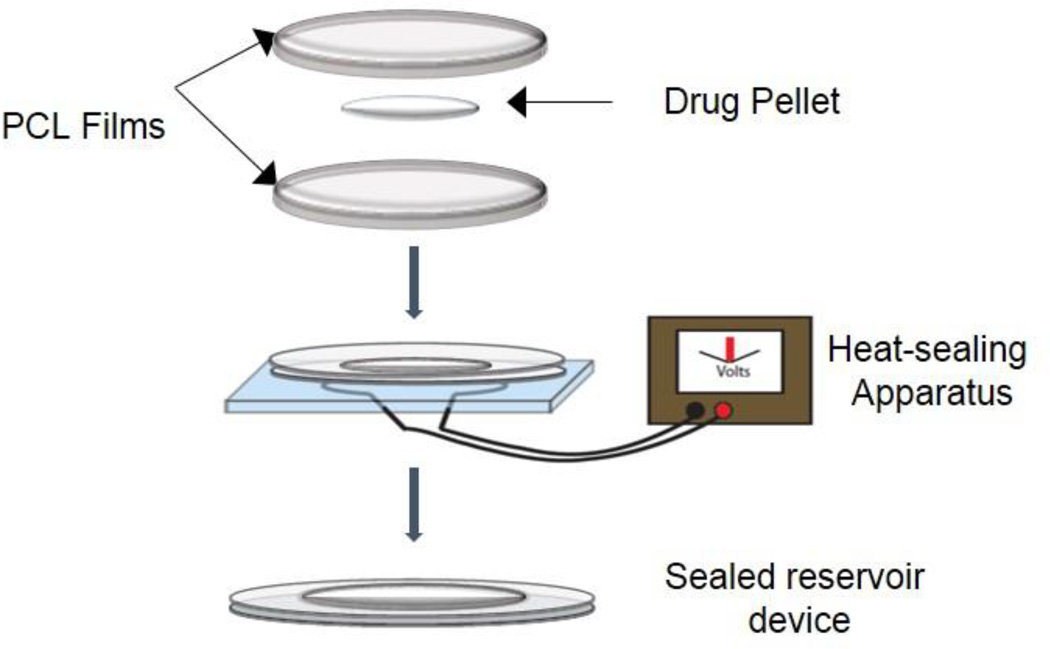
PCL was dissolved at 200 mg/ml in TFE overnight in a 37°C incubator on an orbital shaker. A PCL thin-film was cast onto a 3-inch diameter silicon wafer using a spin-coater (Specialty Coating Systems, Model P6700; 30s at 1500RPM, 30s at 2000RPM) at room temperature. The resulting film was dried under ambient conditions, annealed at 90°C for 15 minutes and cooled at room temperature. Film thickness was measured using a micrometer. Drug-loaded devices were fabricated by heat-sealing two PCL films in a circumference around drug powder [Figure 1]. Device surface area was measured after sealing. For each drug, three devices plus one “unsealed” control (with ¼ of circumference left unsealed) were tested. See Table 3 for a summary of analyzed samples.
Figure 1.
Polycaprolactone reservoir system device fabrication. PCL thin films (< 20µm) are heat sealed around drug product to form a sealed reservoir device. PCL Tm is 60°C, and heat sealing is done by passing current through a nichrome wire embedded in PDMS.
Table III.
Summary of PCL Reservoir Samples Analyzed
| Pharmaceutical | Area (mm2) | Membrane Thickness (um) |
Dk (mm2/hr) |
|---|---|---|---|
| Caffeine | 208 | 15 | 1.7E-11 |
| 208 | 14 | 1.0E-11 | |
| 208 | 13.4 | 4.9E-13 | |
| 188 | 8.5 | 3.8E-10 | |
| 188 | 5.2 | 3.2E-10 | |
| Diltiazem-HCl | 157 | 12.3 | 2.6E-12 |
| 157 | 12.3 | 1.5E-12 | |
| Ranitidine-HCl | 188 | 18.8 | 3.9E-10 |
| 188 | 16.4 | 2.4E-10 | |
| 188 | 14.7 | 1.2E-10 | |
| Verapamil-HCl | 188 | 25.5 | 1.9E-11 |
| Atenolol | 188 | 6 | 1.5E-10 |
| Famotidine | 190 | 16.2 | 1.7E-11 |
| 173 | 16.2 | 2.7E-10 | |
| 173 | 16.2 | 7.1E-11 | |
| Hydrocortisone | 157 | 10.8 | 5.4E-11 |
| 157 | 12.3 | 1.4E-10 | |
| Labetalol-HCl | 208 | 14.5 | 2.5E-12 |
| 208 | 11.8 | 2.6E-11 | |
| 208 | 11.8 | 1.9E-11 |
In vitro Release Experiments
In vitro release experiments were conducted by submerging samples in 0.5–5 mL of PBS pH 7.4 at 37°C on an agitator to approximate physiological conditions and to maintain sink conditions. For each time point, the entire volume of release buffer was removed and replaced with fresh buffer. Exposure to light was minimized to prevent potential degradation of photosensitive drugs. Drug concentration in release buffer for each time point was measured using an ultraviolet (UV) plate spectrophotometer. Calibration curves for each drug in release buffer were made by serial dilutions and upper and lower limits of quantification for the linear range were established. All samples were diluted to be within the linear range of the calibration curve and loaded into 96-well plates in triplicate 100 µL aliquots.
Data Processing
For both matrix and reservoir samples, concentration in each sample was determined using a UV calibration curve for the relevant drug. Based on the release volume, mass released in each time interval and cumulatively were calculated. Matrix system release data was further processed to determine the cumulative percentage of drug released based on the total drug released. Time courses for matrix system data were continued until cumulative drug release reached a clear plateau and release could no longer be detected.
Empirical Models
Matrix System
Release of a drug from the matrix system is represented in two phases when drug loading results in a drug concentration in the solid dispersion matrix greater than the drug solubility in release buffer. A set of empirical equations was defined to fit experimental data for drug release from a
| (Equation 1a) |
| (Equation 1b) |
PCL matrix. The equation for the first phase, while drug loading remains high, is based on the Higuchi equation for drug dispersed in a solid matrix (Equation 1a). The second phase, when drug load is less, is based on an approximation of the non-steady state solution for a monolithic solution under sink conditions10 (Equation 1b). The transition between these two phases can be determined empirically and will depend on initial drug loading and drug solubility. For this study, setting the transition point at 60% release resulted in an empirical fit suitable for all samples. Table 4 contains a description of the variables used in these equations.
Table IV.
Matrix system equation variables (equation 1)
| Parameter | Units | Description | |
|---|---|---|---|
| M/MT | Unitless | Fraction of drug released relative to total drug load | |
| Design Parameters | A | mm2 | Surface area |
| L | mm | Membrane thickness | |
| fd | Unitless | Mass fraction of drug in film | |
| m | mg | Total film mass | |
| CA | mg/L | Drug concentration as mass of drug per unit volume of film | |
| Drug property | Cs | mg/L | Solubility of active pharmaceutical ingredient at 25°C |
| Drug-specific empirical parameters | D | mm2/hr | Diffusion coefficient; dissolved drug through PCL matrix |
| Y’ | Unitless | Empirical correction factor |
Parameters A, L, fd, m and CA are design parameters and empirical parameters D and Y’ as well as solubility are drug-specific. In theoretical equations12, Cs and D are the solubility and diffusion coefficient of the dissolved drug in release buffer within the polymer matrix. In the empirical equation, the aqueous solubility of the active pharmaceutical ingredient at 25°C is used for Cs [Table 1]. Y’ is an empirical correction factor to account for the difference between solubility in an aqueous solution at 25°C and solubility within the polymer matrix under experimental conditions as well as any other deviations from the theoretical equation. For each matrix sample, all parameters except for D and Y were calculated or determined based on matrix characterization and system design. D and Y’ were then calculated empirically, using equation 1, from plots of cumulative mass fraction released versus the square root of time and the natural log of cumulative mass fraction released versus time.
Reservoir System
Based on the solution to diffusion equations describing mass transport through a slab from a constant activity source under sink conditions, the empirical equation 2 describes the release rate of drug from a membrane-controlled reservoir system, in which solid drug remains in the reservoir.12 Table 5 defines each variable contained in equation 2. The empirical parameter “Dk” is calculated from the slope of a cumulative mass versus time plot using measured design parameters (A,L) for each device and solubility measurements from literature [Table 1].
| (Equation 2) |
Table V.
Reservoir system equation variables (equation 2)
| Parameter | Units | Description | |
|---|---|---|---|
| J | mg/hr | Mass flux of drug through membrane | |
| Design Parameters Drug property | A | mm2 | Surface area |
| L | mm | Membrane thickness | |
| CSDP | mg/L | Solubility of drug product at 25°C | |
| Drug-specific empirical parameters | Dk | mm2/hr | Combined diffusion coefficient (dissolved drug through PCL matrix) and partition coefficient (partition into PCL membrane) |
Predictive Model
A predictive model is built for empirical parameters D’ and Y’ in the matrix system and Dk in the reservoir system as a function of drug properties. The models were based on correlations between empirical parameters and drug properties (MW, LogP, solubility, pKa). Correlations were determined for the best-fit equation form (linear, power, logarithmic) and only properties correlating with Pearson coefficients greater than 0.7 were included in the model. Relative residual error was used as a metric when optimizing coefficients in the predictive model.
Results
Empirical Models
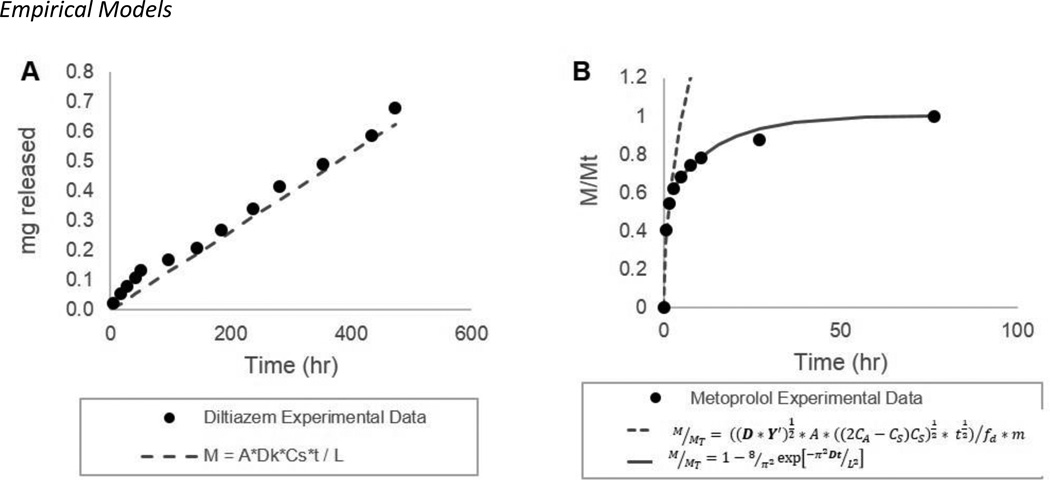
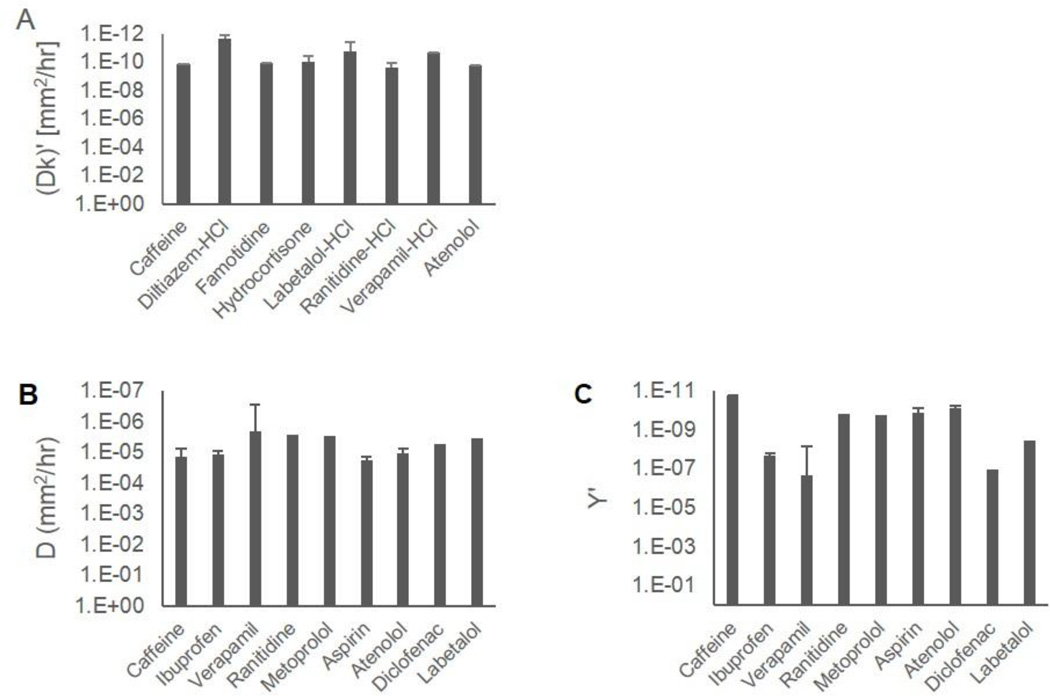
Figure 2 illustrates representative release profiles and empirical fits that describe matrix and reservoir systems. Data points represent typical release from a single device and the empirical fits represent average empirical values from triplicate devices. Empirical fits and parameters are defined in equations 1 and 2, for the matrix and reservoir systems respectively, as described in the data analysis section. Calculated empirical parameters for each system are tabulated in Table 2 and Table 3. Empirical values calculated from different device designs are averaged for each drug and represented in Figure 3 with error bars representing one standard deviation. Dk, D’ and Y’ are independent of design parameters and differ between drugs as depicted in Figure 3, which compares these empirical parameters on a log scale. As shown in Figure 3, the empirical equations accurately model the release profiles from these systems, and the empirical parameters describe the diffusion characteristics of a drug within or through the PCL matrix normalized for device design.
Figure 2. Example of release data and empirical fit.
The cumulative release profile for reservoir devices is linear after an initial burst release (A, Diltiazem). Data fit is based on the equation M = A*Dk*CsDP*t / L and the combined parameter Dk is determined empirically. Release in the matrix system (B, Metoprolol) is described as fraction released and is fit with two equations and two empirical parameters (D’, Y’). Data sets are from a single release experiment and fits are based on average empirical parameters from full data set (n=2–5).
Figure 3.
Empirical parameters describing transport of representative Pharmaceuticals in a PCL reservoir system (A) and PCL matrix (B, C). Empirical parameters are drug specific and represent the diffusion and partition of drug through and into a PCL membrane. Release profiles from a given system depend on empirical parameters, drug solubility and device dimensions.
Predictive Models
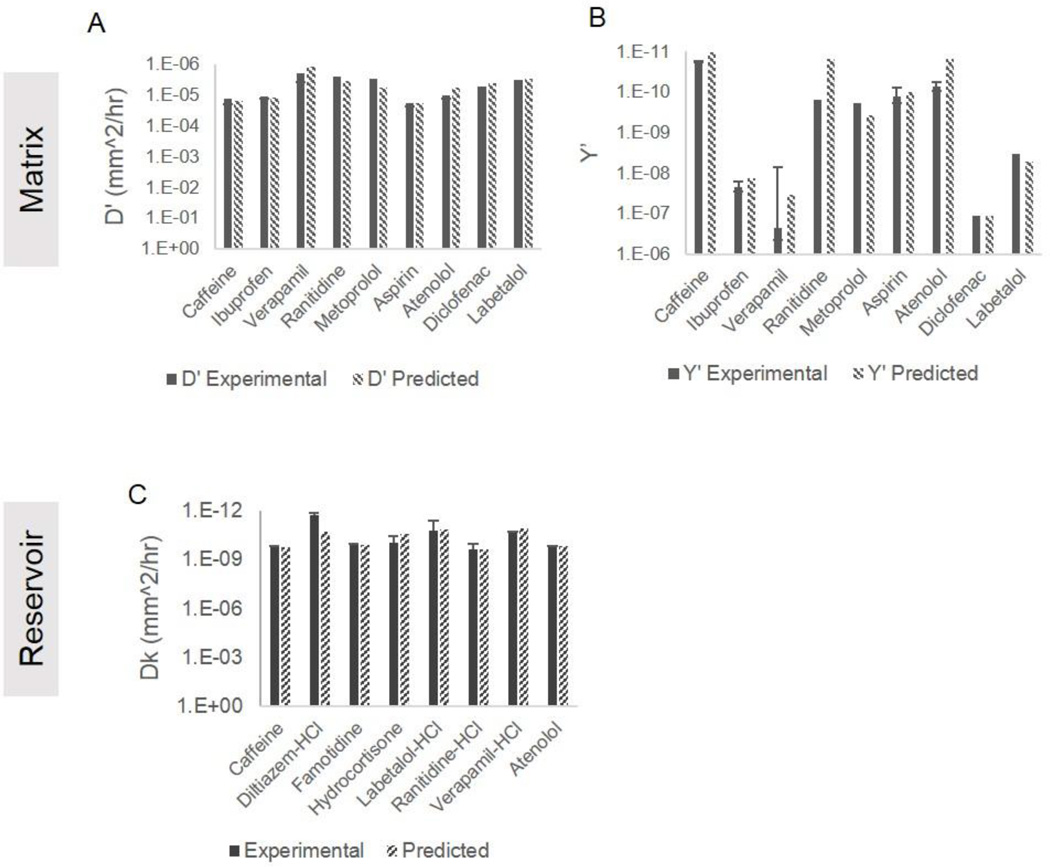
As described in our methods, we have developed a model to predict empirical parameters based on physicochemical properties of drugs. Equations 3a–c below predict empirical parameters D’ and Y’ in a PCL matrix system and Dk in a PCL reservoir system. Figure 4 compares the predicted empirical parameters to experimental empirical parameters in both the matrix and reservoir systems. The predictive models were built to minimize relative residual error (RRE). The average RRE in the reservoir system in the final model is 1.2, with Diltiazem-HCl as an outlier with an RRE of 8.1. Excluding Diltiazem-HCl, the RRE of the remaining 7 drugs falls to 0.2. The RREs for predicted parameters in the matrix
| (Equation 3a) |
| (Equation 3b) |
| (Equation 3c) |
system are 0.3 and 0.6 for D’ and Y’ respectively.
Figure 4.
Predicted and experimental values of empirical parameters.
Discussion
Empirical model
In the reservoir system, dissolved drug in the reservoir, driven by a concentration gradient between reservoir and bulk, partitions into the polymer membrane and then diffuses through the membrane into the bulk fluid. The diffusion coefficient (D) is a measure of the rate of diffusion of dissolved drug through the polymer matrix and the partition coefficient (k) is a measure of the molecules affinity for the polymer membrane relative to the aqueous bulk. In the empirical analysis for the reservoir system, D and k are calculated as a single parameter and cannot be determined independently. In the matrix system, solid dispersed drug in the polymer matrix partitions and dissolves in the fluid permeating into the matrix, driven by the difference in concentration between drug in the solid matrix and the saturated drug concentration in the permeating fluid. The dissolved drug then diffuses through the polymer matrix and releases into the surrounding bulk fluid. A more thorough explanation of the theoretical equations and solutions to diffusion equations in these systems can be found in a 2012 review by Siepmann and Siepmann in the Journal of Controlled Release (Reference 10). The diffusion coefficient (D’), the same as in the reservoir system, is a measure of diffusion rate of dissolved drug through the polymer matrix. Y’ is included in the empirical equation for the matrix system as a scaling factor to adjust for using drug solubility in a bulk fluid rather than the actual saturated drug concentration in the polymer matrix.
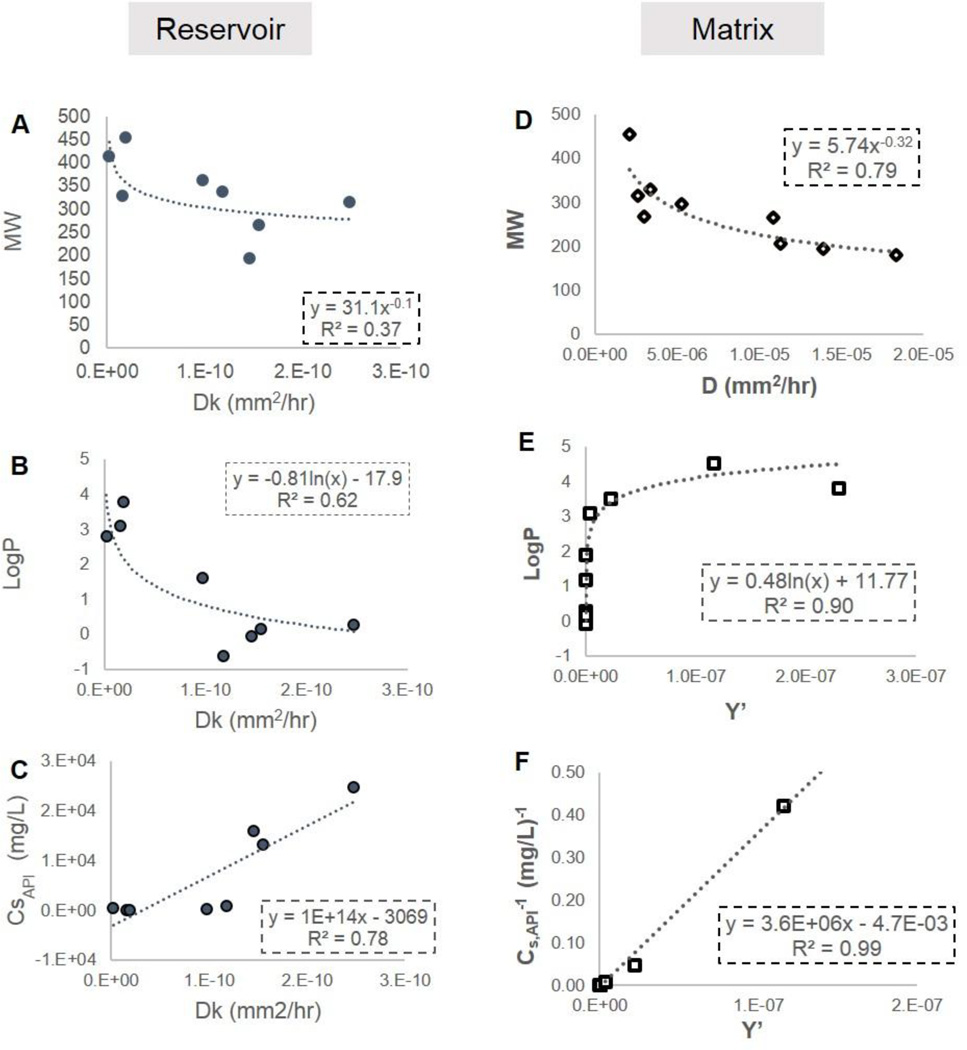
These empirical parameters differ for different drugs (Figure 3) and are related to the interaction between the drug molecule and the polymer. Correlations between empirical diffusion parameters and drug properties suggest the nature of these interactions and their relative impact on drug release. Figure 5 shows relevant correlations for both the matrix and reservoir systems. Diffusion coefficients are known to be dependent on molecular size, and as expected, in both the matrix and reservoir system, there is a similar trend of increasing D (i.e. faster diffusion) with decreasing molecular weight. D cannot be distinguished independent of k in the reservoir system, but as the empirical D in both systems describes the rate of diffusion for dissolved drug through PCL matrix, it is likely that the trend with MW observed for Dk is driven by the dependence of D on MW. There is also a strong logarithmic correlation (correlation coefficient = 0.79) between Dk in the reservoir system and LogP. This is attributed to the partition of drug from the reservoir into the membrane as described by k. Since PCL is a hydrophobic polymer, the drug must partition from a hydrophilic to hydrophobic environment. The P in LogP is also a measure of drug partition between a hydrophobic and hydrophilic phase, and thus a linear correlation between P and k is expected.
Figure 5. Correlations between drug properties and empirical diffusion parameters.
Diffusion coefficient (D) shows a weak negative correlation to molecular weight in both systems (A,D). In the reservoir system (A,B,C), the combined empirical parameter Dk [M = ADkCSt] is inversely correlated to API solubility (aq, 25°C) and proportional to the partition coefficient “P” as illustrated by the logarithmic correlation between LogP and Dk (B). D and k can not be independently determined from reservoir system release data. In the matrix system, described by the empirical equations Y’ shows similar yet opposite correlations to Dk in the reservoir system in that it is inversely correlated to drug solubility (F) and negatively proportional to the partition coefficient “P” (E).
Interestingly, in the matrix system, Y’ shows a negative logarithmic correlation with LogP. This can be explained due to solid drug in a matrix dispersion partitioning from the hydrophobic environment into the more hydrophilic environment of the permeating fluid. Thus in the matrix system, molecules with larger LogP and a greater affinity for hydrophobic environments will have a smaller Y’, whereas in the reservoir, more hydrophobic drugs will have a larger Dk and more readily enter into the polymer membrane. Y’ appears to encompass an effective partition coefficient in the empirical model presented here to describe release from the PCL matrix system.
Y’ in the matrix system and Dk in the reservoir system show opposite correlations with solubility. While these correlations are significant (correlation coefficient greater than 0.7), they are likely influenced by the inherent relationship between drug solubility and LogP. It should be noted that the correlation coefficient for Dk with MW in the reservoir system is only 0.6 and is weak compared to the correlation between Dk and LogP attributed to the partition coefficient (k). This suggests that in the PCL membrane controlled reservoir system, drug release is more strongly influenced by the partition of drug from hydrophilic aqueous bulk to hydrophobic polymer membrane than by the diffusion of drug within the membrane.
Utilizing the predictive and empirical models
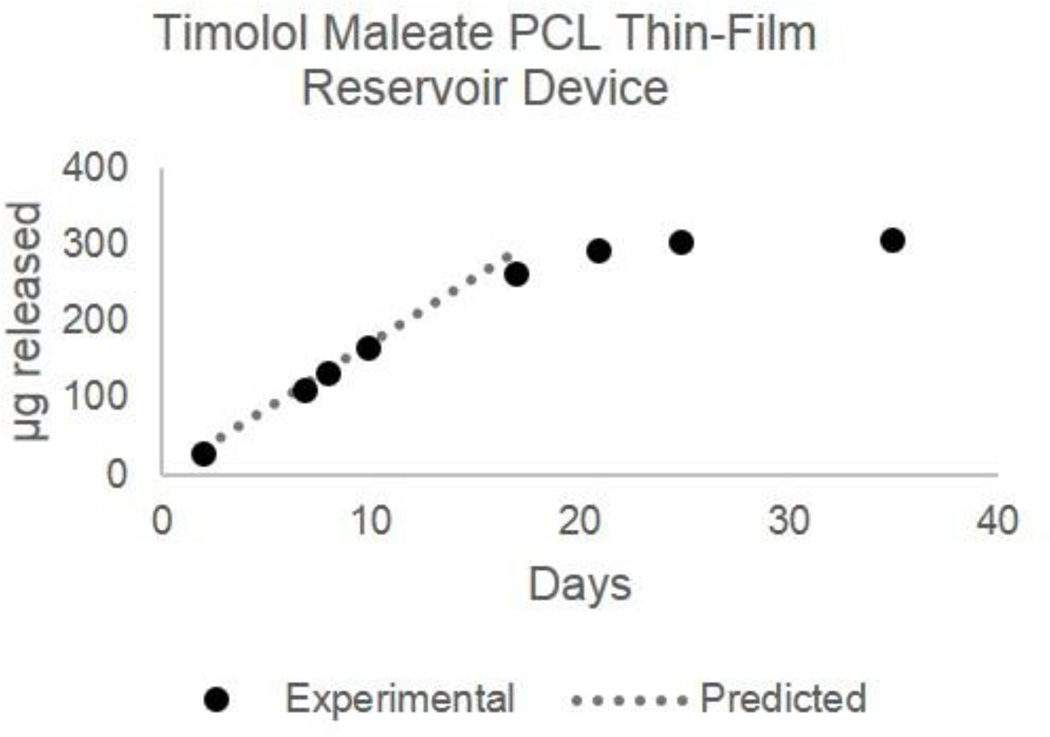
The models presented here are useful in early system design as well as evaluation of a PCL thin-film device for delivering a given drug at a target rate and dose. For example, we can use the predictive model to calculate Dk for Timolol [Solubility16 = 2.740 g/L, MW =316.4215, LogP = 1.8315, and pKa15 = 9.21; Dk = 4.18E–11mm2/hr] and equation 2 to model release from a reservoir device loaded with Timolol Maleate [Solubility17 = 100 g/L, MW = 432.4915] to design a device with suitable dimensions and a target release rate of 10–30 µg/day18 for long-acting glaucoma treatment. Based on the predictive and empirical models, a 2×3mm rectangular device (12mm2 surface area) made with a 70 µm thick PCL membrane will achieve a release rate of 17 µg Timolol/day. The duration of drug release depends on the mass loaded into the device reservoir; here we demonstrate a 15 day device with a total drug load of 300 µg Timolol (410 µg Timolol Maleate). The predicted linear release rate and experimental results in Figure 6 demonstrate that the models accurately predict the linear release rate from the reservoir device. As drug depletes and the total mass in the reservoir falls below the solubility limit, the release kinetics reflect 1st order Fickian diffusion. Due to the small reservoir volume, the mass released in this non-linear phase is small (< 40 µg).
Figure 6.
Predicted and experimental release profile for Timolol from a Timolol-Maleate loaded PCL reservoir device. Device dimensions are 2×3mm rectangle with a 70um thick membrane and 0.4mg Timolol-Maleate (0.3mg Timolol) load. Device was designed using predictive modeling and empirical equations for a 17ug/day Timolol release rate with dimensions appropriate for front of the eye delivery.
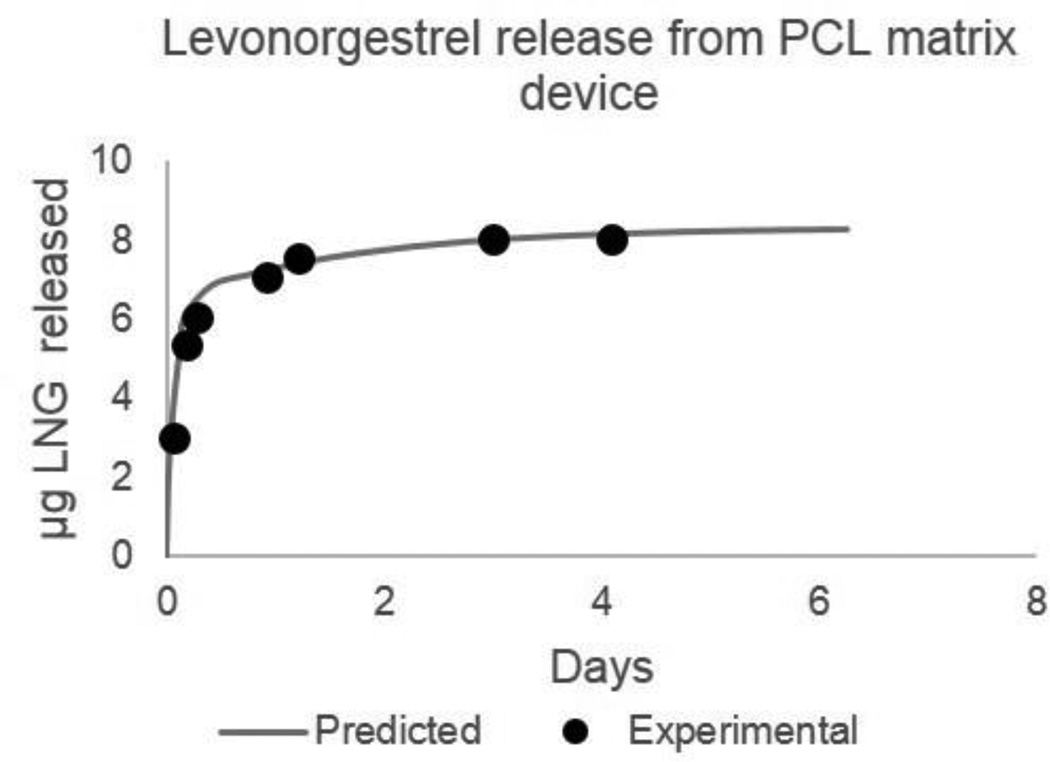
In another example, we designed a PCL matrix system as a potential on-demand vaginal film releasing the contraceptive levonorgestrel. In this case, we use the predictive model to calculate D’, 3.69E-06 mm2/hr, and Y’, 5.03E-08, based on levonorgestrel drug properties (MW = 312, LogP = 3.8, pKa = 13, solubility = 2 mg/L).15 To target a 1 to 2 day sustained-release profile with 5–10 µg of total drug release, we designed a 6 mm-diameter PCL film, 38 µm thick with 0.8% drug loading by mass. Figure 7 shows the predicted and experimental release profile for this system. As previously described, the release profile for a matrix system is defined as a percent-released, therefore, the mass of levonorgestrel release from this film can be easily scaled with film diameter depending on desired dosing.
Figure 7.
Predicted and experimental release profile for Levonorgestrel (LNG) from a PCL matrix film. Film dimensions are 6mm diameter, 38µm thick, with a 0.8% mass loading of LNG. Device was designed using predictive modeling and empirical equations for a 5–10ug sustained release for 1–2 days as a potential on-demand vaginal film contraceptive.
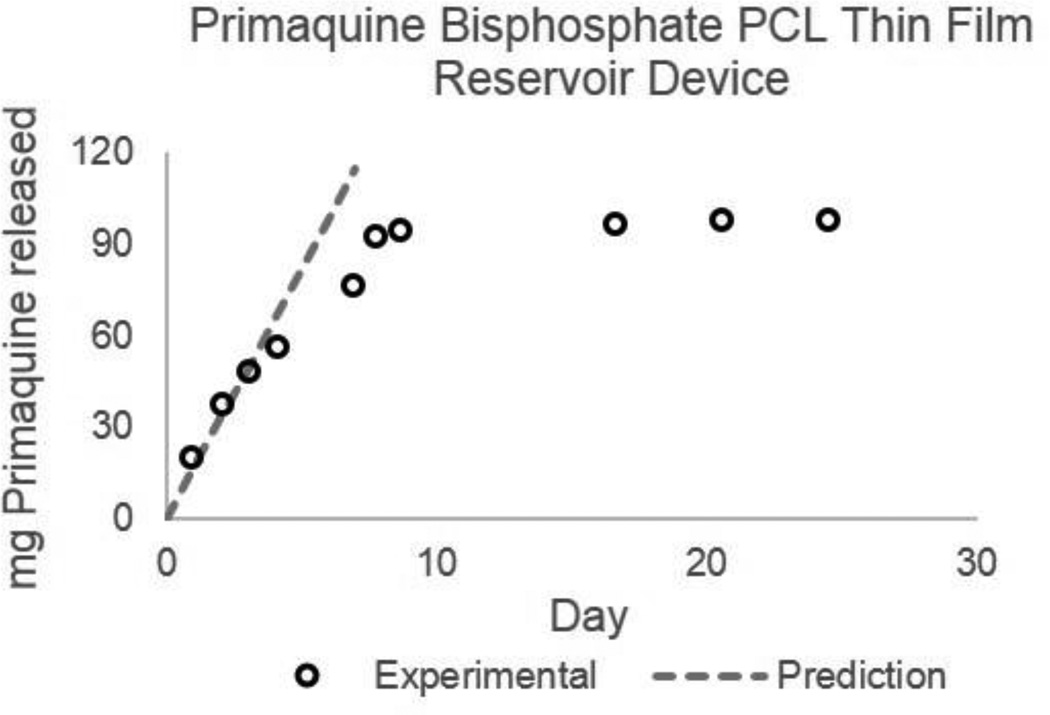
Finally, we applied the predictive and empirical models to design a PCL thin-film device for long-acting malaria prophylaxis. Based on a basic pharmacokinetic model taking into account oral bioavailability, plasma half-life, volume of distribution and minimum and maximum plasma concentrations for steady-state oral dosing of primaquine bisphosphate19, we estimated a target constant-rate release of 12–24 mg/day to achieve 50–100 ng/ml plasma concentration for effective malaria prophylaxis. Based on the properties of primaquine (MW = 259, LogP = 2.1, pKa = 10.2, API-solubility = 56.4 mg/L, drug product (primaquine bisphosphate) solubility = 166.7g/L)15,19, Dk was predicted (2.05E-11 mm2/h) and the empirical model for release from a constant-activity reservoir device was used to design a PCL thin-film device targeting 16 mg/day release with a 4 µm thick membrane, 800 mm2 (40 mm×10 mm rectangle) surface area, and 175 mg primaquine phosphate (99 mg primaquine) load for 10 days of drug release. Figure 8 illustrates the predicted linear release rate and experimental data from this device.
Figure 8.
Predicted and experimental release profile for Primaquine from a Primaquine bisphosphate loaded PCL reservoir device. Device dimensions are 10×40mm rectangle with a 4um thick membrane and 175mg primaquine bisposhpate (99mg primaquine) load. Device was designed using predictive modeling and empirical equations for a 16mg/day release rate.
Conclusion
The empirical models presented here describe a systematic approach to easily determine empirical parameters that define a drug’s release profile from a PCL thin-film matrix and a PCL thin-film reservoir device. These empirical parameters, D’ and Y’ for the matrix and Dk for the reservoir, are specific to the PCL system and to each drug. Once determined, these parameters allow for easy system design and scale-up or scale-down to achieve a target release rate and quantity for a given drug. Additionally, these parameters depend on a drug’s physicochemical properties, indicating that the mass transport of drug from the matrix system into the release buffer is not only affected by concentration gradients as described in the diffusion equation, but also by interactions between drug molecules and polymer. Diffusion rate of dissolved drug through the polymer in both the matrix and reservoir system depends on molecular weight, with larger molecules diffusing more slowly. In the reservoir system, the partition of drug into the polymer membrane depends on LogP and solubility, with more hydrophobic (larger LogP and lower solubility) drugs partitioning faster. Conversely, in the matrix system, drug partition from the solid polymer matrix to the permeating fluid depends on LogP and solubility with opposite correlations to those observed in the reservoir system. In the matrix system, hydrophilic drugs partition more rapidly from the polymer matrix.
We have presented useful tools for system evaluation and design in the form of empirical models and predictive equations for empirical parameters. We have also demonstrated the utility of these models in preliminary designs for controlled-release thin-film PCL delivery devices for several indications. In addition to being a useful tool for device design, our results give insight into the key physicochemical properties of drugs and polymer-drug interactions affecting release. While our work focuses on PCL systems, the empirical models and approaches for developing a predictive model for empirical parameters could be expanded to other polymer membranes.
Acknowledgments
The authors are grateful for support of this work from the National Institutes of Health (R01EY021574-01A1), the National Science Foundation (EEC-0914790), and a Wallace H. Coulter Foundation Translational Research Award. In addition, E.B.S was supported by an NIH training grant (GM008155).
Abbreviations
- PCL
Polycaprolactone
- TFE
2,2,2-Trifluoroethanol
- MW
Molecular weight
- D’
Empirical diffusion coefficient describing diffusion in a PCL membrane
- Y’
Empirical parameter describing drug partition from PCL matrix, described in more detail in text
- Dk’
Combined empirical parameter including diffusion coefficient (D) and partition coefficient for drug in PCL membrane
- Cs
Solubility; saturated concentration
Footnotes
Publisher's Disclaimer: This is a PDF file of an unedited manuscript that has been accepted for publication. As a service to our customers we are providing this early version of the manuscript. The manuscript will undergo copyediting, typesetting, and review of the resulting proof before it is published in its final citable form. Please note that during the production process errors may be discovered which could affect the content, and all legal disclaimers that apply to the journal pertain.
References
- 1.Winner B, Peipert J, Zhao Q, Buckel C, Madden T, Allsworth J, Secura G. Effectiveness of long-acting reversible contraception. N Engl J Med. 2012;366:1998–2007. doi: 10.1056/NEJMoa1110855. [DOI] [PubMed] [Google Scholar]
- 2.Knight O, Lawrence S. Sustained drug delivery in glaucoma. Curr Opin Opthalmol. 2014;25:112–117. doi: 10.1097/ICU.0000000000000031. [DOI] [PubMed] [Google Scholar]
- 3.Curran M, Keating G. Management of schizophrenia - defining the role of long-acting injectable Risperidone. Dis. Manag. Health Out. 2006;14:107–125. [Google Scholar]
- 4.Spreen W, Margolis D, Pottage J. Long-acting injectable antiretrovirals for HIV treatment and prevention. Curr Opin HIV AIDS. 2013;8:565–571. doi: 10.1097/COH.0000000000000002. [DOI] [PMC free article] [PubMed] [Google Scholar]
- 5.Grattoni A, Shen H, Fine D, Ziemys A, Gill J, Hudson L, Ferrari M. Nanochannel technology for constant delivery of chemotherapeutics: beyond metronomic administration. Pharm. Res. 2011;28:292–300. doi: 10.1007/s11095-010-0195-6. [DOI] [PubMed] [Google Scholar]
- 6.Saltzman W, Olbricht W. Building drug delivery into tissue engineering. Nat. Rev. Drug Discov. 2002;1:177–186. doi: 10.1038/nrd744. [DOI] [PubMed] [Google Scholar]
- 7.Bernards D, Lance K, Ciaccio N, Desai T. Nanostructured thin film polymer devices for constant-rate protein delivery. NanoLetters. 2012:5355–5361. doi: 10.1021/nl302747y. [DOI] [PMC free article] [PubMed] [Google Scholar]
- 8.Woodruff M, Hutmacher D. The return of a forgotten polymer: polycaprolactone in the 21st century. Progress in Polymer Science. 2010;35:1217–1256. [Google Scholar]
- 9.Klose D, F S, Elkharraz K, Siepmann F. PLGA-based drug delivery systems: importance of type of drug and device geometry. Int. J. Pharm. 2008;354:95–103. doi: 10.1016/j.ijpharm.2007.10.030. [DOI] [PubMed] [Google Scholar]
- 10.Sung K, Han R, Hu O, Hsu L. Controlled release of Nalbuphine prodrugs from biodegradable polymeric matrices: influence of prodrug hydrophilicity and polymer composition. Int. J. Pharm. 1998;172:17–25. [Google Scholar]
- 11.Rosenberg R, Devennev W, Siegel S, Dan N. Anomalous release of hydrophilic drugs from poly(e-caprolactone) matrices. Mol. Pharm. 2007;4:943–948. doi: 10.1021/mp700097x. [DOI] [PubMed] [Google Scholar]
- 12.Siepmann J, Siepmann F. Review: modeling of diffusion controlled drug-delivery. J. of Cont. Rel. 2012;161:351–362. doi: 10.1016/j.jconrel.2011.10.006. [DOI] [PubMed] [Google Scholar]
- 13.Siepmann J, Gopferich A. Mathematical modeling of bioerodible, polymeric drug delivery systems. Adv. Drug Del. Rev. 2001;48:229–247. doi: 10.1016/s0169-409x(01)00116-8. [DOI] [PubMed] [Google Scholar]
- 14.Petropoulus J, Papadokostaki K, Amarantos S. A general model for the release of active agents incorporated in swellable polymeric matrices. J. Pol. Sci. B: Pol. Phys. 1992;30:717–725. [Google Scholar]
- 15.Wishart D, Knox C, Guao A, Cheng D, Shrivastava S, Tzur D, Hassanali M. DrugBank: a knowledge base for drugs, drug actions and drug targets. Nucleic Acids Res. 2008;36(Database Issue):D901–D906. doi: 10.1093/nar/gkm958. [DOI] [PMC free article] [PubMed] [Google Scholar]
- 16.Jaeger A, Flesch F, Kopferschmitt J, Sauder P. www.inchem.org. 1991 Mar 28; Retrieved 2014, from IPCS - inchem: Timolol: http://www.inchem.org/documents/pims/pharm/timolol.htm. [Google Scholar]
- 17.Hiratani H, Fujiwara A, Tamiya Y, Mizutani Y, Alvarez-Lorenzo C. Ocular release of timolol from molecularly imprinted soft contact lenses. Biomaterials. 2005;26:1293–1298. doi: 10.1016/j.biomaterials.2004.04.030. [DOI] [PubMed] [Google Scholar]
- 18.Jung Jung H, Chauhan A. Extended release of timolol from nanoparticle loaded fornix insert for glaucoma therapy. J Ocul Pharmacol Ther. 2013;29:229–235. doi: 10.1089/jop.2012.0114. [DOI] [PMC free article] [PubMed] [Google Scholar]
- 19.Kasilo OJ, Nhachi CFB. www.inchem.org. 1990 Mar; Retrieved 2014, from IPCS-inchem:Primaquine phosphate: http://www.inchem.org/documents/pims/pharm/primaqui.htm. [Google Scholar]
- 20.Llinas A, Burley J, Box K, Glen R, Goodman J. Diclofenac solubility: independent determination of the intrinsic solubility of three crystal forms. J. Med. Chem. 2007;50:979–983. doi: 10.1021/jm0612970. [DOI] [PubMed] [Google Scholar]
- 21.Zur M, Gasparini M, Wolk O, Amidon G, Dahan A. The low/high BCS permeability class boundary: physicochemical comparison of metoprolol and labetalol. Mol. Pharmaceutics. 2014;11:1707–1714. doi: 10.1021/mp500152y. [DOI] [PubMed] [Google Scholar]
- 22.Tocris product data sheet, VerapamilHCl
- 23.SantaCruz Biotech, Enzo Life sciences product data sheet, DiltiazemHCl
- 24.Sigma MSDS, Ranitidine HCl


