

Significance
Hybrids have an important role in many crops used for global food production. The increased production levels of biomass and grain are restricted to the first-generation hybrid. We report stabilization of hybrid vigor traits in pure breeding hybrid mimic lines. Comparison of the patterns of their gene activity with those of the F1 hybrids has identified metabolic pathways associated with the generation of the hybrid vigor phenotype. The hybrid mimics are homozygous for long chromosomal segments showing that heterozygosity is not required for the production of the heterotic phenotype. Interactions between the two parental genomes and epigenomes contribute to the vigor of the Arabidopsis hybrids and are likely to be the basis of hybrid vigor in other plant species.
Keywords: heterosis, TCM, epigenetics, transregulation, transcriptome
Abstract
F1 hybrids can outperform their parents in yield and vegetative biomass, features of hybrid vigor that form the basis of the hybrid seed industry. The yield advantage of the F1 is lost in the F2 and subsequent generations. In Arabidopsis, from F2 plants that have a F1-like phenotype, we have by recurrent selection produced pure breeding F5/F6 lines, hybrid mimics, in which the characteristics of the F1 hybrid are stabilized. These hybrid mimic lines, like the F1 hybrid, have larger leaves than the parent plant, and the leaves have increased photosynthetic cell numbers, and in some lines, increased size of cells, suggesting an increased supply of photosynthate. A comparison of the differentially expressed genes in the F1 hybrid with those of eight hybrid mimic lines identified metabolic pathways altered in both; these pathways include down-regulation of defense response pathways and altered abiotic response pathways. F6 hybrid mimic lines are mostly homozygous at each locus in the genome and yet retain the large F1-like phenotype. Many alleles in the F6 plants, when they are homozygous, have expression levels different to the level in the parent. We consider this altered expression to be a consequence of transregulation of genes from one parent by genes from the other parent. Transregulation could also arise from epigenetic modifications in the F1. The pure breeding hybrid mimics have been valuable in probing the mechanisms of hybrid vigor and may also prove to be useful hybrid vigor equivalents in agriculture.
In Arabidopsis some ecotypes with similar genome sequences produce F1 hybrids with large increases in vegetative and reproductive yields (1, 2). These results appear to be at variance with the generalization that the larger the genetic distance between parents, the greater the hybrid vigor (3); however, the Arabidopsis ecotypes have different epigenomes that may be important for hybrid vigor (4). In hybrids between C24 and Ler, we found altered levels in two epigenetic systems: 24nt siRNAs and DNA methylation (4, 5). These epigenetic changes appear common among hybrid systems with similar observations being made in maize and rice hybrids (6). The epigenetic changes can correlate with changes in gene expression and contribute to the unique gene expression profile of the F1 hybrid (7). Not all crosses result in hybrid vigor (heterosis); some result in decreased vigor and yield referred to as “hybrid weakness” (8).
Heterotic F1 hybrids are featured in agricultural and horticultural crops, and in all species, the yield gains are restricted to the F1 generation. The F2 and subsequent selfed generations are discarded because of reduced yields and heterogeneity of morphological and developmental traits. A hybrid crop system requires an efficient method of F1 hybrid seed production dependent on male sterility in the female parent and synchronous flowering of the male and female parents.
QTL analysis in maize and rice has confirmed that hundreds of genome segments contribute to the heterotic phenotype, but the main molecular mechanisms of hybrid vigor have not been determined (9). Although these data show the heterotic phenotype to be multigenic, supporting the suggestion that the reductions in vigor in the F2 and subsequent generations result from segregation of genomic expression units, there are reports of stabilization of hybrid vigor traits being achieved through a program of trait selection. In 1959, Williams selected F4 tomato lines from F2 plants of two commercial F1 hybrids; the F4 lines had greater fruit size and yield than the traits in the F1 parents (10). In wheat, Busch et al. (11) selected random F3 plants generated from heterotic F1 wheat hybrids and produced pure breeding F5 lines, some of which had vigor attributes equal to or surpassing the hybrid (11). A similar finding was reported in the legume, field pea (12). These experiments, reporting pure breeding lines by the F5, all support a conclusion that there must be relatively few segregating units of the genome which produce the F1-like hybrid phenotype.
We attempted to fix the F1 phenotype in the Arabidopsis C24/Ler hybrid to produce pure breeding lines in subsequent generations that had yield increases similar to the F1 hybrid. We found we were able to stabilize F1 traits within a few generations of selection. We used recurrent selection based initially on the phenotype of F2 plants, which closely resembled the F1 hybrid phenotype. This procedure led to the production of pure breeding lines with F1-like phenotypes by the F5 generation: we called these hybrid mimics. These hybrid mimics were powerful tools for comparing their patterns of gene expression with the patterns of gene expression in the F1 and allowed us to identify key metabolic pathways in the F1 and in each of the hybrid mimics important in the production of the hybrid phenotype.
In our analyses, we found that the hybrid mimics in the F6 generation were largely homozygous for most of the chromosomal segments of the genome, with only limited heterozygosity in segments of some chromosomes. A large number of genes in the hybrid mimic lines had expression levels different from their parental expression levels. These transregulated genes were probably the result of both epistatic interactions and epigenetic regulation contributing to the unique gene expression patterns of the hybrid mimic lines and the F1 hybrids.
Results
In crosses between the C24 and Ler ecotypes, the F1 hybrids had substantial levels of hybrid vigor in vegetative biomass of the rosette and reproductive yields of seed production (13). At 15 d after sowing (DAS), the vegetative biomass of the F1 hybrids was ∼26% greater than the biomass of the better parent, and at 28 DAS, the F1 biomass had increased to ∼90% greater than the better parent (Fig. 1 and Fig. S1). The plants of the F1 generation have a uniform phenotype with a high level of hybrid vigor. In contrast, the F2 population has heterogeneous phenotypes in rosette diameter, leaf morphology, and flowering time. The largest plants in the F2 population are similar to the F1 hybrid phenotype and have a flowering time falling within the range of the flowering times of the two parents (Fig. 1 and Fig. S2A).
Fig. 1.

The two parents, C24 and Ler, together with the F1 hybrid and F2 plants at 28 d after sowing. F2 plants show increased variance of rosette diameter and flowering time. Reproduced with permission from ref. 6, copyright American Society of Plant Biologists.
Fig. S1.

Relative rosette diameter measurements of F4 plant samples for transcriptomes. Fifty seeds from each selected eight F4 hybrid mimic line (L1-1, L1-2, L2-1, L2-2, L3-1, L3-2, L4-1, and L4-2) and one small plant line (S1-1) grown as a population. The largest five plants in each population were used for RNA extraction. (A) Relative rosette diameters and relative fresh weight of 15 DAS transcriptome samples. (B) Relative rosette diameters and relative fresh weight of 28 DAS transcriptome samples. Two biological replicates for each sample were prepared for transcriptomes. The measurements represent the average value of two biological replicates. Black dotted line represents MPV. Error bars = SEM.
Fig. S2.

(A) Size selection in the F2 generation. One hundred F2 plants from 50 selfed seeds of each reciprocal hybrid were grown as the selection population. Rosette diameters of each plant measured at 39 DAS are plotted along the y axis, with the x axis representing the flowering time (days until IPV). Red/blue dots represent six large plants (L) and five small plants (S) selected for generating F3 seeds. Black dotted line represents MPV (n > 8); red dotted line represents the average rosette size of F1 hybrids (n = 12). (B) The genealogical tree of hybrid mimics. Six large and five small F2 plants were selected from a F2 population of 100 plants. The six large and five small F2 plants were selfed, and 50 F3 seeds from each were grown as F3 lines. Ninetten large and six small F3 plants were selected to produce F4 offspring. F4 population of 50 plants of each plant line were analyzed, and two hybrid mimic F4 plants were selected for generating F5; four hybrid mimic plants were selected in the F5 to produce the F6 seeds.
In a program of recurrent selection based around individual F2 plants selected on the basis of F1-like rosette diameter, we were able to develop pure breeding F5/F6 lines featuring traits similar to those of the F1 hybrid plants (Fig. 2). In each successive generation of selfing, we selected the largest plants (n = 2–5) from a population of 50 progeny of an individual selfed plant (Fig. 2A and Figs. S2–S4). In line L3, the mean rosette diameter increased markedly in the F3–F4 transition and then had lower intergenerational increases in the F4–F6 (Fig. 2A and Figs. S3 and S4). In addition, the variance in the size of individual plant rosettes reduced in each generation. By the F5 generation, the increased rosette diameter and decreased level of phenotypic variance produced a progeny population of plants with phenotypes similar to the F1 hybrid (Fig. 2A). In the F6 generation, the characteristics of the F5 were maintained indicating a fixation of the vegetative traits of rosette diameter, fresh weight, and seed yields approaching the F1 values of these traits (Fig. 2 B–E).
Fig. 2.

F6 hybrid mimic lines showed phenotypes comparable to the F1 hybrids. (A) Box-plots showing the progress of hybrid mimic line selection in each generation; all plants in each generation are included. Black dotted line represents the rosette diameter of the F1 hybrid. n > 40. (B) The rosette diameter (RD) measurements. n > 25. (C) The fresh weight (FW) measurements. n > 25. (D) Relative seed yields (total seed weight vs. MPV) of the main shoot of two parents, F1 hybrid, and four F6 hybrid mimic lines. n = 5. (E) The phenotypes of the parents, F1 hybrids and F6 hybrid mimic at 47 DAS. Black dotted line in B–D represents the better parent value (BPV). **Significant differences at P (Student t test) < 0.01 from MPV. *Significant differences at P < 0.05 from MPV. Error bars = SEM. All plants were grown on MS medium. In Fig. S3, all plants were grown on MSNoble medium in the first 18 DAS, producing slightly different growth results.
Fig. S4.

Selection of F4 hybrid mimic lines. (A) Fifty seeds from each selected F3 plant were grown as a F4 population. In each population, the rosette diameters of F4 plants are plotted along the y axis, with the x axis representing the flowering time (days until IPV). Orange dotted lines represent the ranges of flowering time of parents (23–39.5 DAS). (B) RDs of F4 plant lines. (C) FW of selected F4 plant lines. (D) Total seed number of the main shoot of the parents, hybrids, and selected F4 hybrid mimic lines (n = 5, largest 10% plants). Error bars = SEM. Black dotted line represents MPV. *Significant differences at P (Student t test) < 0.05 from MPV. √Eight F4 hybrid mimic lines and one small plant line selected for RNA-Seq.
Fig. S3.

Size selection in the F3 generation. (A) Approximately 50 seeds from selfed selected F2 plants were grown as F3 populations. In each population, the rosette diameters of F3 plants are plotted along the y axis, with the x axis representing the flowering time (day until IPV). Red/blue dots represent large/small plants selected for generating F4 seeds. Orange dotted lines represent the range of the flowering time of parents (21–37 DAS). (B) Rosette diameters of 19 large and 5 small F3 plants. Numbers above the bars represent the flowering time of the parents (n > 53) and each F3 plant (n = 1). Black dotted line represents MPV (n > 53). Error bars = SEM. In this experiment, plants were grown on MSN medium in the first 18 DAS, producing slightly different results to that in Fig. 2A while plants were grown on MS medium.
In the L4 line, the presence of early flowering plants in the F4, segregating from a heterozygous F3 plant, interfered with the increase in rosette size and the decrease in rosette variance. The selection regime in the F5 reestablished the expected hybrid mimic progression by the F6 generation. The similarity of F6 plants to the F1 hybrid plants was most obvious in rosette diameter (Fig. 2B), the trait we used as the selection parameter, but fresh weight and seed yields were also markedly increased compared with either C24 or Ler parental lines (Fig. 2 C and D). We anticipate that if fresh weight and seed yield had also been used as selection criteria, these traits would be fully comparable to the F1 hybrid in the F6 plants.
We termed the independent F4 and F6 lines hybrid mimics (Fig. 2E), each line having traits characteristic of the F1 hybrid. In addition to these F1-like plant selections, we also carried out recurrent selection for a small plant phenotype. We retained only one small plant line in the F4; the other small plant selections had phenotypes similar to the smaller parent (Figs. S2–S4) and were not further analyzed.
Parallel but Different Developmental Growth of the F1 Hybrid and the F4 Hybrid Mimic Lines.
In the F1 and hybrid mimic lines, at both F4 and F6 generations, the growth parameters throughout development up to 39 DAS were greater than those of the parents (Fig. 3 A and B). The hybrid mimics do not have patterns of growth identical to the F1 hybrid or to each other, but all were similar (Fig. 3A). The two L1 lines (L1-1 and L1-2) were slower than the other selected hybrid mimic lines in the initial 18 d of growth but subsequently caught up, and by 28 d, had phenotypes similar to the other lines (Fig. 3A). The F4 lines (Fig. 3B) did not reach the state of phenotypic uniformity or vegetative size occurring in the F1, but the F6 generation plants were comparable to the F1 plants (Fig. 2A).
Fig. 3.

Selected F4 hybrid mimic lines show vigor comparable to F1 hybrids. (A) Growth course of the top 10% plants in each F4 hybrid mimic line. Five plants were measured per line. y axis represents the increased size relative to the MPV (RDF4 line − RDMPV). (Inset) Expansion of the 10–18 DAS growth. Red line represents the F1 hybrids; the different colored lines represent individual F4 lines. (B) F4 plant lines L3-1 and L4-2 showed large rosette sizes and uniformity close to F1. Photos were taken at 29 DAS. Leaf areas (C), cell numbers (D), and cell sizes (E) of parents, hybrids, eight F4 hybrid mimic lines, and one small plant line at 15 DAS. **Significant differences at P (Student t test) < 0.01 from MPV. *Significant differences at P < 0.05 from MPV. (F) Image of palisade mesophyll cells from parents, hybrids, and the F4 lines with largest cell size and smallest cell size. [Scale bar (50 μm) applies to all images in F.] Error bars = SEM.
The F1 Hybrids and Hybrid Mimics Have Larger Leaves Than the Parents.
In both reciprocal F1 hybrids, the leaves can be 50–90% larger in lamina area than the parents, and this is also true for the F4 large hybrid mimic lines (Fig. 3C). Large leaves is a trait that is common to F1 hybrids in many species (14, 15). We measured leaf area and determined leaf cell number and cell size at 15 DAS in the C24 × Ler reciprocal hybrids and in the F4 lines. All of the hybrid mimic lines except L1-1 have a leaf area greater than the mid parent value (MPV) at 15 d with P ≤ 0.01 for significance (Fig. 3C), but the L1-1 line increases leaf area in the later stages of growth. All eight hybrid mimic lines have leaf cell numbers greater than the MPV and some of the lines have larger photosynthetic cells (P < 0.05), in particular F4-L3-1 (Fig. 3 D–F). Of the two reciprocal F1 hybrids, the photosynthetic cells are larger in the hybrid with C24 as the maternal parent (Fig. 3E). Both cell number and cell size contribute to the larger leaf area in the hybrid mimic lines but in different proportions in the different lines. In the small plant F4 line (S1-1), the size of the leaf cells is smaller than that of the cells of the parents, but the number of cells in each leaf approximates the number in the parental leaves (Fig. 3 D–F). In the F1 hybrids, the increased number of cells relative to the numbers in parental leaves occurs as early as the cotyledons in the seed before germination (2). In other species, such as maize, hybrids have also been noted to have larger leaves associated with increased cell numbers (14, 15). We scored an increased number of chloroplasts per leaf where the cell size was increased and where there was an increased number of cells (16). Chloroplasts are more frequent in larger cells and the cells have a greater chlorophyll content (17, 18).
Identification of Differentially Expressed Genes in the Hybrids and F4 Plant Lines Relative to the Parents at 15 DAS.
In Arabidopsis hybrids, thousands of genes have altered expression compared with the parents (19), yet the gene activities key to the development of the heterotic phenotype have not been identified. The similarity of morphological growth and development of the hybrid mimics and the F1 hybrids, together with the similarity of cellular properties of the large leaves, suggest that the hybrid and the hybrid mimics increase the size of the vegetative rosette through the same gene activities and metabolic pathways. At 15 DAS, seven of the F4 hybrid mimic lines had an increased rosette size relative to the better parent (BP), and one line, L1-1, had a plant size similar to the parents (Fig. S1A). mRNAs from aerial tissues of 15-d-old seedlings of the two parents C24 and Ler, F1 hybrids, the eight hybrid mimic lines, and the one small plant line were sequenced (Dataset S1, Table S1). Genes with a fold change (FC) ≥ 1.3 and a statistical significance (P ≤ 0.05) relative to MPV were scored as differentially expressed genes (DEGs). The two reciprocal hybrids had 1,097 and 1,886 DEGs, respectively (Dataset S1, Table S2). In the hybrid mimic lines, the numbers of DEGs ranged from ∼1,700 to 4,700 (Dataset S1, Table S2). Activities of some of these shared genes in the hybrids and hybrid mimic lines could be responsible for the increase (or decrease) in the rosette sizes compared with the sizes of parental lines.
Hybrid Mimic Lines Show Gene Expression Profiles Similar to the Hybrids.
In the transcriptome analyses, the hybrid mimic lines were compared with independently grown F1s in two parallel experiments. Although the conditions were highly controlled, the color temperature of the growth light differed somewhat in the two experiments (cool white vs. daylight; both 130–150 μmol photons/m2/s of light and 16-h-long days). This experiment resulted in the reciprocal F1s grown in these two conditions having different proportions of up and down differentially regulated genes (Fig. 4 A and B). In the F1 in Fig. 4A, there are ∼1,000 gene activities plotted, and in Fig. 4B, ∼1,900 genes are plotted in the heat maps of each of the hybrid mimics. Of the 1,000 genes differentially expressed in the C24 × Ler hybrid, ∼55% are not differentially regulated in the hybrid mimics; 31–46% of the F1 genes show a similar direction of altered expression in the hybrid mimics (Fig. 4A and Dataset S1, Table S3). L2-1 and L2-2 have more conservation of down-regulated genes than L1-2. In the reciprocal hybrid (Ler × C24) and the F4 hybrid mimic lines derived from this cross, ∼40% of the F1 DEGs do not differ from the MPV in the F4 lines, and between 37% and 63% of DEGs are shared between the F1 and the F4 lines, with conservation of direction being particularly prominent among up-regulated genes. In each of these lines, fewer than 12% of the DEGs in the F1s are expressed in a direction opposite to the F4 hybrid mimics, whereas in the small plant phenotype (line F4-S1-1), nearly 40% of the F1 differentially regulated genes show an opposite direction of differential regulation (Fig. 4B and Dataset S1, Table S3). Of the eight hybrid mimic lines, the L1-1 line (Fig. S5A) did not have a large phenotype, and we did not use its transcriptome in the 15 DAS comparison. At 28 DAS and at the completion of its life cycle, it had a large phenotype similar to the other hybrid mimic lines (Fig. 3A and Fig. S5 B and C).
Fig. 4.

Hybrid mimic lines showed gene expression profiles similar to the hybrids at 15 DAS. Each data point represents the mean of two biological replicates. (A) Heat maps showing the expression levels of F1 nonadditive genes/differentially expressed genes (DEGs) relative to the MPV in the C24 × Ler F1 hybrids, F4 hybrid mimic lines L1-2, L2-1, and L2-2, and small plant line S1-1. (B) Heat maps showing the expression levels of F1 DEGs in the Ler × C24 F1 hybrids and F4 hybrid mimic lines L3-1, L3-2, L4-1, and L4-2. (C) Heat maps showing the expression levels of F1 DEGs in the Ler × C24 F1 hybrids and two F6 hybrid mimics (L3-1–1-2 and L4-2-1-2). Different red/green colors indicate the up-/down-regulated fold change (FC) from the MPV; the proportion in each gene category is represented as a histogram (Dataset S1, Table S3). Red/green represents up-/down-regulated genes in the F1 hybrids.
Fig. S5.

Hybrid mimic lines showed gene expression profiles similar to the hybrids. Each data point represents the mean of two biological replicates. (A) Heat maps showing the expression levels of F1 nonadditive genes/DEGs relative to the MPV in the Ler × C24 F1 hybrids and F4 plant line L1-1 at 15 DAS. We compared the transcriptomes of largest 10% of plants in the parental lines C24 and Ler against the smallest 10% plants in one planting population (C24 big vs. small, Ler big vs. small); the genes differentially expressed between the two groups do not overlap with the DEGs in the F1 relative to MPV. (B) Heat maps showing the expression levels of F1 nonadditive genes in the C24 × Ler F1 hybrids and four F4 hybrid mimic lines L1-1, L1-2, L2-1, and L2-2 at 28 DAS. (C) Heat maps showing the expression levels of F1 nonadditive genes in the Ler × C24 F1 hybrids and four F4 hybrid mimic lines L3-1, L3-2, L4-1, and L4-2 at 28 DAS. Different red/green colors indicate the up-/down-regulated FC from the MPV; the proportion of genes in each expression category is represented as a histogram (Dataset S1, Table S3). Red/green represents up-/down-regulated genes in the F1 hybrids.
In the two F6 lines, there is strong conservation of the level and direction of genes differentially regulated in the F1 (Fig. 4C and Dataset S1, Table S1). The two F6 lines show ∼60% of the F1 DEGs having MPV in each of the two F6 lines, and 35% of the F1 DEGs show the same differential activity direction in the F6 lines (Dataset S1, Table S3). A comparison of the F6 lines to the hybrid mimic lines in the F4 shows the number of conserved shared gene activities has been reduced but fewer than 10% of the F1 DEGs show an opposite regulation pattern in the F6 lines (Fig. 4C and Dataset S1, Table S3). Two hundred thirty-eight loci have common patterns of differential expression in the two F6 lines and the F1 hybrid (Fig. S6). These data suggest that there is a high concentration of “F1-like phenotype genes” in the F6 plants.
Fig. S6.

Shared differentially expressed genes between two F6 hybrid mimics and the F1 hybrid at 15 DAS. (A) Venn diagram with numbers of overlapping and nonoverlapping differentially expressed genes in a comparison of two F6 hybrid mimic lines and F1 hybrids. (B) GO enrichment for shared differentially expressed genes between two F6 hybrid mimics and F1 hybrid. *Major GO term that is enriched compared with background.
Genes and Metabolic Pathways Important in the F1 Hybrid Phenotype Are Present in the Hybrid Mimics.
The differentially expressed genes common to F1 hybrids and F4 hybrid mimic lines are likely to be associated with the large plant phenotype.
Some of the cohort of these genes had similar altered expression levels in the F4 small plant line, and these were removed from the analysis. There were many loci that had opposing expression levels or were unaltered in expression in the small line relative to the levels in the large mimic lines. We focused on genes that, compared with the MPV, were nonadditively/differentially expressed in both the F1 hybrid and at least three of the F4 hybrid mimic lines. This method resulted in 257 genes being candidate loci contributing to hybrid vigor (Dataset S1, Table S4). Seventy-two of the 257 genes are also present in the 238 loci, which have common patterns of differential expression in the F6 lines and the F1 hybrids (Fig. S6A). GO analysis placed the 257 genes in a number of metabolic pathways (Fig. 5A and Dataset S1, Table S5), of which the most enriched gene ontology (GO) terms were metabolic process and response to stimulus. Genes other than the 72 loci common to both F6 lines and present in these GO terms may also play roles in the generation of the heterotic phenotype.
Fig. 5.

GO identified pathways/genes that contribute to the large phenotype at 15 DAS. (A) Summary of significant GO terms in the 257 genes similarly differentially expressed in F1 hybrids and three or more hybrid mimic lines, but not sharing the expression pattern with the small plant line (Dataset S1, Table S5). (B) Examples of genes in each pathway. Different red/green colors indicate the fold change (up/down) from the MPV. ABA, abscisic acid; JA, jasmonic acid; SA, salicylic acid.
In the category of metabolic process, three groups of genes associated with flavonoid biosynthetic process, indole derivative metabolic process, and sulfur metabolic process were overrepresented (Fig. 5A and Dataset S1, Table S5). The down-regulation of the flavonoid biosynthetic pathway in the C24/Ler hybrids has been previously reported (19). A number of genes in this pathway including FLAVANONE 3-HYDROXYLASE (F3H), FLAVONOL SYNTHASE 1 (FLS1), and CHALCONE SYNTHASE (CHS) were down-regulated in the F1 hybrids and in at least three F4 hybrid mimic lines, and most were up-regulated in the small plant line (Fig. 5B and Dataset S1, Table S4).
In the category of response to stimulus, 57 genes were assigned to the response to stress term, with 21 of these annotated to the subset GO term defense response (Dataset S1, Table S5). FLAVIN-DEPENDENT MONOOXYGENASE1 (FMO1) functions as a gene activity modulator during activation of systemic acquired resistance to disease (20). This gene is down-regulated in the F1 hybrids and five of the F4 hybrid mimic lines but is expressed at MPV in the small plant line (Fig. 5B). WRKY proteins are essential regulators in plant immune responses (20, 21). WRKY38 and WRKY60 are up-regulated during plant defense activation, whereas WRKY 33, encoding a negative regulator of the defense response, is down-regulated (21–23). In the F1 hybrid and hybrid mimic lines, WRKY38 and WRKY60 were down-regulated, whereas WRKY33 was up-regulated (Fig. 5B), suggesting that the hybrid and the hybrid mimic lines have a low basal expression of these defense response genes. Consistent with this suggestion, downstream target genes of these regulators, including a number of pathogen responsive markers such as PATHOGENESIS-RELATED GENE 1 (PR1) and PR5 (24, 25), were down-regulated in the F1 hybrids and F4 hybrid mimic lines (Fig. 5B). In the majority of cases, the F4 small plant showed MPV or up-regulation of these genes (Fig. 5B and Dataset S1, Table S4), suggesting that the small plant line has higher basal expression levels of the defense response genes. These observations support the suggestion that there is a negative relationship between vegetative growth and defense activation (26, 27), with the down-regulated defense-related gene activities associated with greater growth of the hybrids and hybrid mimic plants.
The gene encoding C-REPEAT/DRE BINDING FACTOR 1 (CBF1), a regulator of the cold acclimation response (28), and its target genes COLD-REGULATED 47 (COR47) and LOW-TEMPERATURE-INDUCED 78 (LTI78) (29), were up-regulated in the hybrids and most hybrid mimic lines but down-regulated or unaffected in the small plant line (Fig. 5B and Dataset S1, Table S4). RESPONSE TO DROUGHT 29A (RD29A) and EARLY-RESPONSIVE TO DEHYDRATION 7 (ERD7), which can be induced by cold, salt, or drought stress (30, 31), had up-regulated gene activities in the hybrids and most hybrid mimic lines and were down-regulated or unaffected in the small plant line (Fig. 5B and Dataset S1, Table S4). Plant hormones are important in a range of developmental processes. A number of genes associated with defense response and response to abiotic stress were also assigned to the gene category response to hormone (Fig. 5 and Dataset S1, Table S5). The changed hormone pathways were the jasmonic acid (JA), salicylic acid (SA), and abscisic acid (ABA) pathways. ABA is associated with the up-regulated abiotic stress response genes in both hybrids and hybrid mimic lines. Jasmonic acid, salicylic acid, and ethylene are the main phytohormones involved in defense responses and have complex cross-talk with the ABA network (32–35).
Genes in the pathways response to carbohydrate stimulus, response to oxidative stress, and response to nutrient levels indicated these pathways could also be involved in the generation of the large plant phenotype (Fig. 5 and Dataset S1, Table S5).
In the class cellular component, the functional category cell wall was one term represented by a number of these genes (Dataset S1, Table S5). This result could link the down-regulated defense response in the hybrids and hybrid mimic lines to cell wall remodeling, a component of plant growth (20).
The transcriptome analysis of leaf tissue from 28-d-old parents, F1 hybrids and the eight hybrid mimic plant lines showed the defense response pathways were down-regulated in the F1 hybrid and hybrid mimic lines as they were in the 15 DAS transcriptomes. The alterations in the pathways were conserved over both developmental stages (Fig. S5 B and C and Dataset S1, Table S6). Changes in the transcriptomes of the hybrids relative to the parents occur earlier than 15 DAS. For example, we showed that alterations in the transcription levels of photosynthesis-associated and chloroplast-targeted loci occur in the first few days of seedling development (16). It will be important to have detailed analyses of hybrid mimics in the first few days of seedling growth.
GO analysis of the transcriptomes of the hybrid mimic lines established that, through a recurrent selection process based on plant size, we selected for the retention of a number of F1 hybrid metabolic pathway expression profiles. Our data emphasize that down-regulated defense response and up-regulated abiotic stress response pathways are likely to be contributing to the generation of the biomass large phenotype.
Chromosome Segmental Sequence Homozygosity in F6 Plants.
The uniformity of the progeny plants in the F6 lines suggests that genomic segments important for the hybrid mimic phenotype have been fixed in the population of F6 plants. SNP analysis of the transcriptome reads of three F6 siblings of each of the two F6 lines showed the genomes of two sibling F6-L3-1-1-2 plants were homozygous for long chromosomal segments of either the C24 genome or the Ler genome and had no heterozygous segregating segments (Fig. 6 and Dataset S1, Table S7). The third sibling, while mainly homozygous, had a low level of heterozygosity (3%) toward the end of chromosome 3. This region was homozygous C24 in sibling 1, homozygous Ler in sibling 2, and heterozygous in sibling 3, showing that this segment must have been heterozygous in the parental F5 plant. In these three siblings, 98% of genes were fixed with only 2% having alleles continuing to segregate (Fig. S7A).
Fig. 6.

Genotypes of chromosomal segments of F6 lines. (A) Pie charts showing genotypes of each F6 sibling plant. Three sibling plants (Sib.) are from F6-L3-1-1-2 and three sibling plants are from F6-L4-2-1-2. (B) Representations of genotype along each of the five Arabidopsis chromosomes. Each line along the chromosomes represents an SNP. The red/blue/green bars represent the genotypes C24 homozygous, Ler homozygous, and C24/Ler heterozygous (Heter.).
Fig. S7.

Parent of origin analysis of gene expression in the F6 generation. (A) Genotypes of F6-L3-1-1-2 and F6-L4-2-1-2 showing genes that are fixed for one genotype and genes that are either fixed as different genotypes between siblings or still undergoing segregation. The third pie chart shows genotypes of genes that are the same or different between F6 lines. (B) Venn diagram of genes with an expression pattern different from the parental genotype (transregulated genes). (C) Transregulated genes were split into six different classes of expression based on whether the two F6 lines had the same or different genomes and whether they both changed in expression compared with parental genotypes. Table demonstrating how often altered expression is found in both lines or in one line (n = 2396). (D) Examples of genes under transregulation and not matching parental expression levels. *Genes that are expressed differentially in the F6 lines compared with parental genotype expression (P < 0.05). The red/blue/green bars represent the genotypes C24 homozygous, Ler homozygous, and C24/Ler heterozygous (Heter.). The values for the parental lines and F1 hybrid are the mean of read counts from two biological replicates; the values for the F6 lines are the mean of three siblings. Error bars = SEM.
The F6 line L4-2-1-2 had between 7% and 20% of the sibling genomes heterozygous on chromosomes 1 and 2 (Fig. 6). The three siblings had near identical heterozygous segments in the right arm of chromosome 2. Fifty percent of the chromosomal segments of the genome were homozygous for Ler sequences, with the remaining segments being heterozygous or homozygous for C24 sequences (Fig. 6B). These latter segments may not contain genes important for the uniform hybrid mimic phenotype of the L4-2-1-2 line. Fifty-four percent of genes have the same genotype in the two F6 lines and potentially contain the same combination of alleles required for the hybrid mimic phenotype (Fig. S7A).
The SNP genotyping has demonstrated that the F6 lines are mostly homozygous for one or the other parent allele. The homozygous state of both F6 lines explains why the number of DEGs in the F4 and F6 lines exceed the number of DEGs in the F1 hybrid. An expression analysis comparing loci in the F6 lines to the parent of origin (C24, Ler, or MPV for heterozygous regions) aimed to identify how many genes showed evidence of transregulation. Genes that had an expression pattern that did not match the expression pattern of the genes in the parent were classified as being transregulated; 1,780 genes in F6-L3-1-1-2 and 1,448 genes in F6-L4-2-1-2 were differentially expressed compared with the same genotype in the parents. Eight hundred thirty-two genes were in both F6 lines, leaving 2,396 genes that undergo transregulation in the genome (Fig. S7B).
Examples of the genes that undergo transregulation include At4g15210, At2g45660, and At4g30610 (Fig. 7 and Fig. S7 C and D). At4g15210 retained the low expression levels of the F1 hybrids in both F6 lines even though they were homozygous for the highly expressed Ler allele (Fig. 7A). At2g45660 had different parental alleles in the two F6 lines, but both maintained the low expression level observed in the F1 hybrids (Fig. 7B). At At4g30610, only one F6 line had an altered expression level, resulting in a similar expression level in the two F6 lines (Fig. 7C). These results demonstrate that the hybrid mimic lines have gene expression patterns that are not solely dependent on the allelic combination at the locus.
Fig. 7.
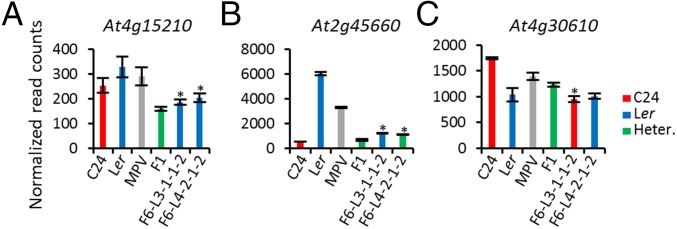
Examples of genes under transregulation and not matching parental expression levels. (A) At4g15210. (B) At2g45660. (C) At4g30610. *Genes that are expressed differentially in the F6 lines compared with parental genotype expression (P < 0.05). The red/blue/green bars represent the genotypes C24 homozygous, Ler homozygous, and C24/Ler heterozygous (Heter.). The values for the parental lines and F1 hybrid are the mean of read counts from two biological replicates; the values for the F6 lines are the mean of three siblings. Error bars = SEM.
Among the transactivated genes of the F6-L3-1-1-2 line, the genes in GO terms signaling, multiorganism process, immune system process, and response to stimulus were enriched (Dataset S1, Table S8). In F6-L4-2-1-2, among the transregulated gene activities, the GO terms multiorganism process and response to stimulus were enriched (Dataset S1, Table S9). The GO term response to stimulus was enriched for transregulated genes in both lines (Dataset S1, Table S10), including genes in defense response and response to hormone stimulus (JA, SA, ABA, or auxin). These same pathways are consistently differentially expressed in the F1 hybrid. The altered expression of these genes in the F1 hybrid and the transregulated genes of the F6 lines identifies them as genes that have been regulated by epistatic interactions between loci or by epigenetic reprogramming as a consequence of both parental genomes and epigenomes coming together in the one nucleus.
TCM/TCdM-Derived mC Patterns Generated in the F1 Hybrids Are Maintained in the F4.
Epigenetic controls can affect gene activities in hybrids (6). We described the processes of trans-chromosomal methylation (TCM) and trans-chromosomal demethylation (TCdM), which take place in hybrids and result in one allele gaining the methylation pattern of the other, altering gene expression patterns (4). The new methylation pattern can be inherited unchanged to the F2 generation (7). To determine whether a subset of the transregulated genes in the F6 plants could have resulted from altered epigenetic regulation, we checked whether genes known to be altered in epigenetic mutants (36, 37) were included in our list of transregulated genes (SI Materials and Methods). We found that the transregulated gene list was ∼2.4-fold enriched for genes altered in epigenetic mutants compared with random sampling from the background list (P < 0.0001; χ2 test). This finding supports the possibility that the changed hybrid mimic pattern of expression includes a subset of genes that have inherited F1 TCM/TCdM-mediated methylation patterns into the F4 and F6 lines. At At5g26345 and At3g43340/50, the TCM-mediated methylation state of the F1 was inherited into the F4 populations (7) (Fig. 8 A and B and Fig. S8 A and B). In four of the hybrid mimic lines for At5g26345 and two of the hybrid mimic lines for At3g43340/50, all carrying the genotype of the unmethylated parent at the locus, expression patterns differed from the parental levels and matched the F1 (Fig. 8 A and B and Fig. S8 A and B). At another locus where TCM occurred in the F1 hybrid, At5g27345, six hybrid mimic lines maintained their high methylation pattern together with a low level of gene expression; two lines showed reduced methylation and high expression (Fig. 8C and Fig. S8C). The differences in methylation in the F4 lines illustrate how epigenetic variability can lead to unique expression profiles (i.e., At5g27345) between different selected lines even though they were derived from the same parental chromosomal segment. The data for these TCM-altered methylation states and their altered expression pattern showed the epigenetic induced methylation changes to be stable and maintained through the recurrent selection regime to operate in the F6.
Fig. 8.

F1 TCM/TCdM-derived mC patterns inherited to the F4 affect gene expression in the hybrid mimic lines. The mC and mRNA levels of parents, F1 hybrids, and F4 hybrid mimic lines at At3g43340 and At3g43350 (A), At5g26345 (B), and At5g27345 (C) at 28DAS. Data from 15 DAS are shown in Fig. S8. The mC levels were determined by quantitative RT-PCR (qRT-PCR) after McrBC digestion. The transcriptome data for each gene are represented by normalized reads. Black dotted line represents MPV. Error bars = SEM. The red/blue/green bars represent the genotypes C24 homozygous, Ler homozygous, and C24/Ler heterozygous. The mC levels are derived from two technical replicates. The transcriptome data are derived from two biological replicates.
Fig. S8.

F1 TCM/TCdM-derived mC patterns inherited to the F4 affect gene expression in the hybrid mimic lines. The mC and mRNA levels of parents, F1 hybrids, and F4 hybrid mimic lines at At3g43340 and At3g43350 (A), At5g26345 (B), and At5g27345 (C) at 15 DAS. The mC levels were determined by qRT-PCR after McrBC digestion. The transcriptome data for each gene are represented by normalized reads. Black dotted line represents MPV. Error bars = SEM. The red/blue/green bars represent the genotypes C24 homozygous, Ler homozygous, and C24/Ler heterozygous (Heter.). The mC levels are derived from two technical replicates. The transcriptome data are derived from two biological replicates.
SI Materials and Methods
Plant Materials.
Seeds were sterilized and sown onto plates containing MSNoble (MSN) medium [MS salts supplemented with 1% (wt/vol) sucrose, pH 7, with KOH, 0.6% (wt/vol) Noble agar]. After 2 d at 4 °C, the plates were transferred to a growth room with conditions of 22 °C/18 °C (day/night) and 16-h light/8-h dark cycle under Philips Cool Daylight TLD 58W/840 fluorescent tubes providing a photosynthetic photon flux density of 130–150 μmol photons/m2/s as measured using a quantum meter (Model MQ-200 calibrated for electric light source; Apogee). At 18 DAS, the plants were transferred to soil and grown to the reproductive stage in a growth room with controlled light conditions (OSRAM L 36W/865 LumLux Daylight, 130–150 μmol photons/m2/s). To minimize the edge effects, the positioning of both plates and trays on the shelves was rotated every 2 d. All of the plants were grown under the condition described above unless specified.
Rosette Diameter Measurement.
Plants on plates or in soil were photographed together with a scale and rosette diameters measured using ImageJ software (National Institutes of Health). In cases where adjacent plant rosettes overlapped, hand measurements were carried out on all plants in one experiment, and all measurements were completed within 1 d.
Recurrent Selection for Hybrid Mimics.
Fifty selfed seeds (F2) of each reciprocal hybrid were sown on plates. The parents C24 (n = 8) and Ler (n = 16) and the reciprocal hybrids (C24 × Ler F1: n = 12, Ler × C24 F1: n = 16) were sown as controls. Seeds with a germination time later than parental lines were eliminated from the selection process due to possible effects on plant size. Photographs of all plants were taken at 10, 15, 18, 22, 25, 28, 31, 35, and 39 DAS for the measurement of rosette diameters. The growth and developmental status were recorded every 2 d, and the flowering time was defined as the day when inflorescence primordia became visible (IPV). Plants were selected based on a rosette diameter close to the F1 hybrid and a flowering time within the range of the two parents. In total, we selected six large F2 plants, named large 1 to large 6 (L1 to L6), and five small F2 plants named small 1 to small 5 (S1 to S5). The F3 seeds from each selected F2 plant were harvested separately as different plant lines.
In the selection of the F3 generation, 50 F3 plants from each line were grown for selection; the recurrent selection process was performed with the largest/smallest plants again selected based on the criteria of flowering time and rosette diameter. The same selection processes were performed in the F4 and in the subsequent generations. Some plant lines failed the selection due to their unsatisfactory phenotype of plant size or late flowering time compared with the parental lines.
Cell Size and Number.
Fresh leaf tissue was harvested and fixed in methanol for 24 h, cleared in chloral hydrate solution (4 g Chl: 2 mL dH2O: 1 mL glycerol) until transparent, and then mounted in 50% (vol/vol) glycerol on microscope slides for visualization. The images of each leaf were taken under a Leica MZFLIII dissector microscope, and leaf area was determined by ImageJ software. All samples used a similar region of the leaves for observation of palisade mesophyll cells, under a Zeiss Axioimager upright motorized microscope using DIC optics. Images were captured at ×20 or ×40 magnification. Cell number per unit area was counted using ImageJ for determining average cell size. The number of palisade mesophyll cells of each leaf was calculated using leaf area divided by the average cell size. The palisade cells of leaf 1 or 2 were collected from the parents (n = 20), F1 hybrids (n = 20), and F4 large plant lines (L) (n = 20) at 15 DAS and analyzed microscopically. One small F4 plant line F4-S1-1 was examined (n = 10).
Plant Sample Preparation and RNA Extraction.
For the transcriptomes of 15 DAS plants, the aerial tissues of 15-d seedlings were sampled. For the transcriptomes of plants at 28 DAS, the four largest leaves of 28-d plants from the parental lines (C24, Ler), the reciprocal hybrids, and eight F4 hybrid mimic lines were harvested. Each sample comprised a pool of five plants. Two biological replicates of each sample were sequenced. Total RNA was isolated using QIAGEN RNeasy MiniKitTM following the product instructions. To eliminate variation in experimental conditions in different positions in the growth room, nine F4 plant lines were divided into two batches to ensure plants were grown on the same shelves in each experiment. Parental lines C24 and Ler and the F1 hybrid from which the F4 lines derived from were grown under the same conditions in each experiment as controls. The first batch including samples C24 (RepA and RepB), Ler (RepA and RepB), C24 × Ler F1, F4-L1-1, F4-L1-2, F4-L2-1, F4-L2-2, and F4-S-1 were grown under the condition describe above, and we also sampled the five smallest C24 seedlings and five smallest Ler seedlings among the population (n = 50); the mRNA sequencing was performed by the Australian Genome Research Facility (AGRF). The second batch including C24 (RepC and RepD), Ler (RepC and RepD), Ler × C24 F1 hybrid, F4-L3-1, F4-L3-2, F4-L4-1, and F4-L4-2 were grown in the same light intensity as above but under different light tubes (SYLVANIA PREMIUM extra FL36W/865 Super Daylight deluxe light tube).
For the transcriptome of the two F6 hybrid mimic lines at 15 DAS, C24, Ler, Ler × C24 F1 hybrids, and three siblings from each F6 line (L3-1-1-2 and L4-2-1-2) were grown on MS medium [MS salts supplemented with 1% (wt/vol) sucrose, pH 5.7 with KOH, add 0.6% (wt/vol) agar] with controlled light conditions (SYLVANIA PREMIUM extra FL36W/865 Super Daylight deluxe, 130–150 μmol photons/m2/s). The mRNA sequencing service was provided by AGRF on the Illumina platform, with 100-bp paired ends.
Transcriptome Analysis.
The quality of sequencing of each sample was examined using the FastQC program (www.bioinformatics.babraham.ac.uk/projects/fastqc/). Samples were trimmed depending on the overall sample quality. Fifteen DAS samples were processed without trimming; 28 DAS samples were trimmed equally by removing 5 bp from the 5′ end and 45 bp from the 3′ end from each read. Mapping was performed using Biokanga (sourceforge.net/projects/biokanga/) against the TAIR10 reference genome: 10% mismatch of input reads was allowed. More than 70% of reads could be uniquely mapped to exons. The mapped counts were normalized according to the library size across all of the samples in each dataset (bioconductor.org/packages/2.13/bioc/html/DESeq.html). The DEseq method was used for statistical tests under an R environment; a P value was generated using the “fit-only” option in the DEseq scheme. A filter of minimum reads = 100 of each gene across all of the samples was applied to the normalized reads. The differentially expressed genes in each sample were compared against the MPV of the parental lines C24 and Ler within the same experimental batch. A threshold of P ≤ 0.05 and fold change (FC) ≥ ±1.3 was applied for identification of the differentially expressed genes.
GO Analysis.
AgriGO (bioinfo.cau.edu.cn/agriGO/) (42) was used for GO of differentially expressed genes in each input list. Genes with reads ≥100 at least in one sample were considered expressed genes and used as the background gene list in an experiment criteria of P ≤ 0.05 (Fisher’s test); Benjamini–Yekutieli false discovery rate (FDR) (43) < 0.05 and minimum number of mapping entries = 5 were applied for identification of the significant GO terms.
McrBC-Digest and Real-Time PCR.
DNA of C24, Ler, C24 × Ler, Ler × C24, and eight F4 large plant lines was extracted from the plant samples used for the transcriptome. McrBC-digest and real-time PCR were performed as described previously (7). Genotypes of each F4 line at AT3G43340/50 were identified using allele specific primers. The genotypes of each F4 line at AT5G26345 and AT5G27345 were identified by using allele-specific SNPs. Primer sequences for McrBC qRT-PCR and genotype identification are provided in Dataset S1, Table S11.
SNP Analysis.
To carry out a SNP analysis on the F6 plants, we first downloaded the C24 and Ler TAIR9 SNP lists from the 1001 genome project (1001genomes.org/). These lists were then used to produce a file containing all positions where a SNP was present in C24 or Ler compared with the Columbia reference genome (749,103 positions). From this list, SNPs were removed if C24 and Ler had identical bases, resulting in a list of 567,695 SNP positions. The F6 .sam files produced from biokanga v2.95.0 were then converted to .bam files using samtools v0.1.19. These .bam files were then sorted, and duplicate reads were removed using samtools. The .bam files, Columbia TAIR10 .fasta files, and list of SNP positions were used in the samtools mpileup function using the –l option. The accompanied bcftools view function with options –A, –g, –c was used to create a .vcf file. The vcf-query perl script that accompanies vcftools was then used to produce the final output file. Microsoft Excel was used for final data manipulation. The resulting SNPs were filtered by requiring at least three read coverage, removing SNPs called C24 in Ler samples and removing SNPs called Ler in C24 samples. Due to monoallelic expression from the transcriptome data potentially affecting genotype calling, we also removed any SNP not called heterozygous in the F1 resulting in ∼70,000 SNPs used to determine a sample’s genotype. Pie charts and chromosome genotype maps were produced using Microsoft Excel.
Parent-of-Origin Analysis.
The SNP analysis was used to define the genotypes for each gene. Genes that did not have a genotype called in one or more of the siblings were excluded from the analysis, leaving 32,994 and 32,970 genes analyzed in F6-L3-1-1-2 and F6-L4-2-1-2, respectively. These genes were used to determine the percentage of genes fixed in the population vs. genes fixed in different genotypes or still under segregation between siblings.
For determining genes that were differentially expressed compared with the parental genotype (transregulated genes), we filtered the gene list to leave only genes that had no missing genotype calls in all six F6 individuals, a fixed genotype for each line, and had at least one sample with ≥100 reads. This filter left 19,367 genes that were used to examine transregulation events. As genomes were fixed in each of these genes, the three siblings from each line were used as biological replicates. Transregulated genes were called when expression levels were ≥±1.3-fold and had a P ≤ 0.05 compared with parental genome expression level. When determining whether transregulated genes showed the same change in expression in both lines, one had to be significant (≥±1.3-fold and P ≤ 0.05), whereas the other line had to show the same trend in expression (≥±1.15-fold). The Venn diagram of shared transregulated genes between the two F6 lines was produced using venny (bioinfogp.cnb.csic.es/tools/venny/).
Epigenetic Enrichment Analysis.
Genes with an altered expression in epigenetic mutants were taken from Kurihara et al. (36) and Lister et al. (37). Only nuclear genes were used, resulting in an epigenetic list of 1,610 genes known to change expression in Columbia mutants of rdd, ddc, rdr2, and met1. A custom R script was used to generate 50 random lists of genes from our 19,367 genes used to examine parent of origin. These random lists were then overlapped against the epigenetic regulated gene list (×50) to give us an average number of genes expected to overlap. We then established the number of genes from our transregulated gene list that overlapped with the epigenetic lists. These numbers along with the random expected numbers were then used in a χ2 test to look for enrichment.
Discussion
F1 hybrids can achieve significant increases in both vegetative and reproductive yields relative to their parents and are of great importance in agriculture and horticulture. There is a lack of understanding of the biological mechanisms by which these properties are achieved, and additionally, why the heterosis applies only to the first-generation hybrid and decays in the F2 and subsequent generations. There have been a number of hypotheses around the possible mechanisms of gene action involved in the generation of hybrid vigor—dominance, overdominance, and epistasis of the gene units—but there has been no comprehensive understanding as to the means by which the patterns of gene activity unique to the hybrid are achieved. Analyses of QTLs in maize and rice emphasize that hybrid vigor is a consequence of multigenic contributions (38, 39).
We were able to generate stable pure breeding lines with the properties of the F1 hybrids, and these hybrid mimics enabled us to shed light on the principal components of heterosis generation in Arabidopsis. The gene activity profiles of these hybrid mimics, in comparison with the gene activities of the F1, defined which genes and metabolic pathways are of prime importance. There are also morphological and anatomical features common to both the F1 hybrids and the hybrid mimics. In the C24/Ler hybrids and the hybrid mimics that have large vegetative rosettes, the leaves are much greater in size than the leaves of the parental lines. These morphological features of the hybrid and hybrid mimics have a common basis of increased cell number, and in some cases, increased size of leaf cells. The increased number and size of the photosynthetic cells result in larger numbers of chloroplasts per leaf that produce more photosynthate than the parental lines (17, 18). The increased sugar and starches provide the raw building materials for the increased size of the vegetative plants (17, 18).
In the case of the Arabidopsis hybrids, as in hybrids in other plant species such as maize and rice, the F1 hybrid has patterns of gene activity different to those found in the parents (38, 39). The presumption is that these altered patterns of gene activity generate the heterotic phenotype. A comparison of the gene activity patterns of the hybrid mimics with those of the F1 have highlighted key parallel properties. The major pathways prominent in the transcriptomes in both the F1 hybrid and the hybrid mimics are defense response pathways and abiotic response pathways. Other important parallels occur in certain hormone response metabolic pathways. The common property of genes involved in a number of the defense response pathways was their down-regulation relative to midparental values. This property fits with proposals that there is antagonism between defense response pathways and growth pathways (26, 27). This counterbalancing of energy-consuming gene activities and growth is emphasized by the finding that, in small plant phenotypes, there are gene activity profiles opposite to those of the large hybrid mimics, where a number of defense response genes are up-regulated and the vegetative size of the plants is reduced.
The transcriptome analysis of the F1 hybrid showed there are ∼1,000–2,000 genes differentially expressed relative to the MPVs of expression; these gene activities could be of significance in the generation of the heterotic phenotype in the F1. Both F6 hybrid mimic lines analyzed have differential expression of 238 genes in common with the differentially expressed genes in the F1, suggesting they are putative hybrid vigor generating gene activities. In the two independently derived F6 lines, there was not complete commonality of differentially expressed genes, suggesting that there are some different pathways of gene activities that generate the F1-like phenotype; for example, one F6 line featured both increased size and number of photosynthetic cells in its large leaves, whereas the second F6 line had only increased cell numbers. Both plants produced hybrid mimics with an F1-like phenotype.
The fact that there may be a relatively small number of genes in the genome that are key to the production of the F1-like phenotype still presents a problem as to the way in which the genes are retained in the recurrent selection process. The fact that Arabidopsis has only five chromosomes and a low recombination frequency per meiotic bivalent is likely to be of considerable consequence in this puzzle (40); the number of independently segregating chromosome segments at meiosis approximates to the number of chromosome arms as defined by the single cross-over event per chromosome pair. This low number of meiotic segregating chromosome segments is compatible with cosegregation of large numbers of genes. If there are only a small number of key loci responding to the phenotypic selection pressure in the production of the next generation, many other loci would cosegregate.
SNP analysis showed that large parental segments were homozygous. The expression levels of many of the genes were different from their level in their parental genotype. These changed levels of gene activity in the hybrid probably underlie the generation of the hybrid vigor phenotype. The question arises as to how the different expression levels are achieved. We have only limited data, but we have been able to show that some genes that have altered epigenetic marks in the F1, giving them a particular level of gene expression, maintain that level of gene expression in the hybrid mimic plants.
The different levels of expression of these genes in the hybrid may result from epigenetic interactions. In such cases, the success of translating the hybrid mimic system to a crop species will be dependent on the long-term stability of the altered epigenetic state. The analysis of epigenetic recombinant inbred lines (epiRiLs) has demonstrated that the methylation states initiated by the epigenetic interactions between WT and the ddm1-2 mutant in their progeny can be stably transmitted through multiple generations and impact traits such as flowering time and primary root length (41).
Additionally, activity of the genes is likely to be subject to interactions between loci resulting from the presence of the two genomes in the hybrid nucleus. In the hybrid mimics, there are homozygous segments from both parental genomes that may be responsible for the gene interactions and transregulation of many loci.
Our results, together with the earlier reports of fixation of hybrid vigor traits through recurrent selection programs in a number of different crop species (10–12), support the possibility that hybrid mimics could provide an alternative to F1 hybrid systems in a range of agricultural and horticultural crops. Hybrid mimics may provide a valuable adjunct system to F1 hybrids in crops where there are already hybrid seed production systems operating but may be of particular value in crops where there are no mechanisms available for the commercial production of hybrid seeds.
Materials and Methods
Arabidopsis thaliana accessions C24 and Landsberg erecta (Ler) were used as parental lines. Reciprocal C24 × Ler hybrids were generated by hand pollination. All of the plants in one experiments were grown under the same conditions with rotation of samples. Rosette diameter of each plant was measured by Image J software (National Institutes of Health) or by hand. Recurrent selection for hybrid mimics/small plant lines was based on rosette diameter of plants that had a flowering time within the range of the two parents. For transcriptomes, total RNA was isolated using QIAGEN RNeasy MiniKitTM following the product instructions. Deep sequencing was performed on the Illumina platform. Raw reads were mapped against the TAIR10 reference genome using Biokanga (sourceforge.net/projects/biokanga/). Raw and processed mapped RNA sequences are deposited in GEO (accession no. GSE64743). The DEseq method was used for statistical tests under an R environment. A threshold of P ≤ 0.05 and fold change (FC) ≥ ±1.3 was applied for identification of the differentially expressed genes. GO analysis was performed using AgriGO (bioinfo.cau.edu.cn/agriGO/) (42) platform. SNP analysis of the transcriptome reads of F6 plants was used to define the allelic composition for each gene. See SI Materials and Methods for further details.
Supplementary Material
Acknowledgments
We thank Aihua Wang, Bjorg Sherman, and Lillian Crombie for technical support and help; Mark Talbot and Rosemary White for microscopy help; and Jen Taylor for bioinformatics advice. This work was supported by the Science and Industry Endowment Fund of the Australian Government.
Footnotes
The authors declare no conflict of interest.
Data deposition: The data reported in this paper have been deposited in the Gene Expression Omnibus (GEO) database, www.ncbi.nlm.nih.gov/geo (accession no. GSE64743).
This article contains supporting information online at www.pnas.org/lookup/suppl/doi:10.1073/pnas.1514190112/-/DCSupplemental.
References
- 1.Schneeberger K, et al. Reference-guided assembly of four diverse Arabidopsis thaliana genomes. Proc Natl Acad Sci USA. 2011;108(25):10249–10254. doi: 10.1073/pnas.1107739108. [DOI] [PMC free article] [PubMed] [Google Scholar]
- 2.Meyer RC, Törjék O, Becher M, Altmann T. Heterosis of biomass production in Arabidopsis. Establishment during early development. Plant Physiol. 2004;134(4):1813–1823. doi: 10.1104/pp.103.033001. [DOI] [PMC free article] [PubMed] [Google Scholar]
- 3.East EM. Heterosis. Genetics. 1936;21(4):375–397. doi: 10.1093/genetics/21.4.375. [DOI] [PMC free article] [PubMed] [Google Scholar]
- 4.Greaves IK, et al. Trans chromosomal methylation in Arabidopsis hybrids. Proc Natl Acad Sci USA. 2012;109(9):3570–3575. doi: 10.1073/pnas.1201043109. [DOI] [PMC free article] [PubMed] [Google Scholar]
- 5.Groszmann M, et al. Changes in 24-nt siRNA levels in Arabidopsis hybrids suggest an epigenetic contribution to hybrid vigor. Proc Natl Acad Sci USA. 2011;108(6):2617–2622. doi: 10.1073/pnas.1019217108. [DOI] [PMC free article] [PubMed] [Google Scholar]
- 6.Greaves IK, et al. Epigenetic changes in hybrids. Plant Physiol. 2015 doi: 10.1104/pp.15.00231. [DOI] [PMC free article] [PubMed] [Google Scholar]
- 7.Greaves IK, Groszmann M, Wang A, Peacock WJ, Dennis ES. Inheritance of Trans Chromosomal Methylation patterns from Arabidopsis F1 hybrids. Proc Natl Acad Sci USA. 2014;111(5):2017–2022. doi: 10.1073/pnas.1323656111. [DOI] [PMC free article] [PubMed] [Google Scholar]
- 8.Chae E, et al. Species-wide genetic incompatibility analysis identifies immune genes as hot spots of deleterious epistasis. Cell. 2014;159(6):1341–1351. doi: 10.1016/j.cell.2014.10.049. [DOI] [PMC free article] [PubMed] [Google Scholar]
- 9.Schnable PS, Springer NM. Progress toward understanding heterosis in crop plants. Annu Rev Plant Biol. 2013;64:71–88. doi: 10.1146/annurev-arplant-042110-103827. [DOI] [PubMed] [Google Scholar]
- 10.Williams W. The isolation of ‘pure lines’ from F1 hybrids of tomato and the problem of heterosis in inbreeding crop species. J Agric Sci. 1959;53(3):347–353. [Google Scholar]
- 11.Busch RH, Lucken KA, Frohberg RC. F1 hybrids versus random F5 line performance and estimates of genetic effects in spring wheat. Crop Sci. 1971;11(3):357–361. [Google Scholar]
- 12.Sarawat P, Stoddard FL, Marshall DR. Derivation of superior F5 lines from heterotic hybrids in pea. Euphytica. 1994;73(3):265–272. [Google Scholar]
- 13.Groszmann M, et al. Intraspecific Arabidopsis hybrids show different patterns of heterosis despite the close relatedness of the parental genomes. Plant Physiol. 2014;166(1):265–280. doi: 10.1104/pp.114.243998. [DOI] [PMC free article] [PubMed] [Google Scholar]
- 14.Pavlikova E, Rood SB. Cellular basis of heterosis for leaf-area in maize. Can J Plant Sci. 1987;67(1):99–104. [Google Scholar]
- 15.Li C, et al. Ectopic expression of a maize hybrid down-regulated gene ZmARF25 decreases organ size by affecting cellular proliferation in Arabidopsis. PLoS One. 2014;9(4):e94830. doi: 10.1371/journal.pone.0094830. [DOI] [PMC free article] [PubMed] [Google Scholar] [Retracted]
- 16.Fujimoto R, Taylor JM, Shirasawa S, Peacock WJ, Dennis ES. Heterosis of Arabidopsis hybrids between C24 and Col is associated with increased photosynthesis capacity. Proc Natl Acad Sci USA. 2012;109(18):7109–7114. doi: 10.1073/pnas.1204464109. [DOI] [PMC free article] [PubMed] [Google Scholar]
- 17.Pyke KA, Leech RM. Rapid image analysis screening procedure for identifying chloroplast number mutants in mesophyll cells of Arabidopsis thaliana (L.) Heynh. Plant Physiol. 1991;96(4):1193–1195. doi: 10.1104/pp.96.4.1193. [DOI] [PMC free article] [PubMed] [Google Scholar]
- 18.Meehan L, Harkins K, Chory J, Rodermel S. Lhcb transcription is coordinated with cell size and chlorophyll accumulation. Plant Physiol. 1996;112(3):953–963. doi: 10.1104/pp.112.3.953. [DOI] [PMC free article] [PubMed] [Google Scholar]
- 19.Shen H, et al. Genome-wide analysis of DNA methylation and gene expression changes in two Arabidopsis ecotypes and their reciprocal hybrids. Plant Cell. 2012;24(3):875–892. doi: 10.1105/tpc.111.094870. [DOI] [PMC free article] [PubMed] [Google Scholar]
- 20.Gruner K, Griebel T, Návarová H, Attaran E, Zeier J. Reprogramming of plants during systemic acquired resistance. Front Plant Sci. 2013;4:252. doi: 10.3389/fpls.2013.00252. [DOI] [PMC free article] [PubMed] [Google Scholar]
- 21.Kalde M, Barth M, Somssich IE, Lippok B. Members of the Arabidopsis WRKY group III transcription factors are part of different plant defense signaling pathways. Mol Plant Microbe Interact. 2003;16(4):295–305. doi: 10.1094/MPMI.2003.16.4.295. [DOI] [PubMed] [Google Scholar]
- 22.Ishihama N, Yoshioka H. Post-translational regulation of WRKY transcription factors in plant immunity. Curr Opin Plant Biol. 2012;15(4):431–437. doi: 10.1016/j.pbi.2012.02.003. [DOI] [PubMed] [Google Scholar]
- 23.Xu X, Chen C, Fan B, Chen Z. Physical and functional interactions between pathogen-induced Arabidopsis WRKY18, WRKY40, and WRKY60 transcription factors. Plant Cell. 2006;18(5):1310–1326. doi: 10.1105/tpc.105.037523. [DOI] [PMC free article] [PubMed] [Google Scholar]
- 24.Mishina TE, Zeier J. The Arabidopsis flavin-dependent monooxygenase FMO1 is an essential component of biologically induced systemic acquired resistance. Plant Physiol. 2006;141(4):1666–1675. doi: 10.1104/pp.106.081257. [DOI] [PMC free article] [PubMed] [Google Scholar]
- 25.Návarová H, Bernsdorff F, Döring AC, Zeier J. Pipecolic acid, an endogenous mediator of defense amplification and priming, is a critical regulator of inducible plant immunity. Plant Cell. 2012;24(12):5123–5141. doi: 10.1105/tpc.112.103564. [DOI] [PMC free article] [PubMed] [Google Scholar]
- 26.Denancé N, Sánchez-Vallet A, Goffner D, Molina A. Disease resistance or growth: The role of plant hormones in balancing immune responses and fitness costs. Front Plant Sci. 2013;4:155. doi: 10.3389/fpls.2013.00155. [DOI] [PMC free article] [PubMed] [Google Scholar]
- 27.Kempel A, Schädler M, Chrobock T, Fischer M, van Kleunen M. Tradeoffs associated with constitutive and induced plant resistance against herbivory. Proc Natl Acad Sci USA. 2011;108(14):5685–5689. doi: 10.1073/pnas.1016508108. [DOI] [PMC free article] [PubMed] [Google Scholar]
- 28.Jaglo-Ottosen KR, Gilmour SJ, Zarka DG, Schabenberger O, Thomashow MF. Arabidopsis CBF1 overexpression induces COR genes and enhances freezing tolerance. Science. 1998;280(5360):104–106. doi: 10.1126/science.280.5360.104. [DOI] [PubMed] [Google Scholar]
- 29.Novillo F, Medina J, Salinas J. Arabidopsis CBF1 and CBF3 have a different function than CBF2 in cold acclimation and define different gene classes in the CBF regulon. Proc Natl Acad Sci USA. 2007;104(52):21002–21007. doi: 10.1073/pnas.0705639105. [DOI] [PMC free article] [PubMed] [Google Scholar]
- 30.Msanne J, Lin J, Stone JM, Awada T. Characterization of abiotic stress-responsive Arabidopsis thaliana RD29A and RD29B genes and evaluation of transgenes. Planta. 2011;234(1):97–107. doi: 10.1007/s00425-011-1387-y. [DOI] [PubMed] [Google Scholar]
- 31.Seki M, et al. Monitoring the expression pattern of 1300 Arabidopsis genes under drought and cold stresses by using a full-length cDNA microarray. Plant Cell. 2001;13(1):61–72. doi: 10.1105/tpc.13.1.61. [DOI] [PMC free article] [PubMed] [Google Scholar]
- 32.Gaffney T, et al. Requirement of salicylic Acid for the induction of systemic acquired resistance. Science. 1993;261(5122):754–756. doi: 10.1126/science.261.5122.754. [DOI] [PubMed] [Google Scholar]
- 33.Grant M, Lamb C. Systemic immunity. Curr Opin Plant Biol. 2006;9(4):414–420. doi: 10.1016/j.pbi.2006.05.013. [DOI] [PubMed] [Google Scholar]
- 34.Bari R, Jones JD. Role of plant hormones in plant defence responses. Plant Mol Biol. 2009;69(4):473–488. doi: 10.1007/s11103-008-9435-0. [DOI] [PubMed] [Google Scholar]
- 35.Derksen H, Rampitsch C, Daayf F. Signaling cross-talk in plant disease resistance. Plant Sci. 2013;207:79–87. doi: 10.1016/j.plantsci.2013.03.004. [DOI] [PubMed] [Google Scholar]
- 36.Kurihara Y, et al. Identification of the candidate genes regulated by RNA-directed DNA methylation in Arabidopsis. Biochem Biophys Res Commun. 2008;376(3):553–557. doi: 10.1016/j.bbrc.2008.09.046. [DOI] [PubMed] [Google Scholar]
- 37.Lister R, et al. Highly integrated single-base resolution maps of the epigenome in Arabidopsis. Cell. 2008;133(3):523–536. doi: 10.1016/j.cell.2008.03.029. [DOI] [PMC free article] [PubMed] [Google Scholar]
- 38.He G, et al. Global epigenetic and transcriptional trends among two rice subspecies and their reciprocal hybrids. Plant Cell. 2010;22(1):17–33. doi: 10.1105/tpc.109.072041. [DOI] [PMC free article] [PubMed] [Google Scholar]
- 39.Ding H, et al. Heterosis in early maize ear inflorescence development: A genome-wide transcription analysis for two maize inbred lines and their hybrid. Int J Mol Sci. 2014;15(8):13892–13915. doi: 10.3390/ijms150813892. [DOI] [PMC free article] [PubMed] [Google Scholar]
- 40.Salomé PA, et al. The recombination landscape in Arabidopsis thaliana F2 populations. Heredity (Edinb) 2012;108(4):447–455. doi: 10.1038/hdy.2011.95. [DOI] [PMC free article] [PubMed] [Google Scholar]
- 41.Cortijo S, et al. Mapping the epigenetic basis of complex traits. Science. 2014;343(6175):1145–1148. doi: 10.1126/science.1248127. [DOI] [PubMed] [Google Scholar]
- 42.Du Z, Zhou X, Ling Y, Zhang Z, Su Z. agriGO: A GO analysis toolkit for the agricultural community. Nucleic Acids Res. 2010;38(Web Server issue):W64-70. doi: 10.1093/nar/gkq310. [DOI] [PMC free article] [PubMed] [Google Scholar]
- 43.Benjamini Y, Yekutieli D. The control of the false discovery rate in multiple testing under dependency. Ann Stat. 2001;29(4):1165–1188. [Google Scholar]
Associated Data
This section collects any data citations, data availability statements, or supplementary materials included in this article.