

Significance
Antibiotics have profoundly changed human medicine, yet we know surprisingly little about the role of antibiotics in nature for the bacteria that produce them. Here we examine antibiotic use in the prolific antibiotic-producing genus Streptomyces across divergent social and competitive growth conditions. Our results provide clear experimental evidence that antibiotics are weapons whose use is strongly modified by intermicrobial social interactions. Simultaneously, using experiments and computer simulations, we show that social and competitive dynamics between bacteria have a crucial and previously unrecognized influence on the maintenance of microbial diversity in soil environments. These insights have implications for both bacterial coexistence and diversity and also for drug discovery.
Keywords: microbial ecology, Streptomyces, sociomicrobiology, antibiotics, competition sensing
Abstract
Despite their importance for humans, there is little consensus on the function of antibiotics in nature for the bacteria that produce them. Classical explanations suggest that bacteria use antibiotics as weapons to kill or inhibit competitors, whereas a recent alternative hypothesis states that antibiotics are signals that coordinate cooperative social interactions between coexisting bacteria. Here we distinguish these hypotheses in the prolific antibiotic-producing genus Streptomyces and provide strong evidence that antibiotics are weapons whose expression is significantly influenced by social and competitive interactions between competing strains. We show that cells induce facultative responses to cues produced by competitors by (i) increasing their own antibiotic production, thereby decreasing costs associated with constitutive synthesis of these expensive products, and (ii) by suppressing antibiotic production in competitors, thereby reducing direct threats to themselves. These results thus show that although antibiotic production is profoundly social, it is emphatically not cooperative. Using computer simulations, we next show that these facultative strategies can facilitate the maintenance of biodiversity in a community context by converting lethal interactions between neighboring colonies to neutral interactions where neither strain excludes the other. Thus, just as bacteriocins can lead to increased diversity via rock–paper–scissors dynamics, so too can antibiotics via elicitation and suppression. Our results reveal that social interactions are crucial for understanding antibiosis and bacterial community dynamics, and highlight the potential of interbacterial interactions for novel drug discovery by eliciting pathways that mediate interference competition.
The discovery and development of antibiotics to fight bacterial diseases is one of the great triumphs in modern medicine (1). However, increasing rates of antimicrobial resistance require innovative strategies to replenish antimicrobial drug pipelines (2, 3). Several novel antibiotics have been discovered in previously unexplored habitats (4) or uncultured microbes (5). By contrast, a second potential source of novel agents, silent antibiotic gene clusters in well-characterized organisms, remains unexploited because the factors that elicit their production are unknown (1). Identifying these factors requires understanding the ecological and evolutionary roles of antibiotics in the competitive and social context in which they are used in nature (6, 7). Here we test the role of social and competitive dynamics on antibiosis in the prolific antibiotic-producing bacterial genus Streptomyces. Simultaneously, we distinguish competing hypotheses for the role of antibiotics in nature.
Streptomycetes are a diverse group of filamentous bacteria that produce some two-thirds of all known antibiotics (8). Although the antibiotics they produce have classically been viewed as intermicrobial weapons (6, 9), this perspective is increasingly questioned on two grounds (10–13). First, antibiotic concentrations in soil are believed to be too low to kill or inhibit competing bacteria (9). Second, subinhibitory (sub-MIC) concentrations of antibiotics induce responses in exposed organisms, such as increased biofilm formation (14) or expression of virulence genes (11, 15) that may benefit these target cells (10). Thus, rather than weapons, these arguments have led to the idea that antibiotics are cooperative signals (16) used for intercellular communication, that they are “collective regulators of the homeostasis of microbial communities” (12).
However, evidence of response to sub-MIC antibiotic concentrations does not imply that antibiotics are signals or a form of communication. Communication can be partitioned according to the costs and benefits associated with production and response (17). A signal is a form of mutually beneficial communication between the sender of a signal and its recipient. A cue, by contrast, elicits a response that benefits only the recipient, sometimes to the detriment of the sender. Finally, suppression or attenuation (18) elicits a response that harms the recipient and benefits the producer (19, 20). Whereas signals are a form of cooperation, the unidirectional benefits associated with cues and suppression imply that these are forms of competition.
Distinguishing whether antibiotics are cooperative signals or competitive weapons requires partitioning communication into these contrasting modes (6, 19, 20) and examining the role of antibiotics in the competitive and social context in which they are used.
Results and Discussion
We measured the capacity of streptomycetes isolated from a single soil sample to inhibit one another during growth in isolation (designated asocial growth) and during growth in the presence of other competing streptomycete strains (designated social growth). A schematic of our assay conditions is detailed in Fig. 1A. Asocial interactions form the baseline against which we identified the influence of competition during social assays. Thus, if strain A fails to inhibit strain B during asocial growth, but can do so during social growth in the presence of strain C, this indicates that strain A responds to a cue produced by strain C. Alternatively, if strain A inhibits strain B during asocial growth, but is no longer capable of doing so when grown in the presence of strain C, this indicates that strain C suppresses strain A. During asocial assays, 13 strains were tested for their capacity to inhibit the others (13 × 13 = 169 test conditions), whereas inhibition during social assays was estimated after growing strains in coculture with the others (13 × 13 × 13 = 2,197 test conditions). Colonies in coculture were spaced at 1-cm distances, thus permitting identification of strain-specific responses to social growth. Inhibition was measured in media with high (GA) and low (soil) resource levels that modify the level of resource competition cells experienced (7), which in turn may influence the cellular transition between growth and antibiotic production (21) and the types of antibiotics produced (1, 22). The aim of these contrasting environments is to represent extremes in resource availability in soil microbial communities, because both possibilities are likely to be experienced by bacteria across time and space (23).
Fig. 1.
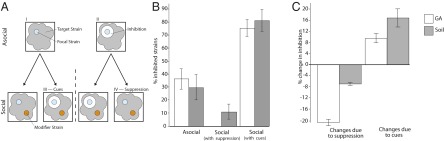
(A) Schematic of asocial and social inhibition assays. In asocial assays, focal strains (blue) are tested for their capacity to inhibit each other strain (gray) when plated atop the focal colonies in a soft agar overlay. Inhibition was detected as a zone of clearance surrounding focal colonies (II) whereas an absence of inhibition was detected as an absence of clearance (I). All 13 strains were tested as both the focal and target strains, leading to 169 possible assays. The fraction of strains that each focal isolate inhibited during asocial interactions was compared with their inhibitory capacity during social assays. Social assays measured inhibitory capacity of focal strains after growing adjacent to modifier strains (orange). Social interactions could generate two different outcomes: (i) modifier strains could increase (III) the inhibitory capacity of focal strains (I → III), or (ii) they could suppress (IV) the inhibitory capacity of focal strains (II → IV). During social assays, each strain could serve as the focal strain, the target strain, or the modifier strain, leading to a total of 13 × 13 × 13 = 2,197 interactions. For each focal strain, asocial interactions form the baseline against which we identified the influence of modifier strains during social assays. Thus, if the blue focal strain inhibits the gray target strain, but only when grown in the context of the orange modifier strain, this would indicate that the blue strain is responding to a cue produced by the orange strain (as in III). Alternatively, if the focal blue strain becomes incapable of killing the gray target strain when grown in the presence of the orange strain, this would indicate that the orange strain is suppressing the blue strain (as in IV). (B) Mean inhibitory capacity of strains during asocial and social assays. Asocial inhibition is scored as the fraction of strains inhibited in pairwise interactions, whereas social inhibition is scored as the average reduction/increase in the fraction of strains that are inhibited following either suppression or response to cues. (C) Mean proportional change in inhibition due to cues and suppression compared with asocial inhibition. Values correspond to mean ± SEM.
If antibiotics are used to mediate competitive interactions, we predict that social growth will lead to increased antibiotic production as cells respond to cues produced by these competitors (7). Equally, we predict that social growth will elicit defensive strategies to suppress or attenuate antibiotic production in competitors (18). Though this study was not aimed at identifying the mechanisms of elicitation and attenuation, both outcomes have been observed and can result from diverse mechanisms, including a response to stress caused by resource competition or antibiotic exposure (7, 24–26), or via enzymatic degradation of antibiotics or the signals regulating their production (2). Fig. 1 shows results from our experiments that are consistent with both of these predictions. All 13 strains in our collection produce cues that increase antibiotic production in at least one other strain, and 12 of 13 strains respond to such cues during social growth by increasing the range of their inhibitory capacity. Responding to cues leads to a significant increase in the proportion of strains that each strain inhibits in social vs. asocial conditions (Wilcoxon signed-rank test: GA: P = 0.002; soil: P < 0.002), corresponding to a more than a twofold increase in inhibitory capacity (GA: 2.08-fold, soil: 2.73-fold) in both environments (Fig. 1B). Although we find no difference in the number of strains responding to cues on GA or soil medium (Wilcoxon signed-rank test, P = 0.528), the magnitude of response of each strain is significantly greater in the soil than GA test environments (Wilcoxon signed-rank test, P = 0.019); across all 169 interactions for each strain (13 competitors × 13 targets), this corresponds to a 16.84% (soil) and 9.55% (GA) increase in inhibition that is attributable to facultative responses to cues (Fig. 1C). Suppressive responses during social growth are equally widespread (Fig. 1 B and C). As with cues, every strain in both resource environments suppresses at least one other during social growth. Strains were significantly more suppressive of others in GA than in soil medium (Wilcoxon signed-rank test, P < 0.001), corresponding respectively to a ∼20% and 6% decline in inhibition capacity attributable to suppression during social growth (Wilcoxon signed-rank test, P < 0.001; Fig. 1C).
Our data provide direct evidence that social and competitive interactions between streptomycetes dramatically modify their net inhibitory capacity, consistent with the idea that these bacteria use competition-sensing (7) to regulate antibiosis. Strains respond to cues by increasing their inhibitory range, but also suppress antibiotic production in competitors. Both responses, one offensive and the other defensive, are likely to benefit cells in a competitive social context and are therefore indicative of a competitive rather than cooperative role of antibiotics (7). To test this conclusion explicitly, we estimated the joint inhibitory capacity of all pairs of strains in both media types. To distinguish cooperative/synergistic vs. competitive interactions during social interactions, we compared the pairwise inhibitory capacity of all strains to their individual inhibitory capacities. Interactions were scored as cooperative or synergistic if their joint inhibitory capacity during social interactions was reciprocally increased compared with their individual capacity during asocial growth (i.e., AB > A and BA > B) and competitive if the joint inhibitory capacity of pairs of strains was less than or equal to the sum of their individual inhibitory range (i.e., AB ≤ A or BA ≤ B) (27). By this measure we found significantly more competitive than synergistic interactions (Fig. 2 A and B). On GA medium, only 2 of 78 pairs of strains were synergistic, whereas on soil medium this fraction increased to 15 of 78 pairs. Notably, however, 8 of these 15 pairs generate responses that are self-damaging because part of the increased range due to synergism includes one member of the pair. These results, together with widespread use of cues and suppression, further suggest that antibiotic use and deployment is predominantly competitive.
Fig. 2.

Competitive (black) and synergistic (white) inhibition during pairwise social interactions in (Left) GA (A) and (Right) soil (B). Competitive inhibition between a pair of strains is indicated when the inhibitory capacity of either strain is reduced during social (AB = A grown in the presence of B) vs. asocial (A = A grown alone) assays (AB ≤ A or BA ≤ B). Synergism, is indicated when the joint inhibitory capacity of the two strains together in social assays exceeds the sum of their inhibition when grown alone (AB > A and BA > B) (27). Skulls refer to the cases where strains on the rows induce antibiotic production in competitors during social assays to which they are themselves susceptible; i.e., they are self-damaging. The two matrices are symmetrical with respect to the first diagonal (except for the self-damaging relationships), and the relationships with self are not assessed (white squares cut with a diagonal line).
Direct antagonistic interactions between bacteria caused by bacteriocins or antibiotics can surprisingly enhance rather than decrease biodiversity when the pairwise interactions between strains are nontransitive (18, 28, 29). However, our experiments show that widespread indirect interactions between strains can significantly modify these direct interactions, sometimes defusing pairwise antagonism via suppression, and at other times increasing it via cues. In natural soil communities, numerous streptomycetes co-occur at small spatial scales (30, 31) and the social interactions we have uncovered may influence the manner of their coexistence. To examine the consequences of these interactions, we generated computer simulations using 2D cellular automata models (29) that compared patterns of microbial coexistence between social and asocial growth while preserving the spatial associations between neighboring cells (32). We additionally contrasted the role of social interactions in the two resource environments (GA vs. soil) owing to the differential influence of cues and suppression in these contexts. Whereas strains during asocial growth could only kill or resist one another, in simulations of social interactions we incorporated the role of cues and suppression. Simulation results based upon our empirically derived interactions reveal significant increases in diversity and richness due to social interactions (Fig. 3B) in the GA environment. Whereas only two strains survived and coexisted during asocial simulations in GA, social interactions permitted the survival and coexistence of 11 strains on average. By contrast, no significant changes in diversity were observed in simulations of social interactions in the soil environment.
Fig. 3.

(A) Differential effects on biodiversity of social and asocial interactions during simulations. One strain excludes the other during aggressive interactions, whereas during neutral interactions both strains coexist. Aggressive interactions during asocial simulations can be converted, by cues and suppression, to neutral interactions during social simulations that facilitate coexistence. (B) Average strain richness (mean ± SEM) during asocial and social simulations in both resource environments. In GA, there is a significant increase in the richness of surviving communities in social vs. asocial simulations (from 2 to 10.8; ANOVA: F1,199 = 21,376.13, P < 0.001) also reflected in Shannon diversity (from 0.58 to 1.88; ANOVA: F1,199 = 32,194.18, P < 0.001), whereas in soil there is a marginal decline in strain richness (from 4 to 3; ANOVA: F1,199 = 406.4, P < 0.001) and a marginal increase in Shannon diversity (from 0.7 to 0.85; ANOVA: F1,199 = 274.24, P < 0.001). (C) A screenshot of the final time point of one simulation grid depicting spatial patterns formed by the surviving strains. (D) Increased diversity during social simulations in GA leads to significant positive (green) and negative (red) associations between neighboring pairs of surviving strains. Strains that associate at no greater or lesser frequency than expected by chance are shown in black. (Inset) Fragment of the simulation grid in C depicts the positive spatial association between strains 5 (light purple) and 6 (dark purple).
We believe the results of our simulations have a simple and intuitive explanation. Strains during asocial simulations coexist as neighbors in either of two ways: they may have neutral interactions where neither produces an antibiotic active against the other, or they may be mutually capable of killing each other. Both symmetric scenarios lead to a standoff. Though the same conditions for coexistence remain during social simulations, there are many more indirect routes by which these conditions can be obtained, as we illustrate schematically in Fig. 3A. However, because the role of cues and suppression during social interactions differs between the two resource environments (Fig. 1 B and C), their effects on diversity are environment dependent. In the GA environment, social interactions cause widespread suppression of antibiosis and therefore an overall decline in killing capacity. Concomitantly, in simulations this leads to more neutral neighbors that can coexist. By contrast, in the soil environment, cues are used to increase antibiosis, leading to more antagonism among neighbors and therefore no increase in species diversity in the simulations. Both outcomes are relevant for bacteria in natural bacterial communities that experience marked temporal and spatial shifts in resource availability (23, 32); accordingly, our simulations predict that the influence of social interactions on streptomycete biodiversity will vary with ecological context.
Interestingly, social interactions during simulations led to spatial patterns of association and disassociation between particular strains that were reflective of their direct and indirect effects on one another (Fig. 3 C and D). These spatial patterns, where strains coexist in close physical proximity more (or less) often than predicted based on their respective frequencies, arise because inhibitory activity during pairwise social interactions (Fig. 1) is strongly modified by the identity of the interacting strains and their respective neighbors (Figs. S1 and S2). The consequence of this is that some interactions between strains that are antagonistic during asocial simulations, where one kills the other, are converted into neutral interactions via the influence of specific neighbors. For example, 19 of the 30 significantly positive associations between neighboring strains during social simulations in GA (Fig. 3D) are asymmetric during asocial interactions, but become symmetric because of suppression or cues. The positive association between strains 5 and 6 during social simulations illustrates this point while also clarifying the complex suite of factors that lead to this outcome. During asocial assays, strain 6 inhibited strain 5. However, most other strains suppressed this inhibition, enabling 5 and 6 to coexist as neighbors. Simultaneously, because both strains retained susceptibility to many others, 5 and 6, when they did survive, hid among one another. Similar factors underlie most of the positive associations in Fig. 3D, although the details of persistence are highly strain-specific.
Fig. S1.

(A) Results of asocial and social assays in GA. On rows, each strain is presented as a focal or a modifier strain (13 × 13 rows), and targets are shown in columns. Inhibition in asocial assays is depicted in gray, and an absence of inhibition is depicted in orange. Suppression appears as blue, and responses to cues are shown in red. (B) Results of asocial and social assays in soil. On rows each strain is presented as a focal or a modifier strain (13 × 13 rows) and targets are shown in columns. Inhibition in asocial assays is depicted in gray, and an absence of inhibition is depicted in orange. Suppression appears as blue and responses to cues are shown in red.
Fig. S2.
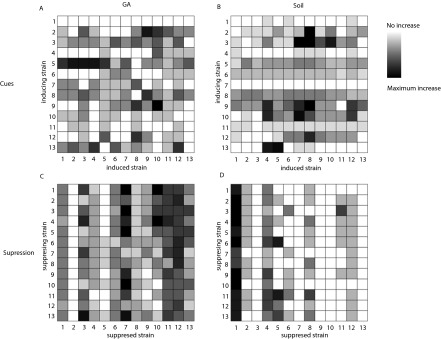
Heat maps showing the magnitude of responses of strains to cues from each other strain in (A) GA and (B) soil and their ability to suppress each other strain in (C) GA and (D) soil. The color palette is scaled to the minimum and maximum values of each interaction assessed: (A) min = 0, max = 7; (B) min = 0, max = 11; (C) min = 0, max = 9; (D) min = 0, max = 5.
Our results on randomly chosen streptomycetes from a single soil sample provide little support for the notion that antibiotics are cooperative signals used to coordinate bacterial behaviors (11, 12) and instead support the classic idea that these agents are used to mediate competition (9, 31). In addition, our data reveal that the classical dichotomy between killing and resistance used to understand interference competition between microbes is insufficient to describe interactions driven by antibiotics. Cells induce facultative responses to the presence of competitors by (i) increasing their own antibiotic production, thereby decreasing costs associated with constitutive synthesis of these expensive products, and (ii) by suppressing antibiotic production in competitors, thereby reducing direct threats to themselves (26). In a community context, these facultative strategies can influence biodiversity by converting lethal interactions between neighbors to neutral interactions where neither strain excludes the other. Thus, just as bacteriocins can lead to increased diversity via rock–paper–scissors dynamics (28, 29), so too can antibiotics via elicitation and suppression. In agreement with these conclusions, a recent theoretical analysis found that antibiotic suppression (called attenuation in this study) could stabilize antagonistic interactions and thereby facilitate microbial diversity (18). That these results were obtained using a different modeling approach to the one examined here supports the idea that our simulation results are quite general. However, the empirical results of the two studies differ in that we identified extensive induction as well as suppression, whereas the work of Kelsic et al. (18) observed induction only rarely (called intensification in their study). Although there may be many causes for this difference, two likely possibilities are that (i) our assays screened inhibition against a broader range of target species: 13 streptomycete strains coisolated from the same community vs. a reporter strain of Escherichia coli, and (ii) we examined interactions across two resource environments. Because our target strains will vary in their mechanisms of antibiotic susceptibility, this may have permitted us with a more sensitive assay to detect the effects of strain-specific antibiotic elicitation. Additionally, diverse assay environments help to capture the ecological dependence of interstrain interactions.
Our data highlight that the antagonistic relationships between coexisting streptomycetes are strongly dependent on the identity of neighbors and on resource availability. They also suggest that responses to these social interactions are rapidly evolving, as there were no associations between the phenotypes we measured and the phylogenetic relatedness of the strains we examined (Fig. S3). Nevertheless, several aspects of these relationships remain to be determined: the identity of cues that elicit antibiotic production and the mechanisms of suppression (13, 24), the functional role of resource concentration or composition in mediating antibiotic-driven strategies and how these diverse strategies map onto other competitive or potentially cooperative relationships among bacteria in a broader natural context. Determining the answers to these questions is of fundamental importance as they impact on the mechanisms of microbial diversity. Equally, they are of potential clinical value if cues can be used as general elicitors of weakly expressed or cryptic antibiotic production in this important bacterial genus (1), and therefore harnessed as tools to revive the flagging pipeline of antibiotic discovery (3).
Fig. S3.

Bayesian maximum-likelihood tree based upon the concatenated sequences from partial 16S rDNA, ssgA, and rpoB from each isolate. S. coelicolor, S. griseus, and S. lividans are used as references, with Kitasatospora sp. as an outgroup. Posterior probabilities are shown on the nodes; nodes with less than 95% posterior probability were collapsed. We found no significant correlation between phylogenetic distance and either killing, response to cues, or suppression by any of the 13 strains in either soil or GA media (Mantel nonparametric test with 10,000 randomizations; P > 0.05 for all comparisons after Holm–Bonferroni correction).
Materials and Methods
Strain Isolation and Maintenance.
A 1-g soil sample was taken from outside the Institute of Biology in Leiden, The Netherlands, and immediately returned to the laboratory for processing. Soil was dissolved into 10 mL Milli-Q water and serially diluted onto soya flour mannitol (SFM) agar containing, per liter, 20 g soy flour, 20 g mannitol, and 20 g agar. Plates were incubated for up to 2 wk at 30 °C, after which random colonies with actinomycete morphology were picked and subcultured on SFM media to obtain clonal spore stocks for each strain. High-density spore stocks were made in 20% glycerol and stored at −20 °C. Ten strains from this collection were used for subsequent assays together with three additional type strains: Streptomyces coelicolor M145, Streptomyces venezuelae ATCC 10712, and Streptomyces griseus IFO13350. To determine species identity, we sequenced fragments of three genes from each isolate: a ∼1,400-bp fragment of the 16S rDNA, a 350-bp fragment of rpoB for the RNA polymerase beta subunit, and a 400-bp fragment of ssgA, for the cell division regulator SsgA. The latter is particularly suited to discriminate between closely related actinomycetes, which are not well distinguished on the basis of the canonical taxonomic markers rpoB or 16S rRNA (33). PCR conditions are given in SI Materials and Methods and in Table S1. Sequences for the three genes were aligned and concatenated. Sites with more than 5% gaps were excluded, and models of evolution (HKY + I + G, F81 + G, and GTR + G for rDNA, rpoB, and ssgA, respectively) were inferred for each gene using jModelTest 2.1.7 (34). A maximum-likelihood tree was created using Geneious 7.1.5 (35) and MrBayes 3.2.2 (36) by creating a partition for each gene. We included reference sequences for S. griseus, Streptomyces lividans, and S. coelicolor, and with Kitasatospora sp. as an outgroup. These analyses confirmed that all strains were streptomycetes (Fig. S3). For simplicity, all strains are hereafter referred to numerically: 1–13.
Table S1.
Primers used for PCR and sequencing
| Primer | Sequence | Product size, bp | Annealing temperature, °C |
| 16S rDNA forward | GCGTGCTTAACACATGCAAG | 1,400 | 65 |
| 16S rDNA reverse | CCCGGGAACGTATTCACC | 1,400 | 65 |
| rpoB forward | TCGACCACTTCGGCAACCGC | 350 | 60 |
| rpoB reverse | TCGATCGGGCACATGCGGCC | 350 | 60 |
| ssgA forward | CAGGCAGAGGTCATGATGAGC | 400 | 58 |
| ssgA reverse 1 | CAGCCCGCGCTCTGTTCCTCC | 400 | 58 |
| ssgA reverse 2 | TCAGCCGGCGTTCTGCTCCTCG | 400 | 58 |
| ssgA reverse 3 | GGTCGGGCCCGCGCTCTCCTC | 400 | 58 |
Inhibition During Asocial and Social Interactions.
Two types of interactions between strains were examined. Asocial interactions measured the ability for each strain to inhibit the others, and social interactions measured the capability for each strain to inhibit the others while growing together with another modifier strain. For the 13 strains, there were 169 asocial interactions (13 × 13) and 2,197 social interactions (13 × 13 × 13). All assays were conducted on two media types with contrasting resource levels. GA medium contains per liter: 15 g starch, 0.5 g KNO3, 0.5 g K2HPO4, 0.5 g MgSO4, 5 g NaCl, 5 g KCl, 0.01 g FeSO4, 18 g agar. Soil extract medium was made by adding 5 g of commercial peat (Landgoed) to 1 L of demineralized water. The mixture was shaken overnight at room temperature and then filtered through cotton to remove particulate matter. The clarified extract was then autoclaved and either stored for later use or solidified with 1% agar. GA has a pH between 7.2 and 7.4, and soil medium has a pH of 6.4. Consistent with their divergent resource levels, we found significantly higher biomass of streptomycete strains grown on GA than on the soil extract medium (P < 0.001).
Asocial interactions.
Inhibition assays during asocial interactions between all strains were carried out in individual wells of 5 × 5 grid plates (Greiner) where each grid cube contained 3 mL of agar medium. One-microliter drops containing ∼1 × 10⁵ spores of each strain were spotted in each cube and grown for 5 d at 30 °C. Next, a 1-mL soft agar overlay (0.9% agar in the same medium as the bottom layer) containing ∼1.6 × 10⁵ spores of each target strain was poured onto each grid coordinate and incubated for an additional 7 d. Zones of clearance in the overlay surrounding cells on the bottom layer were scored as positive inhibition, and an absence of inhibition was scored as resistance. This experiment resulted in a 13 × 13 matrix, which we will further refer to as the asocial interaction matrix.
Social interactions.
To determine if strains modify the antibiotic production of one another during social interactions via cues or manipulation, we measured the inhibitory capacity of each strain after growth in the presence of each other isolate. Interactions were established by simultaneously inoculating two strains into opposite corners of one cube of a 5 × 5 grid plate. Colonies were grown for 5 d, during which time they could interact via diffusion of molecules secreted into the agar. Next, as in the asocial assays, the pair of strains was covered with a soft agar layer containing one of the 13 target strains. Zones of inhibition were scored after 7 d incubation at 30 °C. This experiment resulted in a 13 × 13 × 13 matrix, which we will further refer to as the social interaction matrix.
For each strain, asocial interactions form the baseline against which we identified the influence (positive or negative) of other strains during social assays. Thus, if strain A inhibits strain C, but only when grown in the context of strain B, this would indicate that strain A is responding to a cue produced by strain B. Alternatively, if strain A is no longer capable of killing strain C when grown in the presence of strain B, this would indicate that strain B is suppressing strain A.
These definitions can more formally be expressed as follows:
Cue: asocial_interactions_matrix [A, C] = 0 and social_interactions_matrix [AB, C] = 1.
Suppression: asocial_interactions_matrix [A, C] = 1 and social_interactions_matrix [AB, C] = 0.
To distinguish cooperative vs. competitive interactions during social interactions, we compared the pairwise inhibitory capacity of all strains to their individual inhibitory capacities. Interactions were scored as cooperative if their joint inhibitory capacity during social interactions was reciprocally increased compared with their individual capacity during asocial growth (i.e., AB > A and BA > B) and competitive if the joint inhibitory capacity of pairs of strains was less than or equal to the sum of their individual inhibitory range (i.e., AB ≤ A or BA ≤ B).
Microbial Coexistence During Asocial vs. Social Interactions.
To investigate the differential roles of social and asocial interactions on microbial coexistence we built 2D cellular automata simulations comprised of all 13 strains competing on a uniform 200 × 200 square grid of cells with toroidal topology, where each cell has eight neighbors. Each cell of the grid represents one bacterium that acts according to the interaction matrices that were determined experimentally. All 13 strains were equally represented and randomly distributed in the grid space at the beginning of the simulations, and all sites of the grid are always occupied.
In simulations of asocial interactions, at each time point each focal cell is engaged by one of its randomly chosen eight neighbors. If, according to the experimental results, this neighbor strain can kill the focal strain, then it will occupy it. If the neighbor is noninhibitory, neither strain is affected. At each time point every cell of the 200 × 200 grid is assigned to become the focal individual, in random order.
During simulations including social interactions, replacement occurs, as above, if the focal cell can be killed by one of its randomly chosen neighbors. However, here, the determination of whether the focal cell is killed depends on the local context of this neighbor cell. The neighbor can kill and occupy the focal cell in one of two ways: (i) The neighbor can kill the focal strain in the asocial interaction matrix and none of its neighbors is suppressing its toxin production (i.e., the killer remains a killer); or (ii) The neighbor strain cannot kill the focal strain in the asocial interaction matrix, but is able to do so after responding to a cue produced by one of its own neighbors (i.e., the nonkiller becomes a killer). The killing and replacement rules in the asocial and social interactions simulations can be reduced to pseudocode given in SI Materials and Methods.
One hundred simulations were carried out for each of the four experimental conditions (asocial vs. social in both resource environments). At the end of each simulation, we quantified the richness and Shannon diversity of the remaining isolates. In addition, we quantified whether the surviving strains were more or less physically associated as neighbors than expected by chance. These neighborhood properties were determined by comparing the expected vicinities of strains to the observed ones. The expected vicinities were determined by
where nj represents the total number of possibilities of meeting a cell of type j in the grid. The observed vicinities we determined by , where mij is the observed total number of cells of strain j bordering cells of strain i. The significance of Pobs was tested with a Fisher’s exact test, with applied Bonferroni correction.
SI Materials and Methods
Strain Identification.
To determine species identity, we sequenced fragments of three genes from each isolate: a ∼1,400-bp fragment of the 16S rDNA, a 350-bp fragment of rpoB for the RNA polymerase beta subunit, and a 400-bp fragment of ssgA, for the cell division regulator SsgA. The latter is particularly suited to discriminate between closely related actinomycetes, which are not well distinguished on the basis of the canonical taxonomic markers rpoB or 16S rDNA (33) The PCR mixture contained, per sample: 40 μL DNase free water, 5 μL Pimmix buffer, 1.5 μL forward primer, 1.5 μL reverse primer, 1 μL Taq Polymerase (Qiagen), 1 μL gDNA. Primers are given in Table S1. After an initial 5-min denaturation set at 96 °C, PCR was carried out for up to 35 cycles at the following conditions: 3 min 30 s denaturation at 95 °C, 30 s at 65–67 C (depending on the sample), and 1 min 45 s extension at 72 °C. Single PCR products of the correct size were purified (Promega) and sequenced commercially at Macrogen.
Replacement Rules During Social and Asocial Simulations.
During simulations, including social interactions, replacement occurs, as above, if the focal cell can be killed by one of its randomly chosen neighbors. However, here, the determination of whether the focal cell is killed depends on the local context of this neighbor cell. The neighbor can kill and occupy the focal cell in one of two ways: (i) the neighbor can kill the focal strain in the asocial interaction matrix and none of its neighbors is suppressing its toxin production (i.e., the killer remains a killer); or (ii) the neighbor strain cannot kill the focal strain in the asocial interaction matrix, but is able to do so after responding to a cue produced by one of its own neighbors (i.e., the nonkiller becomes a killer). The killing and replacement rules in the asocial and social interactions simulations can be reduced to pseudocode given in SI Materials and Methods.
Asocial interactions simulations:
IF Neighbor-Can-Kill-Focal-Individual-In-Asocial-Interaction THEN
Neighbor-Kills-And-Replaces-Focal-Individual
ENDIF
Social interactions simulations:
IF (Neighbor-Can-Kill-Focal-Individual-In-Asocial-Interaction AND Neighbor-Is-Not-Suppressed) OR (Neighbor-Cannot-Kill-Focal-Individual-In-Asocial-Interaction AND Neighbor-Is-Induced) THEN
Neighbor-Kills-And-Replaces-Focal-Individual
ENDIF
Acknowledgments
We acknowledge the helpful comments and criticism on earlier drafts of this manuscript by Jos Raaijmakers, Paolina Garbeva, and Dennis Claessen. In addition, we appreciate the helpful and constructive comments of the editor, an anonymous referee, and Kevin Foster. Financial support was provided by grants from the UK Biotechnology and Biological Research Council (BBSRC) and Dutch National Science Foundation (to D.E.R.) and by a BBSRC-funded studentship (to M.I.A.).
Footnotes
The authors declare no conflict of interest.
This article is a PNAS Direct Submission.
See Commentary on page 10827.
This article contains supporting information online at www.pnas.org/lookup/suppl/doi:10.1073/pnas.1504076112/-/DCSupplemental.
References
- 1.Zhu H, Sandiford SK, van Wezel GP. Triggers and cues that activate antibiotic production by actinomycetes. J Ind Microbiol Biotechnol. 2014;41(2):371–386. doi: 10.1007/s10295-013-1309-z. [DOI] [PubMed] [Google Scholar]
- 2.Davies J, Davies D. Origins and evolution of antibiotic resistance. Microbiol Mol Biol Rev. 2010;74(3):417–433. doi: 10.1128/MMBR.00016-10. [DOI] [PMC free article] [PubMed] [Google Scholar]
- 3.Woolhouse M, Farrar J. Policy: An intergovernmental panel on antimicrobial resistance. Nature. 2014;509(7502):555–557. doi: 10.1038/509555a. [DOI] [PubMed] [Google Scholar]
- 4.Charlop-Powers Z, et al. Global biogeographic sampling of bacterial secondary metabolism. eLife. 2015;4:e05048. doi: 10.7554/eLife.05048. [DOI] [PMC free article] [PubMed] [Google Scholar]
- 5.Ling LL, et al. A new antibiotic kills pathogens without detectable resistance. Nature. 2015;517:455–459. doi: 10.1038/nature14098. [DOI] [PMC free article] [PubMed] [Google Scholar]
- 6.Ratcliff WC, Denison RF. Microbiology. Alternative actions for antibiotics. Science. 2011;332(6029):547–548. doi: 10.1126/science.1205970. [DOI] [PubMed] [Google Scholar]
- 7.Cornforth DM, Foster KR. Competition sensing: The social side of bacterial stress responses. Nat Rev Microbiol. 2013;11(4):285–293. doi: 10.1038/nrmicro2977. [DOI] [PubMed] [Google Scholar]
- 8.Bérdy J. Thoughts and facts about antibiotics: Where we are now and where we are heading. J Antibiot (Tokyo) 2012;65(8):385–395. doi: 10.1038/ja.2012.27. [DOI] [PubMed] [Google Scholar]
- 9.Raaijmakers JM, Mazzola M. Diversity and natural functions of antibiotics produced by beneficial and plant pathogenic bacteria. Annu Rev Phytopathol. 2012;50:403–424. doi: 10.1146/annurev-phyto-081211-172908. [DOI] [PubMed] [Google Scholar]
- 10.Davies J, Spiegelman GB, Yim G. The world of subinhibitory antibiotic concentrations. Curr Opin Microbiol. 2006;9(5):445–453. doi: 10.1016/j.mib.2006.08.006. [DOI] [PubMed] [Google Scholar]
- 11.Yim G, Wang HH, Davies J. The truth about antibiotics. Int J Med Microbiol. 2006;296(2-3):163–170. doi: 10.1016/j.ijmm.2006.01.039. [DOI] [PubMed] [Google Scholar]
- 12.Linares JF, Gustafsson I, Baquero F, Martinez JL. Antibiotics as intermicrobial signaling agents instead of weapons. Proc Natl Acad Sci USA. 2006;103(51):19484–19489. doi: 10.1073/pnas.0608949103. [DOI] [PMC free article] [PubMed] [Google Scholar]
- 13.Romero D, Traxler MF, López D, Kolter R. Antibiotics as signal molecules. Chem Rev. 2011;111(9):5492–5505. doi: 10.1021/cr2000509. [DOI] [PMC free article] [PubMed] [Google Scholar]
- 14.Hoffman LR, et al. Aminoglycoside antibiotics induce bacterial biofilm formation. Nature. 2005;436(7054):1171–1175. doi: 10.1038/nature03912. [DOI] [PubMed] [Google Scholar]
- 15.Stevens DL, et al. Impact of antibiotics on expression of virulence-associated exotoxin genes in methicillin-sensitive and methicillin-resistant Staphylococcus aureus. J Infect Dis. 2007;195(2):202–211. doi: 10.1086/510396. [DOI] [PubMed] [Google Scholar]
- 16.Fajardo A, Martínez JL. Antibiotics as signals that trigger specific bacterial responses. Curr Opin Microbiol. 2008;11(2):161–167. doi: 10.1016/j.mib.2008.02.006. [DOI] [PubMed] [Google Scholar]
- 17.West SA, Diggle SP, Buckling A, Gardner A, Griffin AS. The social lives of microbes. Annu Rev Ecol Evol Syst. 2007;38:53–77. [Google Scholar]
- 18.Kelsic ED, Zhao J, Vetsigian K, Kishony R. Counteraction of antibiotic production and degradation stabilizes microbial communities. Nature. 2015;521(7553):516–519. doi: 10.1038/nature14485. [DOI] [PMC free article] [PubMed] [Google Scholar]
- 19.Diggle SP, Gardner A, West SA, Griffin AS. Evolutionary theory of bacterial quorum sensing: When is a signal not a signal? Philos Trans R Soc Lond B Biol Sci. 2007;362(1483):1241–1249. doi: 10.1098/rstb.2007.2049. [DOI] [PMC free article] [PubMed] [Google Scholar]
- 20.Stacy AR, Diggle SP, Whiteley M. Rules of engagement: Defining bacterial communication. Curr Opin Microbiol. 2012;15(2):155–161. doi: 10.1016/j.mib.2011.11.007. [DOI] [PubMed] [Google Scholar]
- 21.Rigali S, et al. Feast or famine: The global regulator DasR links nutrient stress to antibiotic production by Streptomyces. EMBO Rep. 2008;9(7):670–675. doi: 10.1038/embor.2008.83. [DOI] [PMC free article] [PubMed] [Google Scholar]
- 22.van Wezel GP, McDowall KJ. The regulation of the secondary metabolism of Streptomyces: New links and experimental advances. Nat Prod Rep. 2011;28(7):1311–1333. doi: 10.1039/c1np00003a. [DOI] [PubMed] [Google Scholar]
- 23.Fierer N, Bradford MA, Jackson RB. Toward an ecological classification of soil bacteria. Ecology. 2008;88:1354–1364. doi: 10.1890/05-1839. [DOI] [PubMed] [Google Scholar]
- 24.Traxler MF, Watrous JD, Alexandrov T, Dorrestein PC, Kolter R. Interspecies interactions stimulate diversification of the Streptomyces coelicolor secreted metabolome. MBio. 2013;4(4):e00459-13. doi: 10.1128/mBio.00459-13. [DOI] [PMC free article] [PubMed] [Google Scholar]
- 25.Hesketh A, et al. Genome-wide dynamics of a bacterial response to antibiotics that target the cell envelope. BMC Genomics. 2011;12(1):226. doi: 10.1186/1471-2164-12-226. [DOI] [PMC free article] [PubMed] [Google Scholar]
- 26.Tyc O, et al. Impact of interspecific interactions on antimicrobial activity among soil bacteria. Front Microbiol. 2014;5:567. doi: 10.3389/fmicb.2014.00567. [DOI] [PMC free article] [PubMed] [Google Scholar]
- 27.Foster KR, Bell T. Competition, not cooperation, dominates interactions among culturable microbial species. Curr Biol. 2012;22(19):1845–1850. doi: 10.1016/j.cub.2012.08.005. [DOI] [PubMed] [Google Scholar]
- 28.Kerr B, Riley MA, Feldman MW, Bohannan BJM. Local dispersal promotes biodiversity in a real-life game of rock-paper-scissors. Nature. 2002;418(6894):171–174. doi: 10.1038/nature00823. [DOI] [PubMed] [Google Scholar]
- 29.Czárán TL, Hoekstra RF, Pagie L. Chemical warfare between microbes promotes biodiversity. Proc Natl Acad Sci USA. 2002;99(2):786–790. doi: 10.1073/pnas.012399899. [DOI] [PMC free article] [PubMed] [Google Scholar]
- 30.Vetsigian K, Jajoo R, Kishony R. Structure and evolution of Streptomyces interaction networks in soil and in silico. PLoS Biol. 2011;9(10):e1001184. doi: 10.1371/journal.pbio.1001184. [DOI] [PMC free article] [PubMed] [Google Scholar]
- 31.Kinkel LL, Schlatter DC, Xiao K, Baines AD. Sympatric inhibition and niche differentiation suggest alternative coevolutionary trajectories among Streptomycetes. ISME J. 2014;8(2):249–256. doi: 10.1038/ismej.2013.175. [DOI] [PMC free article] [PubMed] [Google Scholar]
- 32.Vos M, Wolf AB, Jennings SJ, Kowalchuk GA. Micro-scale determinants of bacterial diversity in soil. FEMS Microbiol Rev. 2013;37(6):936–954. doi: 10.1111/1574-6976.12023. [DOI] [PubMed] [Google Scholar]
- 33.Girard G, et al. A novel taxonomic marker that discriminates between morphologically complex actinomycetes. Open Biol. 2013;3(10):130073. doi: 10.1098/rsob.130073. [DOI] [PMC free article] [PubMed] [Google Scholar]
- 34.Darriba D, Taboada GL, Doallo R, Posada D. jModelTest 2: More models, new heuristics and parallel computing. Nat Methods. 2012;9(8):772. doi: 10.1038/nmeth.2109. [DOI] [PMC free article] [PubMed] [Google Scholar]
- 35.Kearse M, et al. Geneious Basic: An integrated and extendable desktop software platform for the organization and analysis of sequence data. Bioinformatics. 2012;28(12):1647–1649. doi: 10.1093/bioinformatics/bts199. [DOI] [PMC free article] [PubMed] [Google Scholar]
- 36.Huelsenbeck JP, Ronquist F. MRBAYES: Bayesian inference of phylogenetic trees. Bioinformatics. 2001;17(8):754–755. doi: 10.1093/bioinformatics/17.8.754. [DOI] [PubMed] [Google Scholar]