Significance
Controlling the internal structure over multiple length scales can produce materials with superior properties. This hierarchical design is ubiquitous in nature where materials have evolved to show maximum functionality from a limited choice of available building blocks. Mimicking the emergence of functionality from simple building blocks is a key challenge for man-made materials. Here, we show how a simple confined self-assembly of colloidal particles leads to a complex geometry that displays a surprising variety of optical effects. These effects are a result of the intricate interaction of light with the structural features at different length scales, and the geometry of the self-assembled structure. The results underline the importance of controlling assembly processes over multiple length scales to tailor properties and maximize performance.
Keywords: self-assembly, colloids, photonic crystal, structural color, hierarchy
Abstract
Materials in nature are characterized by structural order over multiple length scales have evolved for maximum performance and multifunctionality, and are often produced by self-assembly processes. A striking example of this design principle is structural coloration, where interference, diffraction, and absorption effects result in vivid colors. Mimicking this emergence of complex effects from simple building blocks is a key challenge for man-made materials. Here, we show that a simple confined self-assembly process leads to a complex hierarchical geometry that displays a variety of optical effects. Colloidal crystallization in an emulsion droplet creates micron-sized superstructures, termed photonic balls. The curvature imposed by the emulsion droplet leads to frustrated crystallization. We observe spherical colloidal crystals with ordered, crystalline layers and a disordered core. This geometry produces multiple optical effects. The ordered layers give rise to structural color from Bragg diffraction with limited angular dependence and unusual transmission due to the curved nature of the individual crystals. The disordered core contributes nonresonant scattering that induces a macroscopically whitish appearance, which we mitigate by incorporating absorbing gold nanoparticles that suppress scattering and macroscopically purify the color. With increasing size of the constituent colloidal particles, grating diffraction effects dominate, which result from order along the crystal’s curved surface and induce a vivid polychromatic appearance. The control of multiple optical effects induced by the hierarchical morphology in photonic balls paves the way to use them as building blocks for complex optical assemblies—potentially as more efficient mimics of structural color as it occurs in nature.
Hierarchical design principles, i.e., the structuration of material over multiple length scales, are ubiquitously used in nature to maximize functionality from a limited choice of available components. Hierarchically structured materials often provide better performance than their unstructured counterparts and novel properties can arise solely from the multiscale structural arrangement. Examples can be found in the extreme water repellency of the lotus leaf (1); the outstanding mechanical stability and toughness of sea creatures such as sea sponges (2) and abalone shells (3); and the bright coloration found in beetles, birds, and butterflies (4, 5).
To achieve the strongest visual effects, many organisms combine optical effects arising from light interacting with structured matter at different length scales (6). Structural periodicity on the scale of visible light wavelengths can result in regular optical density variations that give rise to bright, iridescent colors due to pronounced interference effects (4). At the micron scale, regular structural features act as diffraction gratings that produce vivid, rainbow coloration (7) and are used to control scattering (8) and to direct the emission of light by mirror-like reflections (9). At the molecular level, broadband absorption, for example by melanin, can be used to reduce unwanted scattering due to structural imperfections, which, if not eliminated, can lead to a whitish appearance (10).
Several advantages of structural coloration compared with pigmentation hues have led to a strong interest in mimicking nature’s photonic design principles in technology (11, 12). These advantages include increased color longevity by the absence of photobleaching; the ability to use benign and nontoxic materials; broad variation in colors arising from simple changes in geometry of the same material; and the presence of vivid optical effects such as sparkle, luster, and iridescence, not achievable by conventional pigments. However, structural color requires a high degree of control over the nano- and microscale geometry of the colored material. Self-assembly processes involving colloidal particles have been identified as an attractive route to create ordered structures at the nanoscale without the need for expensive and serial nanofabrication methods (13–15). Colloidal particles are attractive building blocks for mimicking nature’s structural coloration strategies because they can be conveniently synthesized in a range of sizes comparable to those of visible light wavelengths. Colloids self-assemble into highly ordered, close-packed crystals on flat surfaces, giving rise to structural color by constructive interference of light reflected at the individual lattice planes (13, 15).
Structural hierarchy, i.e., the organization of colloidal crystals into ordered superstructures, can be achieved by imposing a confining element on the crystallization process. A simple yet interesting confinement for the crystallization process is an emulsion droplet that creates colloidal assemblies known as photonic balls (16–19). Curvature imposed by the spherical confinement is a unique structural element of photonic balls. It is known that curvature induces different types of defect structures in 2D (20, 21) and 3D assemblies (22), which can affect the resulting optical properties. Photonic balls have recently gained attention in various optical applications, including pigments (23–26), sensors (27), magnetically switchable colorants (25, 28), and color-coded substrates for biomaterials evaluation (29, 30).
Here, we provide a detailed physical understanding of the different optical phenomena occurring in photonic balls and trace the origin of these properties to structural details, especially curvature. We use focused ion beam-assisted cross-sectioning to visualize the effect of confinement on the internal morphology and find ordered, layered crystal planes near the interface and a more disordered region toward the center. Tailoring the degree of confinement allows us to control the crystallinity and thus, the resulting color arising from Bragg diffraction. Disorder and defects, caused by frustrated crystallization in the curved confinement, contributes to unwanted broadband scattering of light, which compromises the macroscopic color. We introduce gold nanoparticles as subwavelength, spectrally selective absorbers into the photonic balls to suppress light scattering in spectrally unwanted regions. This synergistic combination of plasmonic absorption with Bragg diffraction leads to a macroscopically purer coloration, if the photonic crystal stop band and gold nanoparticle absorption are appropriately adjusted. Finally, we observe more complex optical signatures in the reflection of light from photonic balls assembled from larger colloidal particles (d > 400 nm) that result from grating diffraction caused by a regular arrangement of colloids at the surface of the photonic balls.
Our theoretical experimental examination of the influence of curvature and confinement on the different optical phenomena enables us to create a complete picture of the rich optical properties of these simple, hierarchical self-assembled structures.
Results and Discussion
Synthesis and Internal Morphology of Photonic Balls.
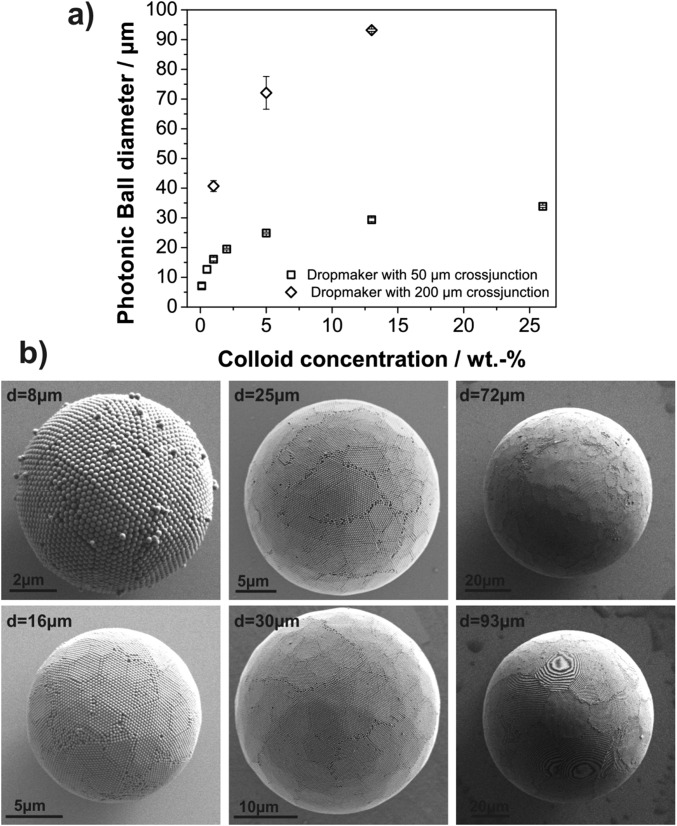
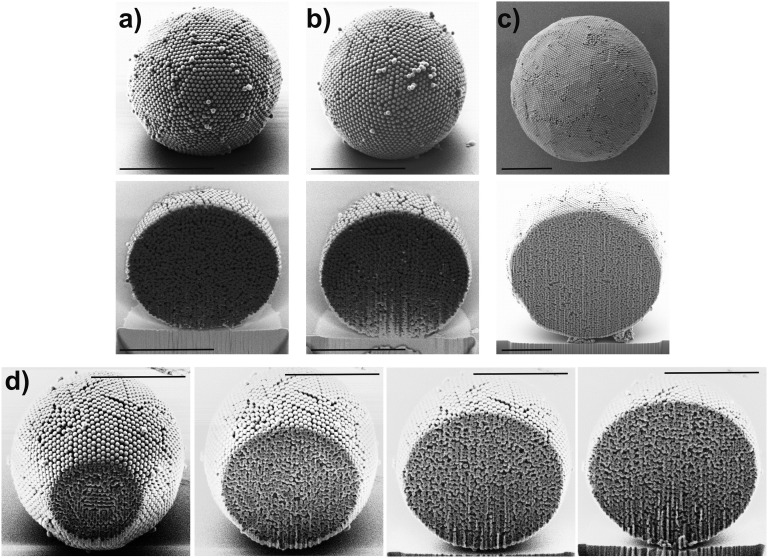
We use droplet-based microfluidics to emulsify an aqueous dispersion of polystyrene colloids in a continuous fluorocarbon oil phase (31). The cross-junction devices are conveniently prepared from poly(dimethylsiloxane) (PDMS) by soft lithography and enable us to create stable emulsions with narrow size distributions in a continuous-flow process as illustrated in Fig. 1A (32). After emulsification, the water is removed from the generated droplets at 45 °C, resulting in shrinkage of the emulsion droplets and self-assembly of the colloids in their spherical confinement. We control the diameter of the produced photonic balls from below 10 µm to above 100 µm by tuning the concentration of colloids in the aqueous dispersion and the size of the emulsion droplet generated in the microfluidic device (Fig. S1). The surface of the balls, visible in Fig. 1 B and C, shows colloids ordered in a polycrystalline, close-packed lattice, previously assigned as the (111) lattice plane of the 3D crystal formed in the spherical confinement (23, 24). However, the curvature in the confinement impedes the formation of a perfectly ordered crystal, resulting in characteristic defects and assembly structures (20, 21). A focused ion beam (FIB) was used to cross-section photonic balls and uncover their internal crystal structure, which we show in Fig. 1D and Fig. S2. The cross-sections reproducibly indicate the presence of a layered morphology of the colloidal crystal toward the interface, consisting of several close-packed [i.e., (111)] planes stacked into a curved 3D crystal. Towards the center of the ball, the assembly appears increasingly disordered, presumably as a consequence of increasing frustration. The higher the level of confinement is (i.e., the smaller the ratio of the diameters of ball and colloid, dball/dcoll), the fewer ordered layers exist (Fig. S2). It is worth noting that the structures we observe seem less faceted and appear to follow the curvature of the confinement more than would be expected from thermodynamic considerations (22), indicating that kinetic effects may play a significant role in our system.
Fig. 1.

Photonic balls are prepared by self-assembly of colloids in the spherical confinement of emulsion droplets. (A) Optical micrograph of the cross-junction microfluidic device used to emulsify a colloidal dispersion into monodisperse droplets. (B and C) SEM micrographs of photonic balls formed by assembly of 250-nm colloids in the confinement of an emulsion droplet (dball = 8 µm in B and 30 µm in C). Moiré patterns visible in C indicate high order. (D) Exemplary cross section of a photonic ball obtained by FIB cutting indicates a layered internal morphology with ordered structure around the interface (Top Inset) and increasing disorder toward the center (Bottom Inset). See Fig. S2 for further examples. (E) Schematic illustration of multiple optical effects originating from the hierarchical self-assembly (1): Crystalline order results in Bragg reflection of light with a wavelength defined by the colloid size (2); disorder in the assembly gives rise to unselective scattering of incident light (3); periodic assemblies at the ball’s surface lead to grating diffraction effects, separating white light into its spectral components (for colloid sizes >400 nm).
Fig. S1.
(A) Control of the diameter of photonic balls by changing concentration of the aqueous dispersion and the dimension of the cross-junction in the microfluidic synthesis. (B) Representative images of photonic balls with diameters between 8 µm and 93 µm.
Fig. S2.
(A–C) Additional focused ion beam-assisted cross sections of photonic balls with different diameters: (A and B) 8 µm and (C) 15 µm. A layered crystal structure seems to be present in all cuts. (Scale bars, 5 µm.) (D) Sequence of a FIB cut through a ball, showing the internal structure at various positions within the ball.
This curved crystal structure relates to multiple optical properties observed in photonic balls, as schematically illustrated and labeled in Fig. 1E. We estimate the amount of order present in photonic balls of a given size based on the intensity of structural coloration that we observe from Bragg diffraction at the ordered lattice planes “(1)”. We show that broadband scattering of light, caused by the photonic ball dimensions and the internal disorder, induces a whitish macroscopic appearance “(2)”, which can be mitigated by incorporating gold nanoparticles. Finally, we identify the ordered arrangement of colloids at the surface of the photonic ball as the origin of color from grating diffraction “(3)”.
Coloration Arising from Bragg Diffraction.
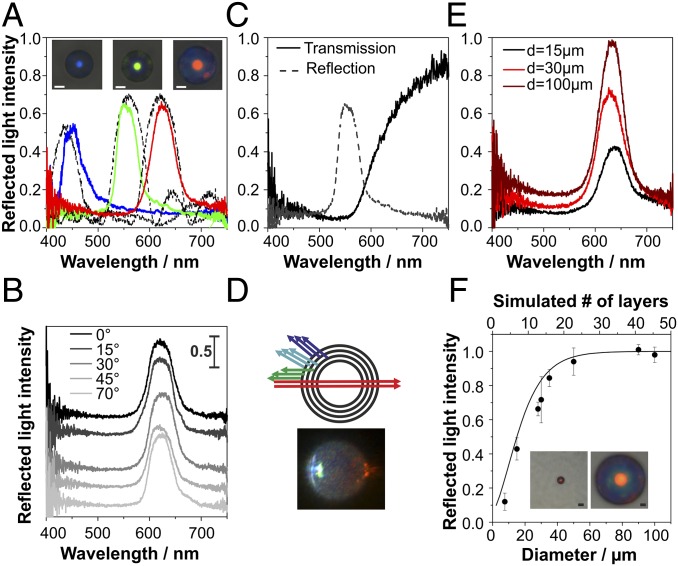
We investigate the color of individual photonic balls, using a fiber-optic cable to collect and spectrally analyze reflected light of individual photonic balls through a microscope objective lens. Fig. 2A shows optical images and corresponding measured reflection spectra (solid lines) of individual balls (dball = 30 µm) consisting of colloids with sizes of 180 nm, 225 nm, and 250 nm that display blue, green, and red structural color, respectively. This color has been previously assigned to Bragg diffraction, i.e., constructive interference of light reflected at individual lattice planes in the curved colloidal crystal (23). The FIB cross sections (Fig. 1D and Fig. S2) confirm the presence of such layers in our system. A consequence of the spherical nature of the photonic balls is the lack of angular dependence under illumination conditions in a microscope as shown in Fig. 2B.
Fig. 2.
Optical properties arising from Bragg diffraction of light at ordered crystal layers. (A) Structural color can be tuned throughout the visible spectrum (solid lines: blue, dcoll = 180 nm; green, dcoll = 225 nm; red, dcoll = 250 nm; photonic ball diameter is 30 µm in all cases) and correlates with 1D simulations (dotted lines) of light reflection at stacked (111) planes within the ball. (B) Reflected light intensity and wavelengths are spectrally independent of the angle of incidence with respect to the substrate surface. (C and D) The transmission spectra of a photonic ball (250-nm colloids) resembles a long-pass filter, which can be explained by the curved nature of the ball and directly visualized by illumination from the side (D). (E and F) The reflected light intensity depends on the size of the photonic balls and reaches saturation for balls with a diameter of 50 µm and larger. The intensity correlates with an increase in the number of ordered layers obtained from simulations (solid line) (F). (All scale bars, 10 µm.) F, Insets show photonic balls with a diameter of 8 µm (Left) and 100 µm (Right).
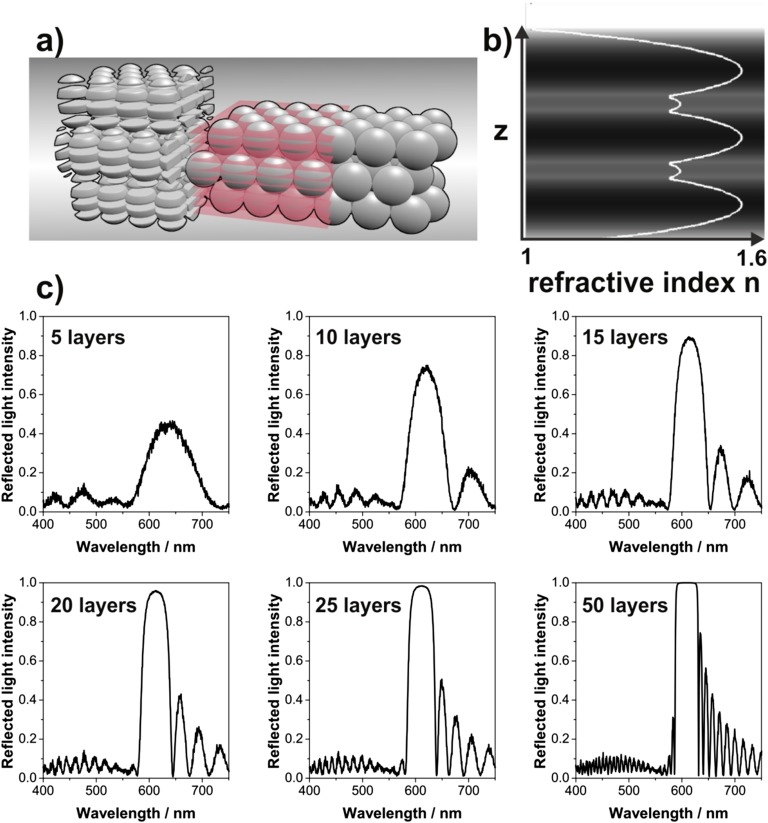
We model the photonic balls as a multilayer structure in a 1D transfer matrix simulation with a refractive index profile corresponding to a stacked, close-packed colloidal crystal (details in Fig. S3). The simulated spectra, shown as dotted lines in Fig. 2A, match the experiments, corroborating that multilayer interference at stacked (111) planes can cause the observed color. To match the peak intensity, simulations were performed assuming seven (180-nm colloids) and nine (225-nm and 250-nm colloids) perfectly ordered layers of colloidal crystal.
Fig. S3.
Explanation of one-dimensional (1D) transfer matrix calculation of reflectance spectra for photonic balls. The multilayer structure of the ball is simulated as a noncurved thin film; the disorder in the ball’s interior is approximated by a random refractive index material underneath the multilayer structure. (A) Schematic showing the division of the film into discretized layers for averaging to generate an analog 1D multilayer structure. (B) Color plot with line plot overlay showing the refractive index variation along the normal direction of a three-layer polystyrene opal film (darker colors indicate higher refractive indexes). The refractive index was calculated by laterally averaging the permittivity of the opal for each slice. Additional numbers of layers are easily included by repeating the refractive index profile as desired. (C) Calculated reflectance spectra, exemplarily shown for opal films with a colloid size of 250 nm and different numbers of layers. The additional peaks around the main Bragg reflection peak are caused by thin-film interference effects.
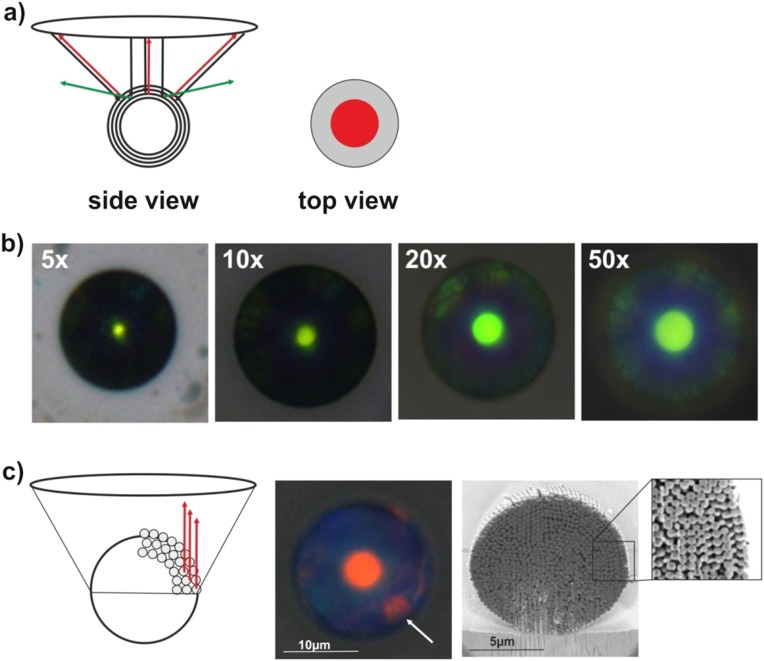
The most prominent feature of the optical microscope images throughout Fig. 2 is an area with intense, uniform color in the center of the ball surrounded by a pale, almost colorless rim. We attribute this color pattern to the spherical nature of the hierarchical assembly: Only the center of the photonic ball reflects light that can be detected in the microscope objective (Fig. S4A). Larger angles of incident and reflected light—causing a blue shift of color—are not picked up by the microscope objective (Fig. S4A), creating the observed uniform coloration. The colorful area of the ball corresponds to the angular range of back-reflected light the objective can collect, which we confirmed by imaging an individual photonic ball with objectives of different numerical aperture and found quantitative agreement between the accessible angles calculated from the numerical aperture of the lens and from the ratio of the colored area to the ball diameter (Figs. S4B and S5 and Table S1). However, this model does not account for colored patches visible at the outer rims of some photonic balls, e.g., in the red-colored ball in Fig. 2A. These spots may be caused by light reflected back into the objective at ordered planes perpendicular to the stacked (111) planes, visible in cross-sectional images (Fig. S4C).
Fig. S4.
Optical details of photonic balls imaged in a microscope. (A) The uniform appearance of color in a central area of the ball with dark outer regions is caused by the curved nature of the photonic ball and the limited range of angles the microscope lens can collect: Only light back reflected normal to the surface is collected by the lens (red arrows); light reflected under higher angles, leading to a blue shift in constructively interfering wavelengths (green arrows), is not reflected within the collection angles. (B) The numerical aperture of the objective defines the colored area of the ball. Higher-magnification lenses, corresponding to larger numerical aperture, enable the collection of light that is back-reflected from a wider range of angles; this larger collection angle leads to an increased diameter of the colored area (see Table S1 for quantification). (C) The colorful patches visible on the edges of some particles (white arrow) may arise from ordered areas normal to the stacked (111) layers. Such periodicities (exemplarily shown in the FIB cross section) allow light to be back reflected into the objective lens even at the edge of the photonic ball.
Fig. S5.
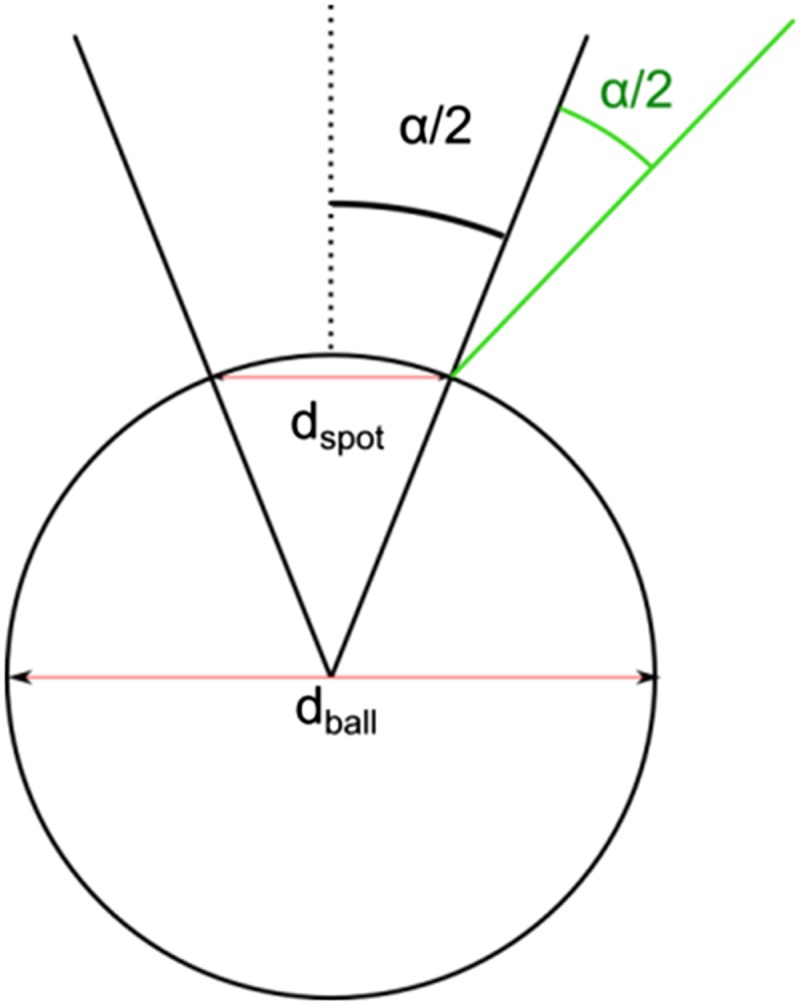
Schematic showing how the expected numerical aperture was calculated from the ratio of the diameter of the spot size to the diameter of the ball. α can be calculated by tan(dspot/dball) = α/2. This formula applies because the maximum incidence angle of light in the setup that should be seen as a bright spot on the photonic ball should be the angle for which the specular reflection is along the microscope axis; the half angle of the numerical aperture (α) satisfies this condition.
Table S1.
Comparison of the range of angles picked up by microscope lenses with different numerical apertures (N.A.) and the colored area observed in a photonic ball
| Objective lens | 5× | 10× | 20× | 50× |
| N.A. | 0.13 | 0.25 | 0.40 | 0.50 |
| Collection angle | 7° | 14° | 24° | 30° |
| Photonic balls | ||||
| dspot/dsphere | 0.1 | 0.2 | 0.24 | 0.3 |
| Calculated collection angle | 10° | 15° | 27° | 33° |
The angular range calculated from the colored area coincides with the angular range calculated from the N.A. [α = sin−1 (N.A.) for objectives used in air].
Unlike typical thin film photonic crystals, photonic balls exhibit transmission spectra that are not the inverse of the reflection; instead, only light above a critical threshold wavelength is transmitted, whereas light with energies higher than the observed reflection peak seems unable to pass the structure (Fig. 2C). Again, we attribute this unexpected behavior to the curved nature of the crystal, as schematically illustrated in Fig. 2D. Even though only light reflected normal to the ball’s surface is picked up in the reflection spectrum (resulting in a green reflection peak in the illustration), reflections also occur at different angles (although they are not picked up by the microscope as described above). Such reflections will have a larger angle between incident and reflected light, which translates to constructive interference occurring at lower wavelengths (i.e., cyan and blue light in the illustration) (33). Therefore, only light with wavelengths higher than the threshold defined by the constructive interference at normal incidence is transmitted, leading to the transmission characteristics shown in Fig. 2C. This phenomenon can be observed directly, if a photonic ball is illuminated from the (Fig. 2D).
The size of the photonic balls, and thus the confinement of the colloids, can easily be controlled synthetically. Fig. 2E exemplarily shows reflection spectra of photonic balls prepared from 250-nm colloids with a size of 15 µm, 30 µm, and 100 µm (to-scale microscope images are shown in Fig. 2F, Insets). With increasing size of the photonic ball, the intensity of the Bragg reflection peak increases and reaches values close to saturation for balls with a size of 50 µm (Fig. 2F). This indicates an increase in crystallinity as a result of a less severe confinement with increasing ball size. We then compare the measured reflected light intensity for different ball diameters with simulated values of multilayer reflection with increasing numbers of crystalline layers (Fig. 2F). The measured reflectivities closely follow the simulated values, indicating that the amount of order is directly correlated to the degree of confinement. Consequently, we can use optical information to indirectly assess the degree of internal order of individual photonic balls by comparing the measured and simulated intensity of reflected light.
Mitigating Scattering by Incorporation of Spectrally Selective Absorbers.
The spherical confinement of the photonic balls inherently induces disorder in the colloidal arrangement, leading to a whitish appearance due to scattering. To create structural color with high chromatic values, the nonresonant scattering needs to be controlled. The addition of broadband absorbers (for example, carbon black) can suppress scattering, increasing the contrast between spectral background and Bragg diffraction peak (34, 35). However, the Bragg peak itself can decreased as well due to the unselective nature of absorption. In contrast, light absorption of noble metal nanoparticles at their plasmon resonance frequency occurs over a rather narrow part of the visible spectrum and can be tuned by changing size and shape of the metal nanoparticle (36). Such nanoparticles can serve as spectrally selective absorbers that absorb scattered light at undesired wavelengths (37). Most importantly, their absorption frequency can be tailored to minimize interference with the Bragg diffraction peak of the photonic crystal. This leads to a purification of the optical spectrum by suppression of the intensity of scattered light from undesired parts of the spectrum with minor effects on the intensity of the Bragg peak.
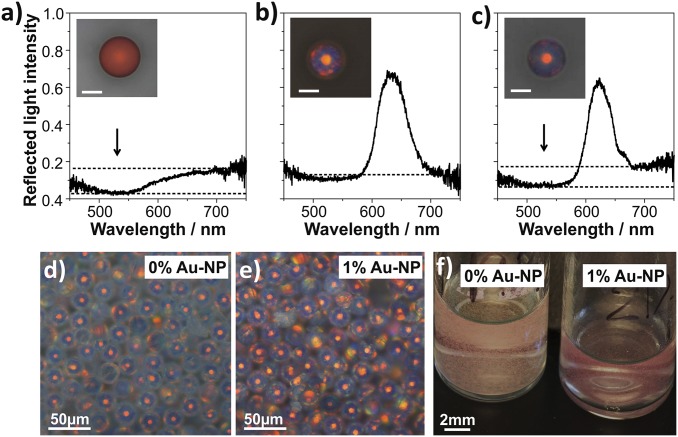
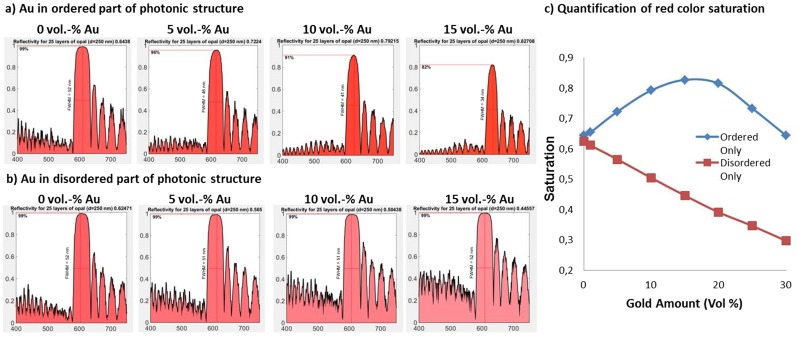
Here, we use 12-nm gold nanoparticles (details in SI Materials and Methods) to mitigate the whitish appearance caused by the presence of disorder, producing a more crisp red coloration as demonstrated in Fig. 3. Due to their small size, the gold nanoparticles do not interfere with the assembly of the colloidal particles, enabling the creation of hybrid photonic–plasmonic balls (38). Fig. 3 A–C shows single-particle spectra of three different types of such hybrid balls. A disordered ball containing gold nanoparticles, prepared by mixing two populations of colloidal particles with diameters of 200 nm and 250 nm chosen to induce disorder by lattice mismatch, does not show a Bragg reflection peak (Fig. 3A). The plasmon resonance of the gold nanoparticles leads to a dip in the reflection spectrum at 520 nm, indicated by an arrow in Fig. 3A, resulting in a dull, reddish appearance. An ordered photonic ball, consisting of 250-nm colloids without gold nanoparticles, is shown in Fig. 3B, with a red color stemming from the Bragg diffraction peak at 600 nm. Figure 3B shows a photonic ball without gold nanoparticles that shows a Bragg diffraction peak at 620 nm. The addition of gold nanoparticles to an ordered photonic ball (Fig. 3C) combines the two spectral features: A dip in reflection, caused by the plasmon resonance, lowers the reflected light intensity in the lower-wavelength (blue/green) part of the spectrum but does not affect the higher-wavelength (red) region with the Bragg peak. Theoretical investigations reveal that the position of the gold nanoparticles within the ball strongly influences the purification effect: Positioning the particles within the ordered parts of the photonic structures increases color saturation whereas absorbers placed selectively in the disordered part decrease color saturation (Fig. S6). Simulations reveal an optimal absorber concentration of approximately 15% gold by volume (Fig. S6), when gold nanoparticles are placed exclusively in an idealized, ordered colloidal crystal.
Fig. 3.
Color purification by incorporation of spectrally selective absorbers. (A) Reflection spectra of a disordered photonic ball (binary mixture of colloids with d = 200 nm and 250 nm) with 12-nm Au nanoparticles (NPs). The absorption of the Au NPs lowers the reflection of light in the blue/green part of the spectrum (arrow), giving the ball a dull, red appearance (A, Inset). (B) An ordered photonic ball (dcolloids = 250 nm) shows a Bragg reflection peak at 620 nm, leading to a bright, red color (Inset). (C) An ordered photonic ball with gold nanoparticles shows lowered reflection at the blue/green part of the spectrum without affecting the Bragg reflection peak. (D–F) Control of scattering properties by addition of Au NPs in ensembles of photonic balls. Microscopic images (D and E, taken with identical exposure times) and macroscopic images (F) reveal an increased contrast.
Fig. S6.
Effect of nanoparticle addition, concentration, and position within the photonic ball on the structural color, examined by one-dimensional (1D) transfer matrix simulations. (A and B) Effect of position and concentration of gold nanoparticles within the photonic structure. (A) Gold nanoparticles placed within the periodic structure; (B) gold nanoparticles placed in the disordered region underneath the periodic structure. (C) Dependence of the extracted red color saturation on the amount of gold nanoparticles added to the photonic structure.
The effect of nanoparticle addition becomes much more apparent in ensembles of photonic balls. Microscope images taken with identical exposure times, shown in Fig. 3 D and E, as well as a macroscopic photograph (Fig. 3F) reveal a whitish appearance of plain photonic balls due to unselective light scattering. The selective suppression of scattered light at lower wavelengths by absorption of light by the gold nanoparticles increases the contrast with little effect on the color intensity, resulting in a macroscopically more crisp color.
Coloration Arising from Grating Diffraction.
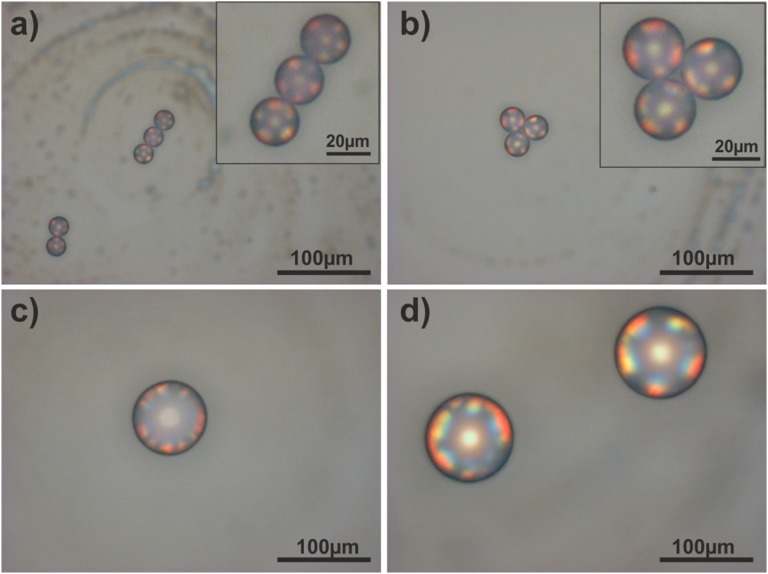
Photonic balls assembled from colloids with a diameter above 400 nm show color patterns that differ substantially from their analogs with smaller colloid sizes. Bright, multichromatic color patches appear at the outer regions of the photonic ball, showing color travel from blue to red with increasing distance from the center. This contrasts with the uniform coloration with colorless rims observed for photonic balls from colloids with sizes smaller than 400 nm. Previously, such color patterns in larger colloid assemblies were attributed to Bragg diffraction from different crystal planes (24) and grating diffraction effects (38). Here, we present further evidence that Bragg diffraction from different crystal planes is an unlikely origin of color patterns and that diffraction-grating effects, arising from periodic arrangements of colloids at the surface of our micron-scale photonic balls, are responsible for the optical effect. A representative SEM image (ball diameter 15 µm), highlighting the ordered, close-packed arrangement of 400-nm colloids at the surface of the spherical superstructure, is shown in Fig. 4A. A microscope image of a larger photonic ball (d = 100 µm) from similar-sized colloids, shown in Fig. 4B, shows strong rainbow colors extending toward the rim. The lateral distribution of colors is not affected by the ball size (38) and can be seen in all samples with photonic ball diameters between 15 µm and 100 µm (Fig. S7). Clearly, the coloration is characterized by a gradual change from blue to red. Such a color travel is characteristic of grating diffraction, as described by the grating equation, mλ = d(sin θi + sin θm) (39). For each diffraction order m, the wavelength of constructive interference (λ) changes with increasing angles of incident light (θi) and reflected light (θm) and with the distance (d) between the individual scatterers. In contrast, were the colors to arise from Bragg diffraction at different crystal planes, few distinctive colors would be observed.
Fig. 4.

Observation of grating diffraction from the periodic surface structures of photonic balls. (A and B) SEM and optical micrographs of photonic balls prepared from 400-nm colloids. Diffraction-grating colors, arising from the periodic arrangements of the colloids at the ball’s surface, are visible toward the rims of the ball. (Scale bars, 10 µm.) (C) Model of the photonic ball’s surface as a one-dimensional, curved diffraction grating and angular distribution of colors at different parts of the curved surface. Only light that is reflected back with a small range of angles (defined by the N.A. of the objective, indicated as a dotted cone in the image) close to normal to the surface from the grating is picked up by the objective lens and appears as color on the ball’s surface. Because the incident angle increases from point 1 to point 4, light with increasing wavelengths is back-reflected into the lens. (D) Spatial distribution of the color predicted by the model, plotted on a circular surface mimicking the top-view image of the ball. The positions of color in the model and micrograph coincide.
Fig. S7.
(A–D) Grating colors on differently sized photonic balls (A, 15μm; B, 30μm; C, 60μm; D, 90μm), all prepared from 400-nm colloids. The position of the colors does not change with the size of the balls.
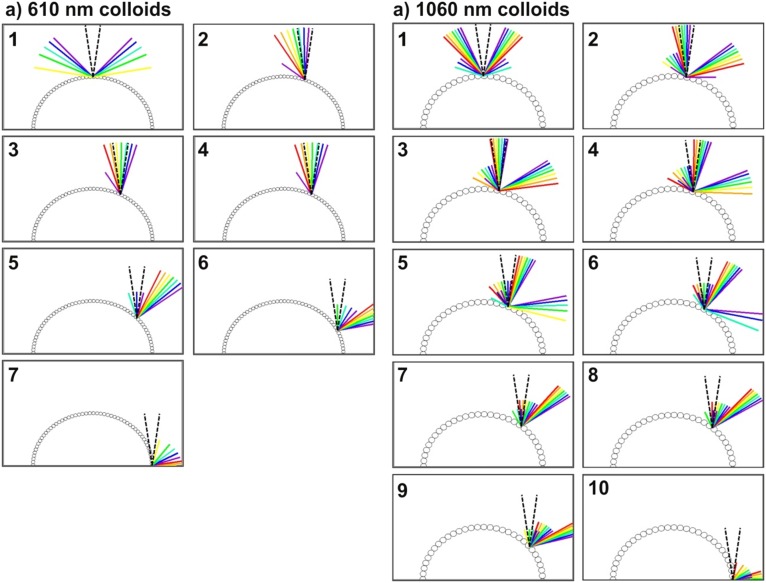
To resolve the origin of the coloration, we model the surface of a photonic ball as a regularly spaced arrangement of spheres on a hemispherical substrate, as shown in Fig. 4C. We assume that the colloids serve as a curved diffraction grating and calculate the angular distributions of constructively interfering waves for different colors from the grating equation for different positions along the surface. Although the illumination is fixed from the top (normal to the substrate plane), the angle that the incoming light beam forms with the ball’s surface differs at different positions as a result of the curved nature of the photonic ball. It is necessary to keep in mind that only light reflected in a small range of angles given by the numerical aperture around the surface normal (with respect to the substrate plane, not the ball surface) is collected by the microscope objective lens (indicated by dotted cones in Fig. 4C). Colors that are visible in the microscope image must therefore be reflected at angles within this cone. Because the angle of incident light with the curved surface changes with increasing distance from the center, so does the wavelength of light constructively interfering at angles that can be picked up by the objective lens. As we move the beam away from the center (Fig. 4 C, 1), grating diffraction predicts the shortest wavelength (blue light, modeled at 400 nm) to be picked up by the microscope first (Fig. 4 C, 2). With increasing distance from the center, the light arriving in the microscope changes gradually along the visible spectrum via green (550 nm, Fig. 4 C, 3) toward red (750 nm), which the model predicts to reach the objective lens only by reflection close to the rim (Fig. 4 C, 4).
To facilitate comparison between model and experimentally observed coloration, we present the results of the model in a top-view representation in Fig. 4D. Light of a given wavelength that is collected by the microscope objective at a given distance from the center is represented by a colored dot. We choose to illustrate the data obtained by the 1D model on the surface of a disk, representing the photonic ball as seen in a microscope, and assign a sixfold symmetry for the color map to depict the symmetry of a colloidal crystal. Image analysis, performed by measuring the distance of different color patches from the center of the photonic ball, reveals quantitative agreement on the color position between model and experiment (Table S2).
Table S2.
Distance of selected colors represented as wavelengths λ (blue, 400 nm; green, 550 nm; red, 750 nm) from the ball center calculated from the diffraction-grating equation (rcalc) and measured from microscopy images (rmeas) as fractions of the ball radius rball for all visible diffraction orders (D.O.)
| dcolloid, nm | D.O | λ, nm | rcalc/rball | rmeas/rball | σ, % |
| 400 | 1 | 400 | 0.50 | 0.44 ± 0.06 | 11.8 |
| 550 | 0.69 | 0.62 ± 0.05 | 10.0 | ||
| 750 | 0.94 | 0.91 ± 0.04 | 3.4 | ||
| 610 | 1 | 400 | 0.33 | 0.30 ± 0.03 | 9.7 |
| 550 | 0.45 | 0.46 ± 0.04 | 3.0 | ||
| 750 | 0.61 | 0.69 ± 0.05 | 13.7 | ||
| 2 | 400 | 0.66 | 0.62 ± 0.04 | 5.0 | |
| 550 | 0.90 | 0.81 ± 0.05 | 10.5 | ||
| 1,060 | 1 | 400 | 0.19 | 0.19 ± 0.02 | 0.6 |
| 550 | 0.26 | 0.30 ± 0.03 | 14.7 | ||
| 750 | 0.35 | 0.40 ± 0.04 | 14.6 | ||
| 2 | 400 | 0.38 | 0.41 ± 0.04 | 9.0 | |
| 550 | 0.52 | 0.52 ± 0.03 | 0.5 | ||
| 750 | 0.71 | 0.63 ± 0.03 | 11.5 | ||
| 3 | 400 | 0.57 | 0.64 ± 0.03 | 13.3 | |
| 550 | 0.78 | 0.77 ± 0.03 | 1.4 | ||
| 750 | 1.00 | 0.91 ± 0.02 | 9.5 | ||
| 610* | 1 | 400 | 0.33 | 0.27 ± 0.01 | 16.3 |
| 550 | 0.45 | 0.45 ± 0.04 | 0.7 | ||
| 750 | 0.61 | 0.73 ± 0.03 | 19.3 | ||
| 2 | 400 | 0.66 | 0.65 ± 0.02 | 1.4 | |
| 550 | 0.90 | 0.81 ± 0.05 | 10.8 |
Monolayer-on-microsphere architecture.
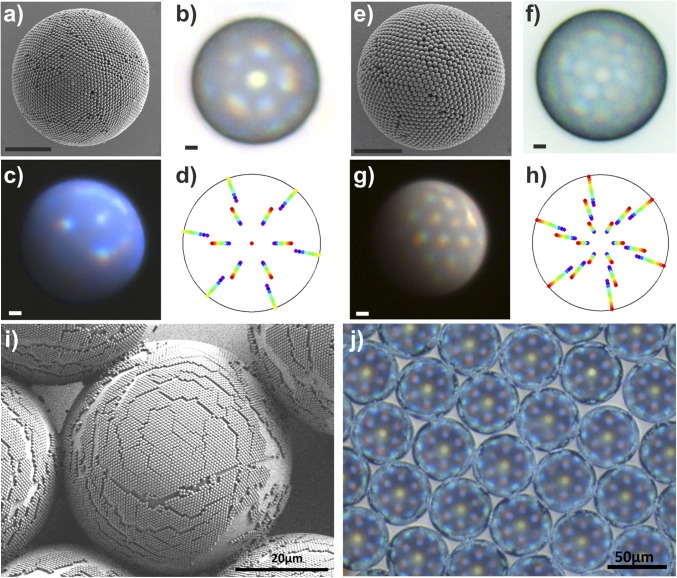
From the grating diffraction model, we expect a shift of the diffracted colors toward lower angles with larger periodicities. For the photonic balls, this translates into a shift of the rainbow-colored patches toward the center of the ball if the size of the constituent colloids is increased (38). The theory also predicts the appearance of higher-diffraction orders at larger angles (39), which should be observed at locations farther from the center of the ball. Indeed, both features are visible in the optical micrographs shown in Fig. 5. Photonic balls assembled from 610-nm colloids illuminated from the top and side are shown in Fig. 5 B and C, with a second grating order visible toward the rim of the structure. The position of the individual colors again coincides with the model quantitatively (Table 1 and Fig. S8). More remarkably, in photonic balls from 1,060-nm colloids (Fig. 5 F and G), three diffraction orders are visible and can be correlated with the model (Fig. 5, Table S2, and Fig. S8). The color patches assigned to the individual diffraction orders in the model (Fig. 5 D and H) are offset for better visibility.
Fig. 5.
Multiple diffraction orders are observed in photonic balls from larger colloids. (A–D) SEM micrograph (A) and optical properties (B and C) of photonic balls prepared from 610-nm colloids. Two diffraction orders are visible as polychromatic spots in the optical micrographs in top (B) and side (C) illumination. The positions of the colors on the ball coincide with theoretical expectations based on a 1D model of grating diffraction on a curved surface (D). (E–H) SEM micrograph (E) and optical properties (F and G) of photonic balls prepared from 1,060-nm colloids. The optical micrographs in top (F) and side (G) illumination show three diffraction orders, the position of which coincides with theoretical expectations (H). The color patches assigned to the individual diffraction orders in the model are slightly offset for better visibility. (All scale bars, 10 µm.) (I and J) SEM and optical micrographs of a close-packed monolayer of 610-nm colloids deposited onto a 50-µm bead, mimicking the periodic arrangement of the colloids at the surface of a photonic ball. The monolayer-on-microbead architecture shows similar coloration, implying that grating diffraction is the origin of the color.
Table 1.
Lateral positions of selected colors observed experimentally (rmeas) and calculated from the diffraction-grating equation (rcalc) for 3D photonic balls and monolayer-on-microsphere architecture (both from 610-nm colloids)
| D.O. | λ, nm | rcalc/rball | rmeas/rball | Discrepancy, % |
| Photonic balls (dcoll = 610 nm) | ||||
| 1 | 400 | 0.33 | 0.30 ± 0.03 | 9.7 |
| 550 | 0.45 | 0.46 ± 0.04 | 3.0 | |
| 750 | 0.61 | 0.69 ± 0.05 | 13.7 | |
| 2 | 400 | 0.66 | 0.62 ± 0.04 | 5.0 |
| 550 | 0.90 | 0.81 ± 0.05 | 10.5 | |
| Monolayer-on-microbead architecture (dcoll = 610 nm) | ||||
| 1 | 400 | 0.33 | 0.27 ± 0.01 | 16.3 |
| 550 | 0.45 | 0.45 ± 0.04 | 0.7 | |
| 750 | 0.61 | 0.73 ± 0.03 | 19.3 | |
| 2 | 400 | 0.66 | 0.65 ± 0.02 | 1.4 |
| 550 | 0.90 | 0.81 ± 0.05 | 10.8 | |
Data are presented as fractions of the ball radius rball for the different diffraction orders (D.O.).
Fig. S8.
(A and B) Simulated grating diffraction from periodic arrangements of colloids at the balls’ surfaces for 610-nm colloids (A) and 1,060-nm colloids (B). The plots in Fig. 5 of the main text show the colors collected by the objective lens (i.e., the colors in the dashed-stripe cone) as they appear with increasing distance from the ball center.
To unambiguously assign the observed color to grating diffraction and not Bragg diffraction (24, 38), we coat large, 50-µm polystyrene microbeads with a monolayer of 610-nm colloids—the same particles used to assemble the photonic balls in Fig. 4 A–C—following a protocol from the literature (40). This monolayer-on-microbead architecture, shown in Fig. 5I, mimics the surface of a photonic ball but not its crystalline interior. Therefore, it cannot show Bragg diffraction. However, in the optical microscope image shown in Fig. 5J, we observe similar color patterns to those for the 3D photonic ball, with matching lateral position of the colors (Table 1). Therefore, we conclude that we indeed observe diffraction-grating effects on individual microscale photonic balls.
Conclusion
We explore how hierarchical order influences the properties of a self-assembled structure by studying individual microscale spherical colloidal crystals, known as photonic balls. Curvature, imposed on the colloidal crystal through the spherical confinement of an emulsion droplet, is the key element that alters the properties of the assembly. We provide a complete physical understanding of all optical effects observable in the prepared photonic balls and connect them to their structural origins.
FIB-assisted cross-sectioning indicates a layered morphology in the photonic balls that consists of radially ordered layers stacked from the interface toward the interior and a more disordered assembly towards the center. The layered structure gives rise to structural coloration by Bragg diffraction. When observed in a microscope, the presence of curvature creates uniform, angle-independent colors with a distinct colored ball area that reflects the numerical aperture of the objective. In contrast to flat opal films, the transmission spectra of a photonic ball are not the inversion of the reflection spectra but resemble a long-pass filter—again caused by reflection of light from the curved crystal. We control the degree of crystallinity via the size of the photonic balls and correlate the internal structure with the observed color intensity. Furthermore, we show that gold nanoparticles can be used as spectrally selective absorbers to suppress scattering, leading to a macroscopically brighter color. We present evidence that photonic balls assembled from colloids with a diameter of 400 nm or larger show diffraction-grating coloration arising from the periodic arrangement of colloids at the surface of the particles.
We anticipate these results will lead to several research directions. First, additional insight into crystallization in spherical confinements, especially with respect to the crystallization mechanism and its kinetics, is needed to understand and control the assembly of colloids into spherical superstructures. Second, if the quality of the photonic balls can be reproducibly provided, they may serve as interesting materials for potential use as miniaturized photonic elements, for example as long-pass filters, diffraction gratings, or colorimetric sensors; in (optical) laboratory-on-a-chip applications; or as dispersible structural color pigments. Finally, the use of photonic balls as building blocks to create higher levels of hierarchy by self-assembly into more complex superstructures is a promising approach to further refine and exploit their rich optical properties.
Materials and Methods
Colloidal particles were synthesized by surfactant-free emulsion polymerization with acrylic acid as comonomer (41). PEG-modified gold nanoparticles with a size of 12 nm were synthesized by reduction of sodium tetrachloroaurate (Fig. S9) as described in the literature (42). Microfluidic devices were prepared by soft lithography from masters prepared by photolithography (31). Simulation of the optical properties was performed as a 1D transfer matrix method implemented in Matlab and effects of gold nanoparticles were included by adjusting the refractive index profile (43). Optical spectra of individual photonic balls were measured through a microscope objective lens. All procedures are described in detail in SI Materials and Methods.
Fig. S9.
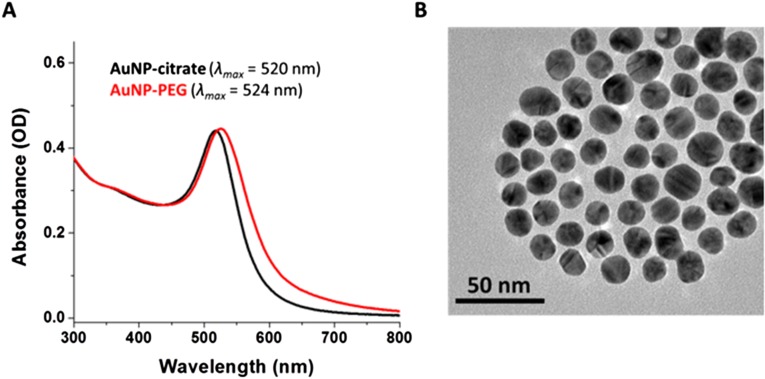
(A) UV-vis absorption spectra of citrate-capped AuNPs (black trace) and PEG-modified AuNPs (red trace) in water. (B) Representative TEM image of PEG-modified AuNPs.
SI Materials and Methods
Styrene, acrylic acid, ammonium peroxodisulfate, sodium citrate, sodium tetrachloroaurate dihydrate, and methoxy-poly(ethylene glycol)-thiol (mPEG-SH) (Mr = 5,000) were purchased from Sigma Aldrich and used as received. Poly(dimethylsiloxane) (PDMS) was purchased as a two-component system (Sylgard 184) from Dow Corning. The fluorinated oil HFE-7500 was purchased from 3M.
Electron microscopy was performed on a Zeiss Ultra Plus scanning electron microscope. Cross sections of photonic balls were performed on a Zeiss NVision 40 focused ion beam.
Polystyrene colloidal particles were synthesized by surfactant-free emulsion polymerization, using acrylic acid as comonomer and ammonium peroxodisulfate as an initiator following a recipe from the literature (41).
Polyethylene glycol (PEG) modified gold nanoparticles (AuNP-PEG) were synthesized from a solution of citrate-stabilized gold NPs, which were prepared according to a modified literature procedure (42). Briefly, sodium citrate (50 mg, 0.17 mmol) was added to a refluxing, vigorously stirred solution of sodium tetrachloroaurate dihydrate (25 mg, 0.065 mmol) in 120 mL ultrapure water (MilliQ system). The mixture was stirred under reflux for 15 min before it was allowed to cool to room temperature. The initially yellow solution changed to deep red and was stored in a glass bottle protected from light. The AuNP formation was confirmed by UV-Vis spectroscopy (λmax ∼ 520 nm in water) and by TEM (D ∼ 12 nm). The calculated amount of AuNPs in the as-prepared solution was ∼1.4 × 10¹⁵ NPs and the concentration was ∼16 nM. Subsequently, mPEG-SH (Mr = 5,000) was covalently grafted to the surface of the AuNP following a literature protocol (42). Briefly, 2 mL of mPEG-SH (25 mg/mL) solution was added dropwise to the vigorously stirred as-prepared AuNP solution. The solution was stirred for 3 h, allowing citrate ligands to exchange with mPEG-SH (Fig. S9). PEG-modified particles were then centrifuged (20,800 × g, 1 h) twice to remove excess mPEG-SH and concentrated to 12 mL to give an ∼160-nM AuNP-PEG solution.
Microfluidic Fabrication of Photonic Balls.
Device fabrication.
Microfluidic devices were fabricated by soft lithography. Negative photoresist SU-8 (MicroChem, Newton, MA, USA) was spin coated onto a clean silicon wafer to a thickness of 10 µm, 25 µm, or 50 µm and patterned by UV exposure through a transparency photomask (CAD/Art Service). After developing the microstructure, a mixture of Sylgard 184 PDMS (Dow Corning) and curing agent (ratio 10:1) was poured onto the pattern, degassed, and cured overnight at 65 °C. The PDMS molds were peeled off the master and the channel inlets and outlets were made by using a 0.75-mm diameter biopsy punch (Harris Uni-Core; Ted Pella). The PDMS replicas were bonded to a glass slide after oxygen-plasma activation of both surfaces and cured for 1 h at 65 °C to enhance bonding. To avoid wetting of the channels by the inner phase, the devices were treated with Aquapel (PPG Industries) by flushing the channels with the solution as received, air drying, and heating to 65 °C for 1 h.
Drop generation.
To fabricate droplets of an aqueous colloidal dispersion, the dispersion was loaded into polycarbonate syringes (BD Luer-Lok Disposable Syringes). A mixture of 0.1 wt% perfluoropolypropyleneglycol-block-polyethyleneglycol-block-perfluoropolypropyleneglycol surfactant (purchased from RainDance Technologies; Dolomite Pico Surf) in perfluorinated carbon oil (3M Novec 7500 Engineered Fluid) was used as outer phase. PE/2 tubing with an outer diameter of 1.09 mm and an inner diameter of 0.38 mm (Scientific Commodities) was used to connect the channel inlets with the syringes. Flow rates were controlled by syringe pumps (PHD 2000; Harvard Apparatus). The droplet generation was performed in a customized cross-junction device and monitored with an inverted microscope. The flow rates were 100 µL/h for the inner (colloidal dispersion) phase and 200 µL/h for the outer (fluorocarbon oil) phase.
Assembly of photonic balls.
The emulsion droplets of the colloidal dispersion in oil were collected in glass vials surface functionalized with 1H,1H,2H,2H-(tridecafluorooctyl)-trichlorosilane (Gelest) via vapor phase deposition at reduced pressure. Before silanization, the vials were activated by oxygen plasma (Diener Electronics; model femto) for 10 min. The vials with the emulsion were placed in an oven at 45 °C to allow the water to evaporate and the photonic balls to self-assemble. Depending on the amount of droplets within the vial, the drying time varied between a few minutes and several hours.
Optical Characterization.
Individual photonic balls were spectrally analyzed by illuminating them through a microscope objective (Olympus, 50× objective lens, 0.5 N.A.). Reflected light is channeled through the same objective and an additional tube lens before it is collected with an optical fiber (Ocean Optics; 100-µm core) and analyzed with a grating spectrometer (Ocean Optics; Maya Pro) controlled via the software IGOR. This procedure allows us to collect reflected light from an area of a few micrometers, small enough to probe the color of the individual photonic balls.
Computer Simulations and Theoretical Models.
A 1D transfer matrix method was implemented in Matlab, using laterally averaged permittivity values for an opal structure as shown in Fig. S3. Reflectance values were calculated for each wavelength, using this method for the various colloid sizes shown in the main text.
For the diffraction-grating models, the angular location of each color/diffraction order combination was calculated using the grating equation with the assumption that at a given position along the photonic ball, the diffraction can be modeled as that from an infinite grating with periodicity equal to the diameter of the colloids and orientation given by the tangent to the ball at that location.
Simulations were used to investigate how the concentration and position of nanoparticle absorbers affects the color of photonic balls (Fig. S6). The simulations are performed using 25 ordered layers with a refractive index profile matching that of a colloidal crystal (compare with Fig. S3) and a random refractive index material underneath the multilayer structure, approximating the more disordered interior regions. Gold nanoparticles were simulated by calculating the effective refractive index of the air/gold nanoparticle composite medium used in the transfer matrix calculations, using a method from the literature (43). The resulting macroscopic color is indicated by the color underneath the simulated reflection curve. The color intensity is calculated by using the CIE 1931 (Commission Internationale de l'Eclairage; International Commission on Illumination) tristimulus color-matching functions to convert the spectra into RGB (red, green, blue) values and then converting to the HSV (hue, saturation, value) color space and plotting the saturation value.
Positioning the particles in the ordered layers results in color purification because the decrease in reflected light intensity primarily occurs in the high-energy part of the spectrum (Fig. S6A). With increasing amount of gold nanoparticles, the total absorption increases and increasingly also suppresses the Bragg peak due to the nonzero absorption of gold nanoparticles in the red part of the spectrum. Note that absorption is nevertheless more pronounced in the blue/green part of the spectrum. Adding nanoparticles to the disordered part does not increase saturation (Fig. S6B). On the contrary, scattering is increased due to the increase in refractive index in the randomized matrix. A maximum in color saturation exists (Fig. S6C) because of the balance between increased absorption of wavelengths off the Bragg reflection peak and increasing total absorption. The optimal scenario for color purification is a concentration of around 15 vol% of gold nanoparticles placed in the ordered layers of the photonic structures. Because the simulation assumes a uniform distribution of gold nanoparticles within the photonic ball and perfect ordering of the reflective layers, this number may differ from experimental results.
Acknowledgments
This work was supported by the National Science Foundation Materials Research Science and Engineering Center at Harvard University under Award DMR-1420570 and by the Badische Anilin und Sodafabrik's North American Center for Research on Advanced Materials. N.V. acknowledges funding of the Deutsche Forschungsgemeinschaft (DFG) through the Cluster of Excellence Engineering of Advanced Materials. S.U. acknowledges funding from DFG. K.R.P. acknowledges support from a graduate research fellowship from the Department of Defense. I.B.B. acknowledges support from a Banting Postdoctoral Fellowship funded by the Natural Sciences and Engineering Research Council of Canada. M.K. acknowledges financial support from the Massachusetts Institute of Technology Mechanical Engineering Department.
Footnotes
The authors declare no conflict of interest.
This article is a PNAS Direct Submission. R.A.P. is a guest editor invited by the Editorial Board.
This article contains supporting information online at www.pnas.org/lookup/suppl/doi:10.1073/pnas.1506272112/-/DCSupplemental.
References
- 1.Barthlott W, Neinhuis C. Purity of the sacred lotus, or escape from contamination in biological surfaces. Planta. 1997;202(1):1–8. [Google Scholar]
- 2.Aizenberg J, et al. Skeleton of Euplectella sp.: structural hierarchy from the nanoscale to the macroscale. Science. 2005;309(5732):275–278. doi: 10.1126/science.1112255. [DOI] [PubMed] [Google Scholar]
- 3.Smith BL, et al. Molecular mechanistic origin of the toughness of natural adhesives, fibres and composites. Nature. 1999;399(6738):761–763. [Google Scholar]
- 4.Srinivasarao M. Nano-optics in the biological world: Beetles, butterflies, birds, and moths. Chem Rev. 1999;99(7):1935–1962. doi: 10.1021/cr970080y. [DOI] [PubMed] [Google Scholar]
- 5.Vukusic P, Sambles JR. Photonic structures in biology. Nature. 2003;424(6950):852–855. doi: 10.1038/nature01941. [DOI] [PubMed] [Google Scholar]
- 6.Kinoshita S, Yoshioka S, Miyazaki J. Physics of structural colors. Rep Prog Phys. 2008;71(7):076401. [Google Scholar]
- 7.Kinoshita S, Yoshioka S, Kawagoe K. Mechanisms of structural colour in the Morpho butterfly: Cooperation of regularity and irregularity in an iridescent scale. Proc Biol Sci. 2002;269(1499):1417–1421. doi: 10.1098/rspb.2002.2019. [DOI] [PMC free article] [PubMed] [Google Scholar]
- 8.Luke SM, Hallam BT, Vukusic P. Structural optimization for broadband scattering in several ultra-thin white beetle scales. Appl Opt. 2010;49(22):4246–4254. doi: 10.1364/AO.49.004246. [DOI] [PubMed] [Google Scholar]
- 9.Stavenga DG, Leertouwer HL, Marshall NJ, Osorio D. Dramatic colour changes in a bird of paradise caused by uniquely structured breast feather barbules. Proc R Soc B Biol Sci. 2011;278(1715):2098–2104. doi: 10.1098/rspb.2010.2293. [DOI] [PMC free article] [PubMed] [Google Scholar]
- 10.Shawkey MD, Hill GE. Significance of a basal melanin layer to production of non-iridescent structural plumage color: Evidence from an amelanotic Steller’s jay (Cyanocitta stelleri) J Exp Biol. 2006;209(Pt 7):1245–1250. doi: 10.1242/jeb.02115. [DOI] [PubMed] [Google Scholar]
- 11.Pfaff G, Reynders P. Angle-dependent optical effects deriving from submicron structures of films and pigments. Chem Rev. 1999;99(7):1963–1982. doi: 10.1021/cr970075u. [DOI] [PubMed] [Google Scholar]
- 12.Klupp Taylor RN, et al. Painting by numbers: Nanoparticle-based colorants in the post-empirical age. Adv Mater. 2011;23(22–23):2554–2570. doi: 10.1002/adma.201100541. [DOI] [PubMed] [Google Scholar]
- 13.Galisteo-López JF, et al. Self-assembled photonic structures. Adv Mater. 2011;23(1):30–69. doi: 10.1002/adma.201000356. [DOI] [PubMed] [Google Scholar]
- 14.Vogel N, Weiss CK, Landfester K. From soft to hard: The generation of functional and complex colloidal monolayers for nanolithography. Soft Matter. 2012;8(15):4044–4061. [Google Scholar]
- 15.von Freymann G, Kitaev V, Lotsch BV, Ozin GA. Bottom-up assembly of photonic crystals. Chem Soc Rev. 2013;42(7):2528–2554. doi: 10.1039/c2cs35309a. [DOI] [PubMed] [Google Scholar]
- 16.Velev OD, Lenhoff AM, Kaler EW. A class of microstructured particles through colloidal crystallization. Science. 2000;287(5461):2240–2243. doi: 10.1126/science.287.5461.2240. [DOI] [PubMed] [Google Scholar]
- 17.Yi GR, et al. Monodisperse micrometer-scale spherical assemblies of polymer particles. Adv Mater. 2002;14(16):1137–1140. [Google Scholar]
- 18.Brugarolas T, Tu F, Lee D. Directed assembly of particles using microfluidic droplets and bubbles. Soft Matter. 2013;9(38):9046–9058. [Google Scholar]
- 19.Zhao Y, Shang L, Cheng Y, Gu Z. Spherical colloidal photonic crystals. Acc Chem Res. 2014;47(12):3632–3642. doi: 10.1021/ar500317s. [DOI] [PubMed] [Google Scholar]
- 20.Bausch AR, et al. Grain boundary scars and spherical crystallography. Science. 2003;299(5613):1716–1718. doi: 10.1126/science.1081160. [DOI] [PubMed] [Google Scholar]
- 21.Meng G, Paulose J, Nelson DR, Manoharan VN. Elastic instability of a crystal growing on a curved surface. Science. 2014;343(6171):634–637. doi: 10.1126/science.1244827. [DOI] [PubMed] [Google Scholar]
- 22.de Nijs B, et al. Entropy-driven formation of large icosahedral colloidal clusters by spherical confinement. Nat Mater. 2015;14(1):56–60. doi: 10.1038/nmat4072. [DOI] [PubMed] [Google Scholar]
- 23.Kim SH, Lee SY, Yi GR, Pine DJ, Yang SM. Microwave-assisted self-organization of colloidal particles in confining aqueous droplets. J Am Chem Soc. 2006;128(33):10897–10904. doi: 10.1021/ja063528y. [DOI] [PubMed] [Google Scholar]
- 24.Kim SH, Jeon SJ, Yang SM. Optofluidic encapsulation of crystalline colloidal arrays into spherical membrane. J Am Chem Soc. 2008;130(18):6040–6046. doi: 10.1021/ja800844w. [DOI] [PubMed] [Google Scholar]
- 25.Yu Z, Wang CF, Ling L, Chen L, Chen S. Triphase microfluidic-directed self-assembly: Anisotropic colloidal photonic crystal supraparticles and multicolor patterns made easy. Angew Chem Int Ed Engl. 2012;51(10):2375–2378. doi: 10.1002/anie.201107126. [DOI] [PubMed] [Google Scholar]
- 26.Kim S-H, Park J-G, Choi TM, Manoharan VN, Weitz DA. Osmotic-pressure-controlled concentration of colloidal particles in thin-shelled capsules. Nat Commun. 2014;5:3068. doi: 10.1038/ncomms4068. [DOI] [PubMed] [Google Scholar]
- 27.Xie Z, et al. An optical nose chip based on mesoporous colloidal photonic crystal beads. Adv Mater. 2014;26(15):2413–2418. doi: 10.1002/adma.201304775. [DOI] [PubMed] [Google Scholar]
- 28.Kim J, et al. Real-time optofluidic synthesis of magnetochromatic microspheres for reversible structural color patterning. Small. 2011;7(9):1163–1168. doi: 10.1002/smll.201001822. [DOI] [PubMed] [Google Scholar]
- 29.Zhao X, et al. Colloidal crystal beads as supports for biomolecular screening. Angew Chem Int Ed Engl. 2006;45(41):6835–6838. doi: 10.1002/anie.200601302. [DOI] [PubMed] [Google Scholar]
- 30.Liu W, et al. Photonic crystal encoded microcarriers for biomaterial evaluation. Small. 2014;10(1):88–93. doi: 10.1002/smll.201301253. [DOI] [PubMed] [Google Scholar]
- 31.Utada AS, et al. Dripping, jetting, drops, and wetting: The magic of microfluidics. MRS Bull. 2007;32(09):702–708. [Google Scholar]
- 32.Anna SL, Bontoux N, Stone HA. Formation of dispersions using “flow focusing” in microchannels. Appl Phys Lett. 2003;82(3):364–366. [Google Scholar]
- 33.Phillips KR, et al. Tunable anisotropy in inverse opals and emerging optical properties. Chem Mater. 2014;26(4):1622–1628. [Google Scholar]
- 34.Aguirre CI, Reguera E, Stein A. Colloidal photonic crystal pigments with low angle dependence. ACS Appl Mater Interfaces. 2010;2(11):3257–3262. doi: 10.1021/am100704f. [DOI] [PubMed] [Google Scholar]
- 35.Pursiainen OL, et al. Nanoparticle-tuned structural color from polymer opals. Opt Express. 2007;15(15):9553–9561. doi: 10.1364/oe.15.009553. [DOI] [PubMed] [Google Scholar]
- 36.Eustis S, el-Sayed MA. Why gold nanoparticles are more precious than pretty gold: Noble metal surface plasmon resonance and its enhancement of the radiative and nonradiative properties of nanocrystals of different shapes. Chem Soc Rev. 2006;35(3):209–217. doi: 10.1039/b514191e. [DOI] [PubMed] [Google Scholar]
- 37.Koay N, et al. Hierarchical structural control of visual properties in self-assembled photonic-plasmonic pigments. Opt Express. 2014;22(23):27750–27768. doi: 10.1364/OE.22.027750. [DOI] [PubMed] [Google Scholar]
- 38.Rastogi V, et al. Synthesis of light-diffracting assemblies from microspheres and nanoparticles in droplets on a superhydrophobic surface. Adv Mater. 2008;20(22):4263–4268. [Google Scholar]
- 39.Palmer C. Diffraction Grating Handbook. Newport Corporation; Rochester, NY: 2005. [Google Scholar]
- 40.Vogel N, Goerres S, Weiss CK, Landfester K. A convenient method to produce close-packed and non-close-packed monolayers using direct assembly of colloids at the air-water interface. Macromol Chem Phys. 2011;212(212):1719–1734. [Google Scholar]
- 41.Vogel N, de Viguerie L, Jonas U, Weiss C, Landfester K. Wafer-scale fabrication of ordered binary colloidal monolayers with adjustable stoichiometries. Adv Funct Mater. 2011;21(16):3064–3073. [Google Scholar]
- 42.Fernández-López C, et al. Highly controlled silica coating of PEG-capped metal nanoparticles and preparation of SERS-encoded particles. Langmuir. 2009;25(24):13894–13899. doi: 10.1021/la9016454. [DOI] [PubMed] [Google Scholar]
- 43.Kubo S, et al. Tunability of the refractive index of gold nanoparticle dispersions. Nano Lett. 2007;7(11):3418–3423. doi: 10.1021/nl071893x. [DOI] [PubMed] [Google Scholar]


