

Significance
The rodent hippocampus contains neurons that code for space on the scale of meters, a discovery that was recently awarded a Nobel Prize. However, it remains unclear whether humans harness similar representations for memory at the scale of their lives. Our results reveal that the human hippocampus represents the spatial and temporal location of memories for real-life events at scales of up to 30 km and a month of time. They further suggest that real-world representations of space and time are more intimately entwined in the hippocampus than previously thought, validating the relevance of decades of rodent studies for human memory and providing a potential mechanism for how we weave the episodic memories of our lives.
Keywords: hippocampus, representational similarity analysis, lifelogging, episodic memory
Abstract
Memory stretches over a lifetime. In controlled laboratory settings, the hippocampus and other medial temporal lobe brain structures have been shown to represent space and time on the scale of meters and seconds. It remains unclear whether the hippocampus also represents space and time over the longer scales necessary for human episodic memory. We recorded neural activity while participants relived their own experiences, cued by photographs taken with a custom lifelogging device. We found that the left anterior hippocampus represents space and time for a month of remembered events occurring over distances of up to 30 km. Although previous studies have identified similar drifts in representational similarity across space or time over the relatively brief time scales (seconds to minutes) that characterize individual episodic memories, our results provide compelling evidence that a similar pattern of spatiotemporal organization also exists for organizing distinct memories that are distant in space and time. These results further support the emerging view that the anterior, as opposed to posterior, hippocampus integrates distinct experiences, thereby providing a scaffold for encoding and retrieval of autobiographical memories on the scale of our lives.
The hippocampus plays a critical role in remembering the events of our lives (1). Direct evidence from single-neuron recordings in rats indicates that cells in the hippocampus fire in specific spatial locations (2–6) or at specific times during a temporal delay (7, 8). Single-neuron and functional MRI (fMRI) studies in individuals navigating virtual environments have confirmed that cells coding for spatial location are also present in the human hippocampus (9–11). Similarly, place-responsive cell activity recorded in the hippocampus of patients with epilepsy during navigation of a virtual town was shown to reinstate during episodic memory retrieval of the previous virtual navigation (12). Together, these studies provide evidence that the same neurons in the medial temporal lobe (MTL) that are active during an experience also help represent the memory for that experience. These results, however, are limited to simple events in laboratory settings that occur on the scale of minutes and meters, thereby leaving unanswered whether we harness similar mechanisms in more natural settings and over larger temporal and spatial scales.
Recent studies have used more naturalistic designs with incidentally acquired memories recorded via lifelogging devices that automatically capture photographs from the participants’ lives (13, 14). The typical finding is increased hippocampal activation when participants view images from their cameras as opposed to images from other participants’ cameras (15–17), and this activation decays over the course of months (14). Still, there is no evidence to date that the hippocampus or other MTL structures actually represent space or time of autobiographical experiences. We addressed this question by having participants relive their own real-life experiences in the fMRI scanner. We then used multivariate pattern analysis (18) to identify regions of the MTL that represent space and time of these remembered experiences. If a brain region represented either space or time of personal experiences, the distances between neural activity patterns would correlate with the spatial or temporal proximity of the original experiences.
Results
Nine participants wore smart phones (Fig. S1) with our custom lifelogging software that captured images along with their global positioning system (GPS) coordinates and timestamps (19). We collected an average of 5,414 ± 578 SEM images per subject, primarily from the Columbus, Ohio metropolitan area (Fig. 1A). We selected 120 images from each participant’s data to present to the participant in the fMRI scanner (Methods). Participants were instructed to “try to remember the event depicted in the picture, and try to mentally relive your experience” while viewing each image for 8 s. Focusing only on the memories subjects recalled (63.4% ± 4.7 SEM per subject; Fig. S2), we calculated the temporal and geospatial distance for each pair of events and the corresponding neural distances for four bilateral MTL regions and one bilateral primary visual cortex region of interest (ROI) (Fig. 1 B–D). We excluded image pairs taken close together in space or time to prevent directly overlapping events (Methods and Fig. S3). After applying these selection criteria, we had an average of 76.1 ± 5.7 SEM images and 1,995.7 ± 261.5 SEM image pairs per subject.
Fig. S1.

Example of an Android smartphone in a pouch used for data collection.
Fig. 1.

Overview of study method. (A) Heat map of locations where images from all subjects were taken. (B) MTL ROIs (red, anterior hippocampus; yellow, middle hippocampus; blue, posterior hippocampus; green, parahippocampus). (C) Subset of the data collected from a single participant. Each red point on the map corresponds to an image shown to the participant in the scanner. Four sample images are displayed, along with the time taken, with the lines indicating the location. The heat maps show the single-trial beta corresponding to each image. (D) Example of the spatial, temporal, and neural distance matrices derived from these four sample images. (Map data courtesy of the US Geological Survey.)
Fig. S2.

Memory performance. This figure shows the percentage of presented images recalled by each participant. The average recall performance was 63.4%, although performance is not normally distributed across subjects.
Fig. S3.

Spatial and temporal distances between pairs of images. (A) Spatial and temporal distances for each pair of images from all subjects. Spatial and temporal distances were only calculated for image pairs if both images were collected by the same subject. The color of the dot indicates the density of points in that region. To be included in subsequent analyses, we required that image pairs have a spatial distance between 100 m and 30 km and a temporal distance greater than 16 h. Image pairs with a distance of 0 m are not shown. (B) Image pairs meeting these criteria are shown.
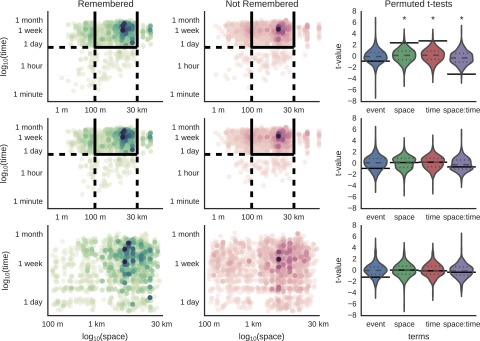
We applied representational similarity analysis to identify whether regions of the MTL reflect the spatial and temporal dimensions of episodic memories (18). To quantify the role of multiple factors in a single model, we implemented a general linear model (GLM) within each subject as the basic test of our representational similarity analysis. Thus, in the eight MTL and two primary visual regions, we tested the hypothesis that differences in the patterns of neural activity while remembering events are correlated with the spatial and temporal distance separating those events. Because the temporal distance between recollection of events in the scanner could confound temporal distance between the events themselves, we included the time between image presentations as a nuisance regressor. Based on work implying scale-free neural representation of time and space (20), we calculated the log of the spatial and temporal distances between events and the times between presentations in the scanner. The pairwise nature of the distances in our analysis violates the assumption of independent samples, so we used nonparametric permutation to test for significance (21). We permuted the neural distances with respect to the behavioral distances 10,000 times to generate a null dataset from which we calculated nonparametric P values, which we then Bonferroni-corrected based on the 10 regions in our analysis. We found that spatial distance (corrected P = 0.021), temporal distance (corrected P = 0.010), and their interaction (corrected P = 0.038) were significantly correlated with neural distance in the left anterior hippocampus (Fig. 2 and Table S1). No significant correlations were found for the nonrecalled events. These results indicate that the left anterior hippocampus represents space and time for memories of real-life experiences at larger scales than ever before tested.
Fig. 2.

Space and time are correlated with neural distance in the left anterior hippocampus. (A and B) Each dot represents a pair of presented images. The black lines show the estimated neural distance based on the regression for each subject. The red line shows the estimated neural distance averaged across subjects. Spatial distance (A) and temporal distance (B) are both correlated with neural distance in the left anterior hippocampus after removing the effects of other factors in the model (i.e., after isolating the effect of space or time).
Table S1.
Permutation tests for significance of coefficients across participants in all regions of interest
| Region | Term | P | t | Beta | Region | Term | P | t | Beta |
| Left anterior hippocampus | Space | 0.005 | 5.5539 | 0.7064 | Right anterior hippocampus | Space | 0.572 | 2.1629 | 0.5777 |
| Left anterior hippocampus | Time | 0.003 | 5.893 | 0.3968 | Right anterior hippocampus | Time | 0.358 | 2.4064 | 0.3819 |
| Left anterior hippocampus | Time/space | 0.013 | −4.9247 | −0.1178 | Right anterior hippocampus | Time/space | 0.585 | −2.141 | −0.0967 |
| Left middle hippocampus | Space | 1 | 0.8261 | 0.2519 | Right middle hippocampus | Space | 1 | −0.6062 | −0.1776 |
| Left middle hippocampus | Time | 1 | 0.5760 | 0.1102 | Right middle hippocampus | Time | 1 | −0.3231 | −0.0591 |
| Left middle hippocampus | Time/space | 1 | −0.7024 | −0.0383 | Right middle hippocampus | Time/space | 1 | 0.5400 | 0.0256 |
| Left posterior hippocampus | Space | 1 | 0.6301 | 0.2048 | Right posterior hippocampus | Space | 0.818 | 1.9511 | 0.3013 |
| Left posterior hippocampus | Time | 1 | 0.7574 | 0.1321 | Right posterior hippocampus | Time | 0.208 | 2.7842 | 0.2257 |
| Left posterior hippocampus | Time/space | 1 | −0.7598 | −0.0425 | Right posterior hippocampus | Time/space | 0.691 | −2.0551 | −0.0543 |
| Left parahippocampal gyrus | Space | 1 | 1.0721 | 0.3415 | Right parahippocampal gyrus | Space | 1 | 0.8815 | 0.3841 |
| Left parahippocampal gyrus | Time | 1 | 1.1435 | 0.2078 | Right parahippocampal gyrus | Time | 1 | 0.6477 | 0.1817 |
| Left parahippocampal gyrus | Time/space | 1 | −0.9105 | −0.0545 | Right parahippocampal gyrus | Time/space | 1 | −0.7396 | −0.0590 |
| Left posterior V1 | Space | 1 | 0.5956 | 0.1690 | Right posterior V1 | Space | 0.391 | 2.4352 | 0.8240 |
| Left posterior V1 | Time | 1 | 0.7006 | 0.1216 | Right posterior V1 | Time | 0.41 | 2.4021 | 0.5108 |
| Left posterior V1 | Time/space | 1 | −0.7777 | −0.0395 | Right posterior V1 | Time/space | 0.259 | −2.6984 | −0.1441 |
Temporal distance, spatial distance, and their interaction (denoted as “time/space”) significantly predict neural distance in the left anterior hippocampus. The time between presentation of images in the scanner, referred to as “scanner time” in the model, was significant, with P < 0.002 in all regions, and is not displayed in the table above. Significant coefficients are indicated in bold. V1, primary visual cortex.
Although we attempted to remove any pairs of images that were from the same (or proximal) episode, it is still possible that some aspect of the images themselves could account for the systematic changes in neural activity in the left anterior hippocampus. As a control, we compared the magnitude of the spatial and temporal effects in the left anterior hippocampus with equivalently sized ROIs in the right and left primary visual cortex. The spatial and temporal distances were more strongly associated with neural distance in the left anterior hippocampus than in either the right anterior hippocampus or the right or left primary visual cortex (Fig. 3, Fig. S4, and SI Results), suggesting that our results are not driven simply by the image properties alone. We also ruled out the possibility that recency, proximity, or contiguity effects were responsible for the result we observed (Figs. S5–S7 and SI Results).
Fig. 3.

Comparison of space and time representations across the brain region. Space and time are significantly more strongly related to neural distance in the left anterior hippocampus (LAH) than in the right anterior hippocampus (RAH) or the right or left primary visual cortex (RV1 and LV1, respectively). *P < 0.05; **P < 0.01.
Fig. S4.

Scatter plots for neural distance vs. time, space, and their interaction with other effects removed. The black lines show the predicted neural distance based on the regression for each subject. The red line shows the predicted neural distance averaged across subjects. The left anterior hippocampus is the only region with significant effects (Bonferroni corrected P < 0.01 for space and time, P < 0.05 for their interaction). None of the other regions have a P value less than 0.1 after Bonferroni correction. m + s, meters + seconds.
Fig. S5.

Effect of recency on image recall. This figure shows the distribution of times between when images were collected and when they were assessed for recalled and not recalled events for each participant. Participant 2 showed a significant relationship between temporal recency and recall, but the direction of this effect implies weaker memory for more recent events, and it was not strong enough to survive a multiple comparison correction (t = 2.16, uncorrected P = 0.03). Participant 5 recalled the events associated with all of the presented images. Participant 6 is not shown because she dropped out of the study before the fMRI scan was collected.
Fig. S7.
Contiguity effect of space and time on subsequently recalled images. The first column shows the spatial and temporal distances between pairs of images in which the first item and the second item were both recalled. The second column shows the spatial and temporal distances between pairs of images in which the first item was recalled but the second item was not. The last column plots the distribution of across-subject t values obtained via permutation for the effect of space, time, and their interaction on memory for second items. The true value is indicated by a solid line; dashed lines indicate significance. The first row includes all pairs of images without limiting the spatial or temporal distance between them. There is a clear region between 1 and 100 m where there are more remembered items than not remembered items. This finding is reflected in the significance of space (t = 2.45, P = 0.034), time (t = 2.79, P = 0.022), and their interaction (t = −3.12, P = 0.008). The second row eliminates pairs of images from the same event, and the increased number of remembered vs. not remembered items is no longer present. The last row focuses on the data used in our main analysis, and it is clear that the spatiotemporal distributions of recalled and not recalled items are similar in this region.
SI Results
Comparison with Other Regions.
We found that the across-participant t values for the left anterior hippocampus for space and time were significantly greater than values for the right anterior hippocampus (space: delta t = 3.39, P = 0.03; time: delta t = 3.49, P = 0.02), right primary visual cortex (space: delta t = 3.11, P = 0.04; time: delta t = 3.49, P = 0.02), and left primary visual cortex (space: delta t = 4.96, P = 0.003; time: delta t = 5.19, P = 0.002) as shown in Fig. 2.
Recency and Proximity.
An alternative explanation for the relationship between time or space and the patterns of activity in the left anterior hippocampus is that this relationship may simply be a reflection of greater memory strength for more recent or nearby items. If such were the case, we would expect that participants would have improved recall for more recent/proximal events to the test location. We assessed the relationship between the recency or proximity of an event and whether or not the event was recalled with a subject level GLM, followed by an across-subjects t test on the coefficients. The model was remembered ∼ recency for the recency analysis and remembered ∼ proximity for the proximity analysis. Recency was calculated as the time between the collection of an image and the presentation of that image in the scanner. Proximity was calculated as the geodesic distance between the GPS coordinates of the fMRI scanner and the GPS coordinates of each image. We took the log base 10 of these distances to maintain consistency with our representational similarity analysis. Because this calculation was a standard logistic regression and there was not a pairwise dependence in the independent variables, we did not need to run a permutation test and could parametrically assess the significance of coefficients within and across subjects. One subject recalled all of the items presented, so this subject was excluded from this analysis, leaving eight subjects.
Only one participant (participant 2) showed a significant relationship between temporal recency and recall, but the direction of this effect implied weaker memory for more recent events, and it was not strong enough to survive a multiple comparison correction for the number of subjects (t = 2.16, uncorrected P = 0.03). There was not a significant relationship between temporal recency and recall across subjects (t = −0.87, df = 7, P = 0.41) (Fig. S4).
For the proximity analysis, only participant 7 showed a significant relationship between spatial proximity and recall, but this effect was not strong enough to survive multiple comparison correction (t = −2.54, uncorrected P = 0.01). There was not a significant relationship between spatial proximity and recall across subjects (t = −0.53, df = 8, P = 0.61) (Fig. S5).
Contiguity.
We also considered the possibility that the observed relationship between remembered episodes was not due to a representation of time and space, but that reliving an experience cued recall of other events that were temporally or spatially contiguous (46). If our results were caused by the effect of contiguity on memory strength as opposed to a representation of space or time, then we would expect to see that the likelihood of recalling an event would be dependent on the spatial or temporal proximity of that event to one that was previously recalled. We tested for this potential contiguity effect using subject-level GLMs correlating memory for the second item in each pair with the log of the spatial and temporal distance between them: 2nd_remembered ∼ space * time + scanner time.
We eliminated from this analysis image pairs that were excluded from the RSA analysis due to poor image quality for one of the images in the pair. In the first level of this analysis, we did not exclude any image pairs due to the spatial or temporal distance between them. For the second level of this analysis, we excluded images pairs that occurred in the same event. Lastly, we excluded all image pairs based on the limits from our primary analysis. Included image pairs had spatial distances between 100 m and 30 km and temporal distances greater than 15 h. Because this analysis focused on image pairs, we used 500 permutations for each level of the analysis to determine if the across-subject t test values of the model coefficients were significantly different from the null distribution of permuted values.
We found that when we included all pairs of events without limiting the spatial or temporal distance between them, participants were more likely to recall an a event on a later trial if they had previously relived an event that happened near it in space (t = 2.45, P = 0.034) or time (t = 2.79, P = 0.022) (Fig. S6). The interaction of space and time was also significant across subject (t = −3.12, P = 0.008). When we excluded pairs of images taken from the same event, coefficients for neither space (t = 0.192, P = 0.88) nor time (t = 0.26, P = 0.84), nor for their interaction (t = −0.58, P = 0.664), were significantly different from the cross-subject t values obtained in the permutations. None of the images taken from the same event were included in our main analysis. Using the limits on spatial and temporal distance from our main analysis, coefficients for neither space (t = 0.0992, P = 0.95) nor time (t = −0.0335, P = 0.902), nor their interaction (t = −0.27, P = 0.822), were significantly different from the cross-subject t values obtained in the permutations.
Fig. S6.

Effect of proximity on image recall. This figure shows the distribution of distances between the location where images were collected and the fMRI scanner for recalled and not recalled events for each participant. Participant 7 showed a significant relationship between spatial proximity and recall, but this effect was not strong enough to survive multiple comparison correction (t = −2.54, uncorrected P = 0.01). Participant 5 recalled the events associated with all of the presented images. Participant 6 is not shown because she dropped out of the study before the fMRI scan was collected.
Laterality.
Fueling a long-standing debate over the lateralization of episodic memory processes (27, 47), recent work in mice showed that the left, but not the right, hippocampus was essential for associative spatial long-term memory (28). To test whether our data followed a similar pattern, we compared the left and right anterior hippocampi directly. We found that the left anterior hippocampus represents space and time significantly better than the right anterior hippocampus (Fig. 3). This finding extends the emerging theory of hippocampal lateralization, with evidence that the memory representations of real-life events are left lateralized in the human hippocampus.
Unrecalled Items.
To investigate whether the representation of space and time was stronger for recalled than unrecalled items, we included an additional set of terms in the model:
Recall was coded as 0 for image pairs that were both recalled, as 1 for image pairs that were both unrecalled, and as 0.5 for image pairs in which one item was recalled and the other was unrecalled. We coded recall this way so that the other terms would still reflect the effect for recalled items. The t values of the memory interaction terms across subjects were not significantly different from a null dataset of 1,000 permutations (Table S2). Participants 1 and 5 had very few unrecalled items, so we reran the across-subject t test of the coefficients without these subjects, but the memory interaction results were still not significant (Table S2). Lastly, we ran our original model on only unrecalled items, with subjects 1 and 5 excluded, and we did not find a significant relationship between neural distance and space (average beta = 0.041, t = 0.052, P = 0.97), time (average beta = −0.137, t = −0.38, P = 0.75), or their interaction (average beta = −0.004, t = −0.031, P = 0.97) for unrecalled items. Thus, although the interaction between memory and the spatiotemporal representations in the left anterior hippocampus were not significant, we did not observe the same pattern for unrecalled items when analyzed on their own.
Table S2.
Permutation tests for significance of spatiotemporal coefficients with recall interaction across participants in the left anterior hippocampus
| With participants 1 and 5 | Without participants 1 and 5 | |||||
| Term | P | t | Beta | P | t | Beta |
| Intercept | 0.0001 | −9.51 | −3.17 | 0.0001 | −7.51 | −3.08 |
| Scanner time | 0.0001 | 15.84 | 0.34 | 0.0001 | 12.39 | 0.34 |
| Space | 0.0001 | 5.22 | 0.66 | 0.0050 | 3.94 | 0.59 |
| Time | 0.0001 | 5.74 | 0.36 | 0.0040 | 4.30 | 0.33 |
| Time/space | 0.0001 | −4.64 | −0.11 | 0.0110 | −3.43 | −0.09 |
| Recall | 0.8062 | 0.29 | 0.82 | 0.1469 | 1.65 | 3.52 |
| Space/recall | 0.8941 | −0.18 | −0.15 | 0.1878 | −1.46 | −0.94 |
| Time/recall | 0.7772 | −0.35 | −0.18 | 0.1758 | −1.53 | −0.64 |
| Time/space/recall | 0.8771 | 0.22 | 0.03 | 0.2358 | 1.31 | 0.17 |
With the addition of the factor “recall” indicating the items in the model that were recalled, space, time, and their interaction remain significant in the left anterior hippocampus, but the interactions with recall were not significant. The analysis was repeated with participants 1 and 5 excluded. Space, time, and their interaction remain significant in the left anterior hippocampus with participants 1 and 5 excluded, and the interactions with recall were not significant. Significant coefficients are indicated in bold.
Memory Performance.
Subjects indicated that they recalled an average of 63.4% of presented images, although this percentage was not normally distributed across subjects (Fig. S7).
Discussion
We have shown that the left anterior hippocampus represented the spatial and temporal dimensions of remembered experiences for distances between 100 m and 30 km and for times between 15 h and 1 mo. Although previous studies have identified similar drifts in representational similarity across space or time over the relatively brief time scales (seconds to minutes) that characterize individual episodic memories (22–24), our results provide compelling evidence that a similar pattern of spatiotemporal organization also exists for organizing distinct memories that are distant in space and time. We did not observe a significant effect of recency or proximity of the images on the likelihood that the associated episodes would be recalled. This finding indicates that the relationship we observed between activity patterns in the left anterior hippocampus and space and time is unlikely to be caused by simple recency or proximity effects.
We did find that spatial or temporal contiguity between a recalled image and a subsequently presented image increased the likelihood that the subsequently presented item would be recalled, but only when we included pairs of images from the same event in our analysis. When we excluded pairs of images from the same event, or when we applied the limits on spatial and temporal distances between pairs of images used in our main analysis, we did not find that spatial or temporal contiguity effects were significant. Taken together with the absence of a significant recency or proximity effect, the most likely explanation for the observed relationship between patterns of neural activity in the left anterior hippocampus and spatial and temporal distance is that, in fact, information about spatial and temporal distances is represented in the left anterior hippocampus.
There are some important limitations in the work that we have presented here. By chance, our sample is composed entirely of female participants; therefore, we cannot say with certainty that these results will be generalizable to representation of space and time in males. Another limitation of this work is the spatial resolution of our fMRI, which prevents us from examining the roles of distinct hippocampal subfields. We are also unable to analyze the representation of space and time within events because relatively few images from the same event were presented to each subject. A future study with a more balanced sampling of within- and between-event images may be able to distinguish representation of space and time at these different scales.
Prior fMRI results examining judgment of landmark locations demonstrated that left anterior hippocampal activity is parametrically related to the real-world distance between the currently presented landmark and one that was just seen on the previous trial, providing indirect evidence that the left anterior hippocampus represents spatial information (25). However, both Morgan et al. (25) and a subsequent study (26) were unable to detect metric-based information about spatial distances in the anterior hippocampus using multivoxel pattern analysis. These studies did not use images that represented participants’ previous experiences, so they were unable to include time or the interaction of time and space in their model. We found that neural activity in the left anterior hippocampus correlated with space, time, and their interaction, indicating that mental representations of space and time are perhaps not as distinct as we generally conceive them to be.
Fueling a long-standing debate over the lateralization of episodic memory processes (27), recent work in mice showed that the left, but not the right, hippocampus was essential for associative spatial long-term memory (28), and, as mentioned above, recent work demonstrated that processing of spatial information may be left-lateralized in the human hippocampus as well (25). To test whether our data followed a similar pattern, we compared the left and right anterior hippocampi directly. We found that the left anterior hippocampus represents space and time significantly better than the right anterior hippocampus (Fig. 3). This finding extends the emerging theory of hippocampal lateralization with evidence that the memory representations of real-life events are left-lateralized in the human hippocampus.
In rats, the dorsal hippocampus (analogous to the human posterior hippocampus) represents shorter temporal and spatial scales, whereas the ventral hippocampus (analogous to the human anterior hippocampus) represents longer scales (29–31). Our finding of long spatial scale representation in the human anterior hippocampus, combined with the established involvement of the human posterior hippocampus in memory for shorter spatial scales (32, 33), supports the hypothesis that humans have a gradient of spatial scale along the anteroposterior axis of the hippocampus. Our results suggest that the the maximum scale of spatial representation in the human hippocampus is at least the 30 km we observed here, which is considerably larger than the maximum of about 10 m observed in rats (29). It is possible, however, that the maximal scale of representation is not limited by biology, but by experience. Humans can regularly travel tens, if not hundreds, of kilometers in short periods of time, and so it is in some ways unsurprising that the maximal scale of representation in humans is significantly larger than in rodents raised in a laboratory, which travel, at most, tens of meters in a day.
Taken together, our results point to a critically important role of the left anterior hippocampus in representing our past experiences on the scale of our lives. These large spatial scale representations of space and time give structure to our memories, which may allow us to search our past (34) or imagine the future (35) efficiently, and to make associations and generalizations across nonoverlapping events (30, 31). Based on our current understanding of hippocampal representations, place cells provide spatial relationships (5) and time cells provide temporal relationships (7), yet there is also evidence from recordings in the CA1 subregion of the hippocampus that place codes change over hours and days (36) to weeks (37). The conjunctive spatiotemporal representations we observed suggest space and time are more intimately related in the hippocampus than thought before, providing the thread for weaving the episodic memories of our lives (38).
Methods
Device and Software.
Each participant carried an Android-based smartphone in a pouch attached to a neck strap as shown in Fig. S1 from morning until evening. The smartphone was equipped with a custom lifelogging application that acquired image, time, audio (obfuscated), GPS, accelerometer, and orientation information throughout the day. The participants had control over what data they wanted to share with the experimenters. They were instructed on how to delete data from the phone. They were also allowed to turn the application off or to place a flap over the camera lens at any time during the data collection period when they felt the need for privacy.
The lifelogging application was written by our programmers using Java (Oracle Corporation) to run in the background as a service. Data acquisition times can be fixed or variable, and they can be determined by a movement-based trigger to preserve battery resources when the user is not very active. When the smartphone detects WiFi and is connected to a charger, it sends the collected and stored data automatically to a remote server. This transmission usually happened once per day at the end of the day because users charged the phone overnight. The data were sent in batch mode via SFTP (Secure File Transfer Protocol) for added security and remained inaccessible to other users in the system.
Participants.
Participants were recruited using advertisements placed on notice boards in multiple buildings on the main campus of The Ohio State University. To join the study, potential participants had to be willing to participate in the lifelogging data collection and to be willing and able to undergo an MRI scan. Potential participants with contraindications for receiving an MRI scan were excluded. They were compensated at the rate of $10 per day for wearing the smartphone to collect data and at the rate of $15 per hour for the fMRI session. We recruited 10 participants (aged 19–26 y, mean age = 21.4 y; nine female), nine of whom wore the smartphone for ∼1 mo. The tenth participant wore the smartphone for 2 wk. One participant (male) did not complete the fMRI session due to discomfort in the scanner; therefore, we did not include the data for that participant in any of our analyses. Our study has a similar number of participants as other fMRI studies using lifelogging devices, such as the study of Cabeza et al. (15), which had 13 participants and only collected lifelogging data for 10 d, and the study of Milton et al. (14), which had 10 participants and only collected lifelogging data for 2 d, although there was a 5-mo follow-up in their study.
Ethics Statement.
The research protocol was reviewed and approved by the Institutional Review Board at The Ohio State University. Written informed consent was obtained from all participants, once before the lifelogging data collection phase and once before the fMRI session. Consent was obtained from one participant to use images and locations from that individual’s lifelogging data for Fig. 1.
Other Behavioral Tasks.
At the end of each day, the smartphone was connected to a power outlet to be charged overnight. When connected to the charger and to the Internet, the smartphone automatically uploads data to our server. The images were viewed on a web interface, whose link was uniquely generated for each participant and provided to the participant before data collection. Participants accessed their images on the web interface via a unique link, where they segmented their stream of images into distinct episodes and tagged each episode with a set of tags chosen from a drop-down menu (39). For each episode, they also provided a brief title and description.
After they collected data for 2 wk, participants came into the laboratory on the Thursday of the third week for a weekly discrimination test. Each participant’s test was based on images drawn from her own lifelogs. The weekly discrimination task was described to the participants, and they were told that only images from the weekdays of the preceding 2 wk would be presented on the computer screen. The pictures remained on the screen while they made the weekly judgment, and they could use as much time as they needed to respond. The results of this behavioral task will be analyzed and presented separately.
GPS Data.
The GPS receivers in our lifelogging smartphones were unable to record GPS coordinates when participants were inside some buildings. In these cases, we attempted to determine the coordinates based on the participant’s description of the location and by traveling to the approximate location where the image was taken and searching the area until the scene captured in the image could be identified. We determined the approximate area to search based on GPS data acquired before or after the image with missing GPS data. Once the location had been determined, GPS coordinates were obtained from Google Maps.
MRI Acquisition.
MRI data were acquired on a 3-T Siemens Magnetom Trio Tim system with a 16-channel head coil. Anatomical images were acquired with a sagittal, T1-weighted, magnetization prepared rapid acquisition gradient echo sequence [1.0-mm isotropic voxels, repetition time (TR) = 1,900 ms, echo time (TE) = 4.68 ms, 160 slices with field of view (FoV) = 256 mm]. Functional images were acquired with an echoplanar imaging sequence (2.5-mm isotropic voxels, TR = 3,000 ms, TE = 28 ms, flip angle = 80°, 47 slices with FoV = 250 mm).
Stimuli Selection.
We selected 120 images from each subject’s lifelogging data to present to the subject in the scanner. First, we excluded pictures of floors/ceilings/walls, blurry images, and images with inadequate exposure. Then, we selected images that appeared to have enough detail that they could act as cues for distinct episodes. From this subset of images, we selected images representing events that spanned the entire period each participant wore the lifelogging device, with as uniform sampling of events as possible. We did not take spatial location into account when selecting the images.
fMRI Experiment.
In the scanner, subjects were instructed that they would be viewing images from the experience sampling experiment they recently completed and told that each image would be displayed for 8 s. Subjects were asked to “… try to remember the event depicted in the picture, and try to relive your experience mentally.” After the remembrance period for each event, subjects were asked if they remembered the event (“yes” or “no”) and how vividly they recalled the event (“lots of detail” or “very little detail”). Participants were given 2.5 s to respond to each of those questions using a button box held in their right hand. The images were presented in random order, and the task was split into eight runs with 15 images in each run. With each image presented for 8 s and each question for presented 2.5 s with a 0.5-s interstimulus interval, each trial took a total of 14 s. The intertrial interval was jittered uniformly between 4 and 10 s, allowing for a true event-related design.
fMRI Processing.
fMRI processing was carried out using Analysis of Functional NeuroImages (AFNI) (40) and Functional Magnetic Resonance Imaging of the Brain (FMRIB) Software Library (FSL) (41). The T1-weighted anatomical image was intensity-normalized, skull-stripped, and warped to a 2.5-mm MNI-152 template using 3dQwarp. We selected a 2.5-mm template to match the resolution of the functional scans. For the functional scans, we dropped the first two TRs of each run, then removed spikes with 3ddespike and temporally shifted all of the slices in each volume to the start of the TR using 3dTshift with Fourier interpolation. We then warped the functional scans to template space, blurred them to 4-mm FWHM using 3dBlurtoFWHM, and scaled the voxel values to a mean of 100 (maximum of 200) for each run. At this point, we performed independent component analysis of each functional run with FSL’s MELODIC. Components were visually inspected to identify noise components following published guidelines (42). Noise components were regressed out of the functional runs using FSL’s fsl_regfilt command. We then ran a regression with restricted maximum likelihood estimation of temporal autocorrelation structure on the filtered functional runs using 3dDeconvolve and 3dREMLfit to generate single-trial betas for each reminiscence trial and to regress out the effects of the mean and derivative of motion terms, as well as cerebrospinal fluid signal. The regressor for each image presentation was an 8-s block convolved with a hemodynamic response function. The neural activity of the question prompts were accounted for with a 2.5-s block convoluted with a hemodynamic response function. We modeled response processing and motor activity related to the button push with a set of nine tent functions over the 16 s after the question response. Including these tent functions in our model allowed us to estimate the motor response robustly for each subject so that the signal from the motor responses did not contaminate the single-trial beta fit for each reminiscence period. Lastly, we regressed out local white matter signal with 3dAnaticor. Researchers were not blinded during preprocessing or subsequent analyses.
Previous work has shown that the MTL represents space and time for short distances, so we focused our analysis on regions in the MTL using ROI analysis because the shape of the MTL structures is often problematic for multiple comparison correction procedures. We identified four ROIs from each hemisphere in the MTL: anterior hippocampus, middle hippocampus, posterior hippocampus, and parahippocampal cortex. The parahippocampal ROIs were taken from the Harvard-Oxford subcortical atlas (43), down-sampled to 2.5 mm. The parahippocampal ROI in this atlas includes the parahippocampal, perirhinal, and entorhinal cortices. The hippocampal ROIs were derived by resampling the Harvard-Oxford subcortical atlas to 2.5 mm, extracting the hippocampal regions, and dividing these regions into thirds based on their anteroposterior extent. ROIs from the primary visual cortex in each hemisphere were taken from the Jülich atlas in FSL (44, 45) and resampled to 2.5 mm. We selected the most medial, posterior portion of the primary visual cortex to capture cortical regions corresponding to foveal vision with an ROI of similar size to our MTL ROIs.
Representational Similarity Analysis.
For each pair of images presented to the subjects, we calculated the geodesic distance in meters between the two GPS coordinates and the difference in time in seconds. Geodesic distance was calculated using the GeoPy Python package. Image pairs with spatial distances less than 100 m were excluded because these distances are below the reliability of the GPS radios in these smartphones. Image pairs with temporal distances below 15.6 h were excluded based on prior work because of a discontinuity in the spatiotemporal distribution of image pairs (19) (Fig. S2B). The discontinuity between 14- and 16-h results from subjects taking off their cameras to sleep. This gap is propagated through the rest of the results as a relative lack of image pairs that are multiples of ∼15 h apart. In prior work, we analyzed the structure of lifelogged images and demonstrated that image pairs taken from identical spatiotemporal locations occupied a lower dimensional manifold than those image pairs taken from separate spatiotemporal locations (19). By removing image pairs separated by less than 100 m and 15.6 h, we reduced the possibility that the images themselves would give rise to the present results as a consequence of within- and between-episode image properties. Some subjects spent time out of town during the period of data collection, resulting in a small portion of image pairs with spatial distances greater than 30 km; these image pairs were also excluded. Images that were blurry or contained reflections of the subjects were also excluded.
In our figures and description of our analysis, spatial distance is referred to as space and temporal distance is referred to as time. In each ROI, neural distance for each image pair was calculated as 1 minus the correlation between the voxel-level single-trial betas for the trials corresponding to those image pairs. Neural distances were z-scored within subjects. In each ROI in each subject, we then ran a GLM with the following model:
We used the log of time and space based on previous literature that has shown a power-law relationship for neural representations (20). The scanner time was the number of seconds between presentation of the images during the fMRI experiment. In each ROI, we performed a t test on the betas from the subject-level GLMs to determine if they were significantly different from zero across subjects. We used nonparametric permutation to test for significance (21) because the pairwise nature of the distances in our analysis violated the assumption of independent samples. Neural data were permuted with respect to behavioral data within subjects. This process was repeated for 10,000 permutations of the neural data. The significance of t values was determined as the ratio of the number of permutations with higher absolute value of t values in that ROI for that term divided by the total number of permutations. We then applied the Bonferroni correction to control for the number of ROIs tested (eight MTL ROIs plus two bilateral primary visual cortex ROIs for a total of 10). To visualize the relationship between each term and the neural distance, we isolated the portion of the neural distance that was associated with changes in that term by subtracting the effects of the other terms as estimated on a subject level from the neural distance for each subject. For example, in the graphs for the relationship between space and neural distance, the neural distance has the estimates for the intercept, time, interaction of time and space, and time between presentations in the scanner subtracted out. To compare the significance of different regions for each term, we used the difference between t values between the two regions for that term in each of the 10,000 permutations as the null distribution to generate P values.
Acknowledgments
We thank Marc Howard for discussions, advice, and comments on the manuscript and Emily Weichart for assisting with data processing. This work was supported in part by an allocation of computing time from the Ohio Supercomputer Center. D.M.N. was supported by the Choose Ohio First for Bioinformatics Scholarship. This work was partially supported by Air Force Office of Scientific Research (AFOSR) Grant FA9550-09-1-0614.
Footnotes
The authors declare no conflict of interest.
This article is a PNAS Direct Submission.
Data deposition: The data reported in this paper are available via the corresponding author’s institutional website.
This article contains supporting information online at www.pnas.org/lookup/suppl/doi:10.1073/pnas.1507104112/-/DCSupplemental.
References
- 1.Scoville WB, Milner B. Loss of recent memory after bilateral hippocampal lesions. J Neurol Neurosurg Psychiatry. 1957;20(1):11–21. doi: 10.1136/jnnp.20.1.11. [DOI] [PMC free article] [PubMed] [Google Scholar]
- 2.O’Keefe J, Dostrovsky J. The hippocampus as a spatial map. Preliminary evidence from unit activity in the freely-moving rat. Brain Res. 1971;34(1):171–175. doi: 10.1016/0006-8993(71)90358-1. [DOI] [PubMed] [Google Scholar]
- 3.O’Keefe J, Burgess N. Geometric determinants of the place fields of hippocampal neurons. Nature. 1996;381(6581):425–428. doi: 10.1038/381425a0. [DOI] [PubMed] [Google Scholar]
- 4.Hafting T, Fyhn M, Molden S, Moser M-B, Moser EI. Microstructure of a spatial map in the entorhinal cortex. Nature. 2005;436(7052):801–806. doi: 10.1038/nature03721. [DOI] [PubMed] [Google Scholar]
- 5.McNaughton BL, Battaglia FP, Jensen O, Moser EI, Moser M-B. Path integration and the neural basis of the ‘cognitive map’. Nat Rev Neurosci. 2006;7(8):663–678. doi: 10.1038/nrn1932. [DOI] [PubMed] [Google Scholar]
- 6.Agarwal G, et al. Spatially distributed local fields in the hippocampus encode rat position. Science. 2014;344(6184):626–630. doi: 10.1126/science.1250444. [DOI] [PMC free article] [PubMed] [Google Scholar]
- 7.MacDonald CJ, Lepage KQ, Eden UT, Eichenbaum H. Hippocampal “time cells” bridge the gap in memory for discontiguous events. Neuron. 2011;71(4):737–749. doi: 10.1016/j.neuron.2011.07.012. [DOI] [PMC free article] [PubMed] [Google Scholar]
- 8.Eichenbaum H. Time cells in the hippocampus: A new dimension for mapping memories. Nat Rev Neurosci. 2014;15(11):732–744. doi: 10.1038/nrn3827. [DOI] [PMC free article] [PubMed] [Google Scholar]
- 9.Ekstrom AD, et al. Cellular networks underlying human spatial navigation. Nature. 2003;425(6954):184–188. doi: 10.1038/nature01964. [DOI] [PubMed] [Google Scholar]
- 10.Jacobs J, Kahana MJ, Ekstrom AD, Mollison MV, Fried I. A sense of direction in human entorhinal cortex. Proc Natl Acad Sci USA. 2010;107(14):6487–6492. doi: 10.1073/pnas.0911213107. [DOI] [PMC free article] [PubMed] [Google Scholar]
- 11.Doeller CF, Barry C, Burgess N. Evidence for grid cells in a human memory network. Nature. 2010;463(7281):657–661. doi: 10.1038/nature08704. [DOI] [PMC free article] [PubMed] [Google Scholar]
- 12.Miller JF, et al. Neural activity in human hippocampal formation reveals the spatial context of retrieved memories. Science. 2013;342(6162):1111–1114. doi: 10.1126/science.1244056. [DOI] [PMC free article] [PubMed] [Google Scholar]
- 13.Hodges S, Berry E, Wood K. SenseCam: A wearable camera that stimulates and rehabilitates autobiographical memory. Memory. 2011;19(7):685–696. doi: 10.1080/09658211.2011.605591. [DOI] [PubMed] [Google Scholar]
- 14.Milton F, et al. An fMRI study of long-term everyday memory using SenseCam. Memory. 2011;19(7):733–744. doi: 10.1080/09658211.2011.552185. [DOI] [PubMed] [Google Scholar]
- 15.Cabeza R, et al. Brain activity during episodic retrieval of autobiographical and laboratory events: An fMRI study using a novel photo paradigm. J Cogn Neurosci. 2004;16(9):1583–1594. doi: 10.1162/0898929042568578. [DOI] [PubMed] [Google Scholar]
- 16.Cabeza R, St Jacques P. Functional neuroimaging of autobiographical memory. Trends Cogn Sci. 2007;11(5):219–227. doi: 10.1016/j.tics.2007.02.005. [DOI] [PubMed] [Google Scholar]
- 17.St Jacques PL, Conway MA, Lowder MW, Cabeza R. 2010. Watching my mind unfold versus yours: An fMRI study using a novel camera technology to examine neural differences in self-projection of self versus other perspectives. J Cogn Neurosci 23(6):1275–1284.
- 18.Kriegeskorte N, Mur M, Bandettini P. Representational similarity analysis—Connecting the branches of systems neuroscience. Front Syst Neurosci. 2008;2(4):4. doi: 10.3389/neuro.06.004.2008. [DOI] [PMC free article] [PubMed] [Google Scholar]
- 19.Sreekumar V, Dennis S, Doxas I, Zhuang Y, Belkin M. The geometry and dynamics of lifelogs: Discovering the organizational principles of human experience. PLoS One. 2014;9(5):e97166. doi: 10.1371/journal.pone.0097166. [DOI] [PMC free article] [PubMed] [Google Scholar]
- 20.Gallistel CR, Gibbon J. Time, rate, and conditioning. Psychol Rev. 2000;107(2):289–344. doi: 10.1037/0033-295x.107.2.289. [DOI] [PubMed] [Google Scholar]
- 21.Ernst MD. Permutation methods: A basis for exact inference. Stat Sci. 2004;19(4):676–685. [Google Scholar]
- 22.Manns JR, Howard MW, Eichenbaum H. Gradual changes in hippocampal activity support remembering the order of events. Neuron. 2007;56(3):530–540. doi: 10.1016/j.neuron.2007.08.017. [DOI] [PMC free article] [PubMed] [Google Scholar]
- 23.Ezzyat Y, Davachi L. Similarity breeds proximity: Pattern similarity within and across contexts is related to later mnemonic judgments of temporal proximity. Neuron. 2014;81(5):1179–1189. doi: 10.1016/j.neuron.2014.01.042. [DOI] [PMC free article] [PubMed] [Google Scholar]
- 24.Barnett AJ, O’Neil EB, Watson HC, Lee ACH. The human hippocampus is sensitive to the durations of events and intervals within a sequence. Neuropsychologia. 2014;64C:1–12. doi: 10.1016/j.neuropsychologia.2014.09.011. [DOI] [PubMed] [Google Scholar]
- 25.Morgan LK, Macevoy SP, Aguirre GK, Epstein RA. Distances between real-world locations are represented in the human hippocampus. J Neurosci. 2011;31(4):1238–1245. doi: 10.1523/JNEUROSCI.4667-10.2011. [DOI] [PMC free article] [PubMed] [Google Scholar]
- 26.Epstein RA, Vass LK. Neural systems for landmark-based wayfinding in humans. Philos Trans R Soc Lond B Biol Sci. 2014;369(1635):20120533. doi: 10.1098/rstb.2012.0533. [DOI] [PMC free article] [PubMed] [Google Scholar]
- 27.Habib R, Nyberg L, Tulving E. Hemispheric asymmetries of memory: The HERA model revisited. Trends Cogn Sci. 2003;7(6):241–245. doi: 10.1016/s1364-6613(03)00110-4. [DOI] [PubMed] [Google Scholar]
- 28.Shipton OA, et al. Left-right dissociation of hippocampal memory processes in mice. Proc Natl Acad Sci USA. 2014;111(42):15238–15243. doi: 10.1073/pnas.1405648111. [DOI] [PMC free article] [PubMed] [Google Scholar]
- 29.Kjelstrup KB, et al. Finite scale of spatial representation in the hippocampus. Science. 2008;321(5885):140–143. doi: 10.1126/science.1157086. [DOI] [PubMed] [Google Scholar]
- 30.Komorowski RW, et al. Ventral hippocampal neurons are shaped by experience to represent behaviorally relevant contexts. J Neurosci. 2013;33(18):8079–8087. doi: 10.1523/JNEUROSCI.5458-12.2013. [DOI] [PMC free article] [PubMed] [Google Scholar]
- 31.Strange BA, Witter MP, Lein ES, Moser EI. Functional organization of the hippocampal longitudinal axis. Nat Rev Neurosci. 2014;15(10):655–669. doi: 10.1038/nrn3785. [DOI] [PubMed] [Google Scholar]
- 32.Hirshhorn M, Grady C, Rosenbaum RS, Winocur G, Moscovitch M. Brain regions involved in the retrieval of spatial and episodic details associated with a familiar environment: An fMRI study. Neuropsychologia. 2012;50(13):3094–3106. doi: 10.1016/j.neuropsychologia.2012.08.008. [DOI] [PubMed] [Google Scholar]
- 33.Poppenk J, Evensmoen HR, Moscovitch M, Nadel L. Long-axis specialization of the human hippocampus. Trends Cogn Sci. 2013;17(5):230–240. doi: 10.1016/j.tics.2013.03.005. [DOI] [PubMed] [Google Scholar]
- 34.Conway MA, Pleydell-Pearce CW. The construction of autobiographical memories in the self-memory system. Psychol Rev. 2000;107(2):261–288. doi: 10.1037/0033-295x.107.2.261. [DOI] [PubMed] [Google Scholar]
- 35.Szpunar KK, Spreng RN, Schacter DL. A taxonomy of prospection: Introducing an organizational framework for future-oriented cognition. Proc Natl Acad Sci USA. 2014;111(52):18414–18421. doi: 10.1073/pnas.1417144111. [DOI] [PMC free article] [PubMed] [Google Scholar]
- 36.Mankin EA, et al. Neuronal code for extended time in the hippocampus. Proc Natl Acad Sci USA. 2012;109(47):19462–19467. doi: 10.1073/pnas.1214107109. [DOI] [PMC free article] [PubMed] [Google Scholar]
- 37.Ziv Y, et al. Long-term dynamics of CA1 hippocampal place codes. Nat Neurosci. 2013;16(3):264–266. doi: 10.1038/nn.3329. [DOI] [PMC free article] [PubMed] [Google Scholar]
- 38.Howard MW, Eichenbaum H. 2014 Time and space in the hippocampus. Brain Res, 10.1016/j.brainres.2014.10.069. Available at www.sciencedirect.com/science/article/pii/S0006899314014917. Accessed December 21, 2014.
- 39.Hamm J, Stone B, Belkin M, Dennis S. Automatic annotation of daily activity from smartphone-based multisensory streams. In: Uhler D, Mehta K, Wong JL, editors. Mobile Computing, Applications, and Services, Lecture Notes of the Institute for Computer Sciences, Social Informatics and Telecommunications Engineering. Springer; Berlin: 2013. pp. 328–342. [Google Scholar]
- 40.Cox RW. AFNI: Software for analysis and visualization of functional magnetic resonance neuroimages. Comput Biomed Res. 1996;29(3):162–173. doi: 10.1006/cbmr.1996.0014. [DOI] [PubMed] [Google Scholar]
- 41.Smith SM, et al. Advances in functional and structural MR image analysis and implementation as FSL. Neuroimage. 2004;23(Suppl 1):S208–S219. doi: 10.1016/j.neuroimage.2004.07.051. [DOI] [PubMed] [Google Scholar]
- 42.Kelly RE, Jr, et al. Visual inspection of independent components: Defining a procedure for artifact removal from fMRI data. J Neurosci Methods. 2010;189(2):233–245. doi: 10.1016/j.jneumeth.2010.03.028. [DOI] [PMC free article] [PubMed] [Google Scholar]
- 43.Desikan RS, et al. An automated labeling system for subdividing the human cerebral cortex on MRI scans into gyral based regions of interest. Neuroimage. 2006;31(3):968–980. doi: 10.1016/j.neuroimage.2006.01.021. [DOI] [PubMed] [Google Scholar]
- 44.Amunts K, Malikovic A, Mohlberg H, Schormann T, Zilles K. Brodmann’s areas 17 and 18 brought into stereotaxic space-where and how variable? Neuroimage. 2000;11(1):66–84. doi: 10.1006/nimg.1999.0516. [DOI] [PubMed] [Google Scholar]
- 45.Eickhoff SB, et al. Assignment of functional activations to probabilistic cytoarchitectonic areas revisited. Neuroimage. 2007;36(3):511–521. doi: 10.1016/j.neuroimage.2007.03.060. [DOI] [PubMed] [Google Scholar]
- 46.Sederberg PB, Miller JF, Howard MW, Kahana MJ. The temporal contiguity effect predicts episodic memory performance. Mem Cognit. 2010;38(6):689–699. doi: 10.3758/MC.38.6.689. [DOI] [PubMed] [Google Scholar]
- 47.Owen AM. HERA today, gone tomorrow? Trends Cogn Sci. 2003;7(9):383–384. doi: 10.1016/s1364-6613(03)00195-5. [DOI] [PubMed] [Google Scholar]